
Market Overview
| Study Period | 2020 - 2031 |
|---|---|
| Market Size (2026) | USD 1.86 Billion |
| Market Size (2031) | USD 2.99 Billion |
| Growth Rate (2026 - 2031) | 9.96 % |
| Fastest Growing Market | Asia Pacific |
| Largest Market | Asia Pacific |
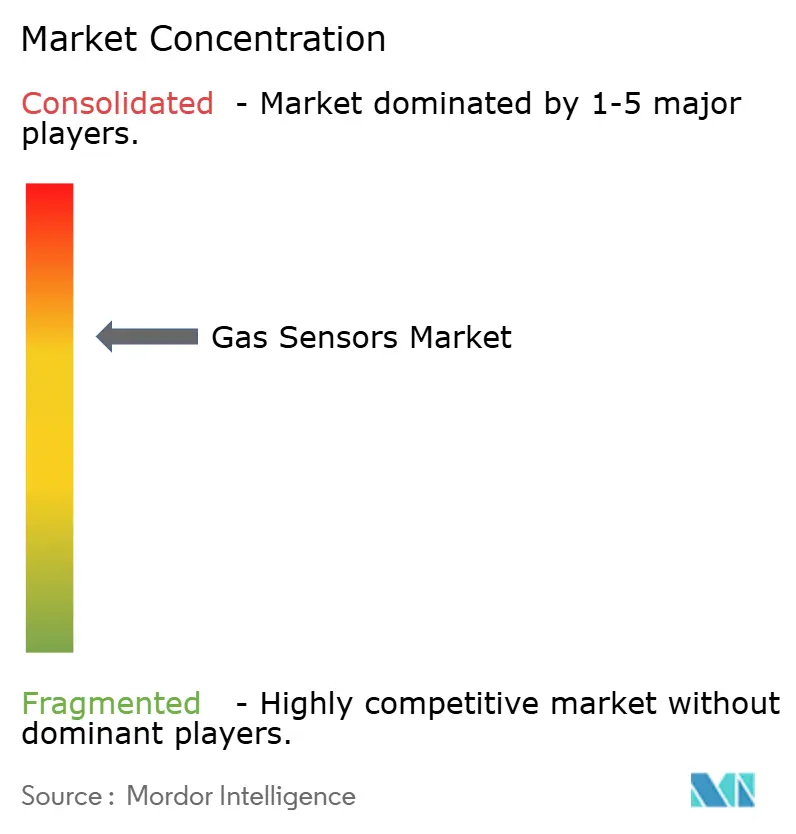
| Market Concentration | Medium |
Major Players
*Disclaimer: Major Players sorted in no particular order Image © Mordor Intelligence. Reuse requires attribution under CC BY 4.0. |
|
Gas Sensors Market Analysis by Mordor Intelligence
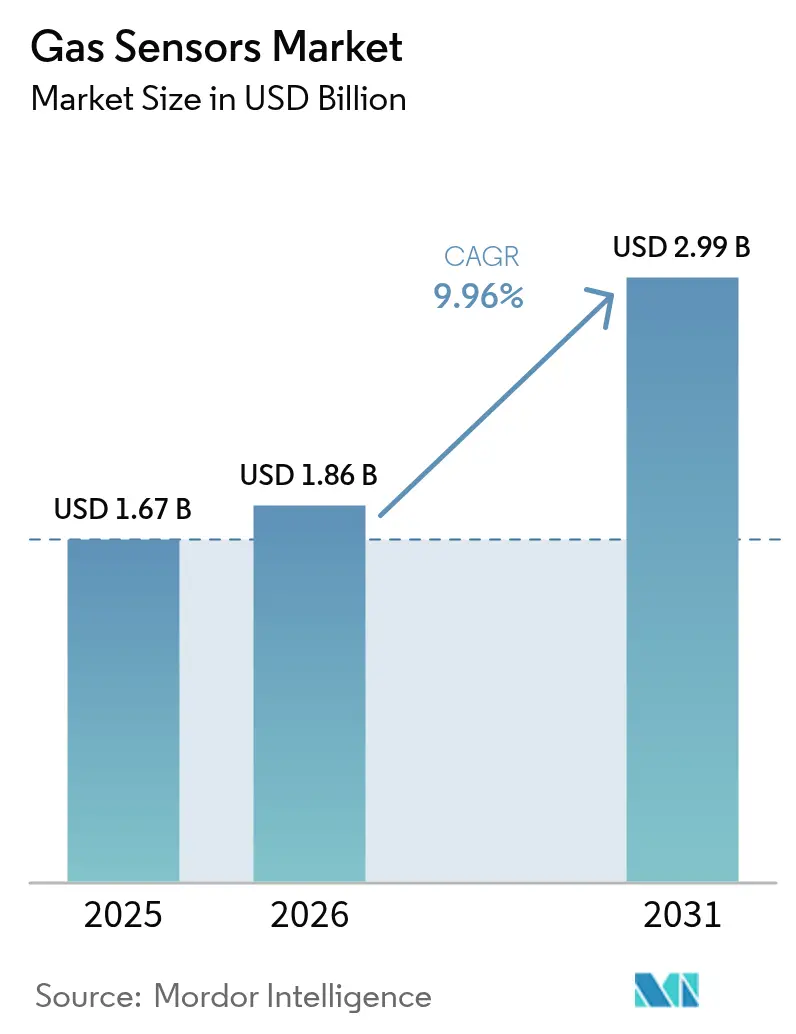
The gas sensors market size is expected to increase from USD 1.67 billion in 2025 to USD 1.86 billion in 2026 and reach USD 2.99 billion by 2031, growing at a CAGR of 9.96% over 2026-2031. Tightening vehicle-emission rules, large smart-city air-quality programs, and the rapid build-out of hydrogen production sites are combining to lift annual sensor shipments across automotive, industrial, and municipal end users. Electrochemical cells still dominate toxic-gas detection because they offer sub-ppm accuracy, yet multi-channel MEMS-optical arrays are scaling quickly as designers shrink footprints for wearables and IoT edge nodes. Demand is also migrating from wired 4-20 mA loops to wireless protocols that slash installation labour in brownfield plants. Meanwhile, the competitive field remains moderately fragmented, giving mid-tier specialists room to differentiate on ultra-low power draw, cross-sensitivity mitigation, or bundled cloud analytics.
Key Report Takeaways
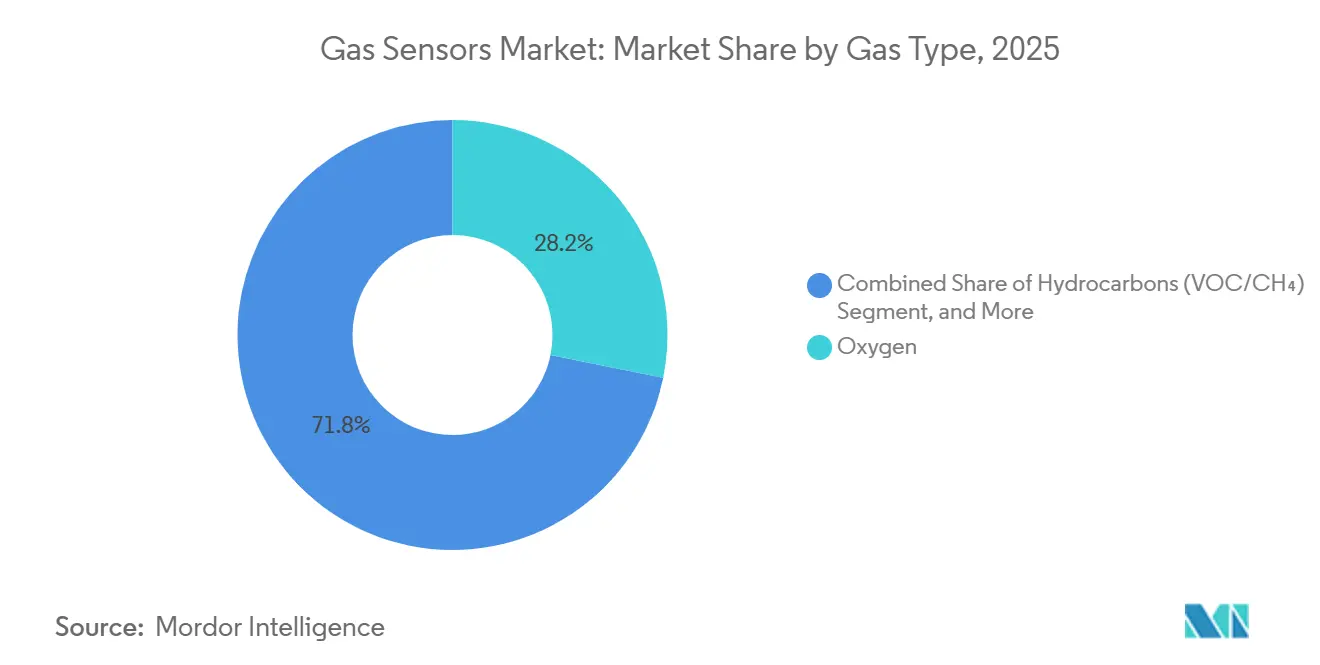
- By gas type, oxygen led with 28.19% of gas sensors market share in 2025, while hydrocarbons are projected to advance at an 11.77% CAGR to 2031.
- By technology, electrochemical sensors held 35.45% of the gas sensors market size in 2025, and MEMS-optical arrays record the fastest growth at 11.95% CAGR through 2031.
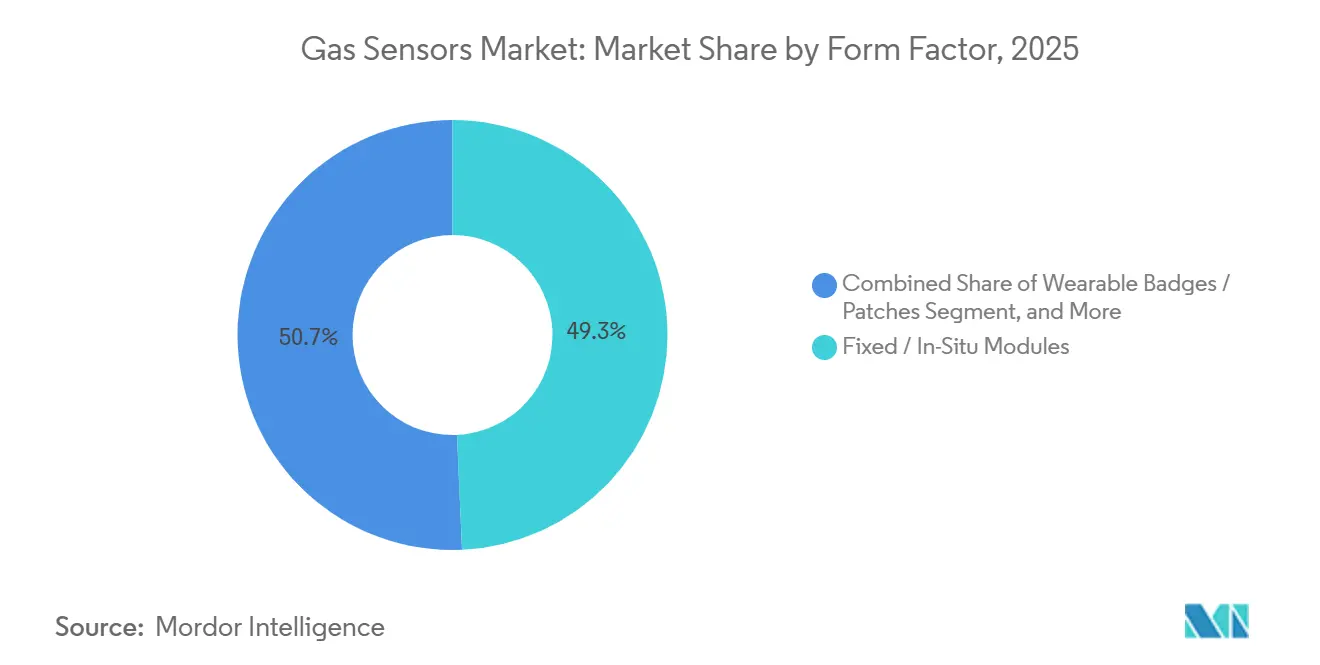
- By form factor, fixed modules accounted for 49.29% of revenue in 2025, whereas wearables are forecast to expand at an 11.82% CAGR to 2031.
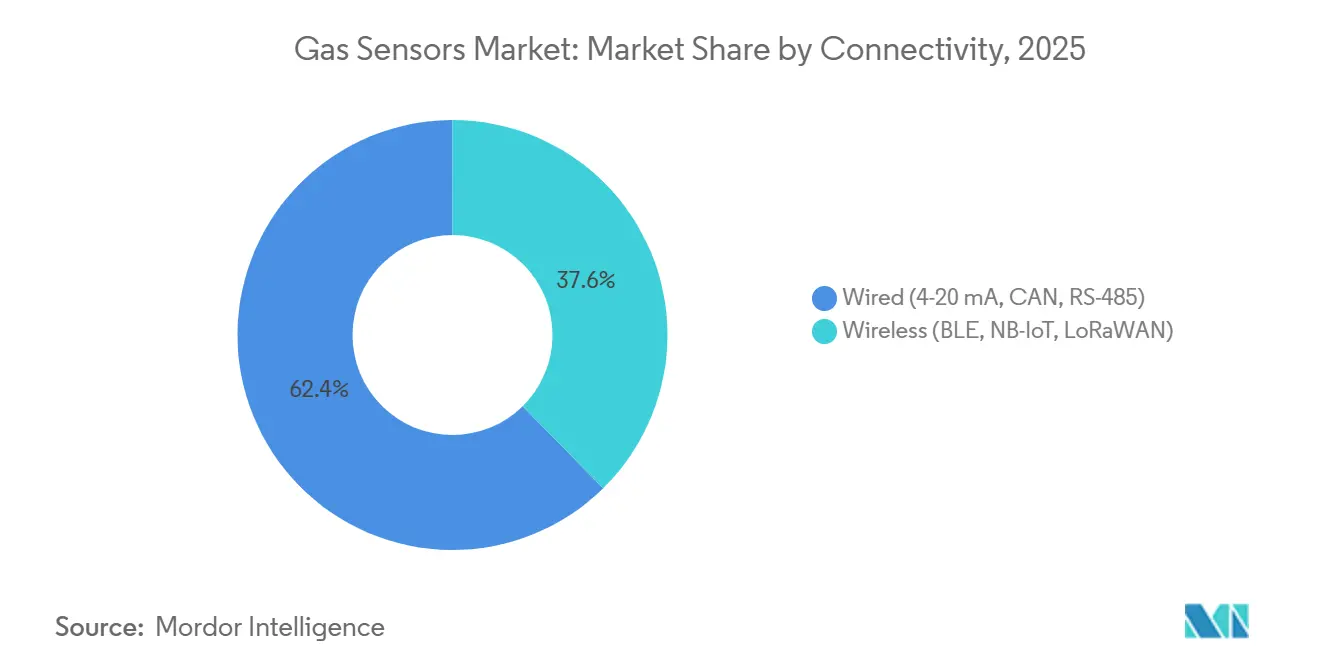
- By connectivity, wired links retained 62.37% share in 2025, yet wireless nodes are rising at a 12.11% CAGR through 2031.
- By end-use, industrial safety captured 31.86% share in 2025, while environmental monitoring is set to grow at a 12.06% CAGR to 2031.
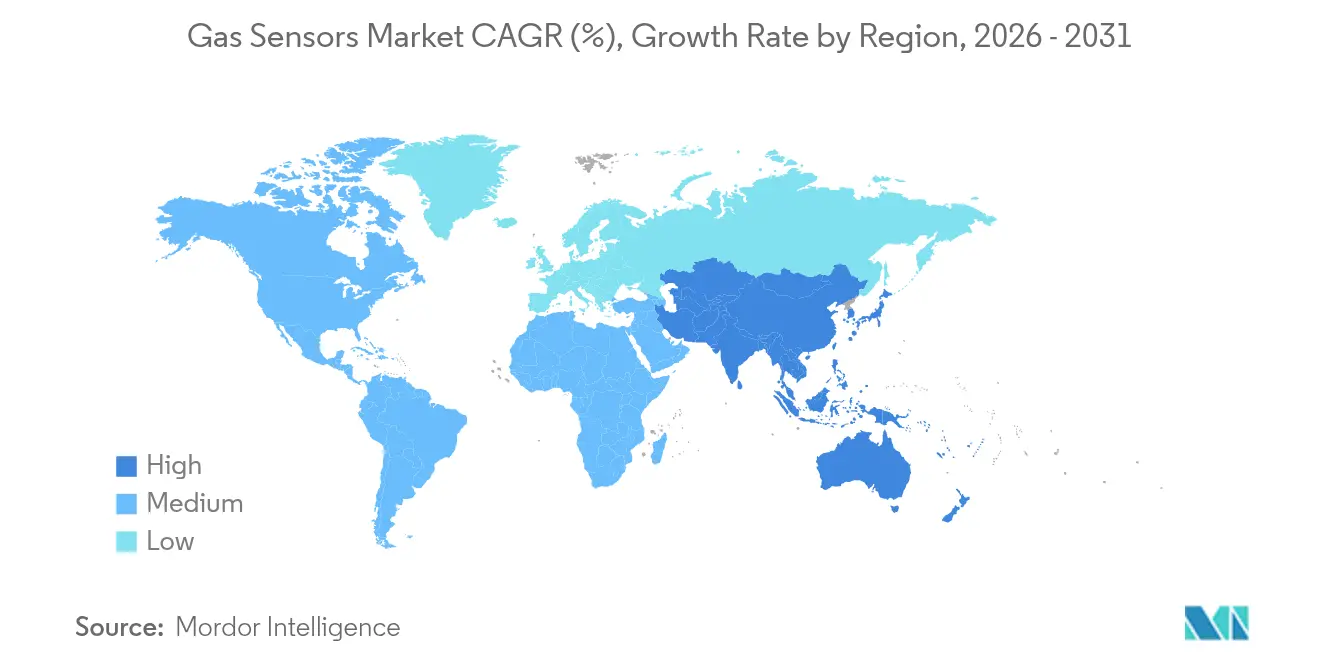
- Asia-Pacific contributed 36.12% of 2025 revenue and is also the fastest-advancing region at an 11.59% CAGR over 2026-2031.
Note: Market size and forecast figures in this report are generated using Mordor Intelligence’s proprietary estimation framework, updated with the latest available data and insights as of 2026.
Market Trends and Insights
Drivers Impact Analysis of Gas Sensors Market*
| Driver | (~) % Impact on CAGR Forecast | Geographic Relevance | Impact Timeline |
|---|---|---|---|
| Stricter Vehicle On-Board Diagnostics (Euro 7, EPA Tier 3) | +2.80% | Europe, North America, China (National VI-b) | Medium term (2-4 years) |
| IoT-Enabled Air-Quality Monitoring Roll-Outs (Smart Cities) | +2.10% | Global, with concentration in Asia-Pacific megacities and European Union urban zones | Medium term (2-4 years) |
| Surging Demand from Hydrogen Production and Fuel-Cell Value Chain | +1.60% | North America, Europe, Japan, South Korea | Long term (≥ 4 years) |
| Workplace Safety Mandates (OSHA, REACH, ISO 45001) | +1.40% | Global, strongest enforcement in North America and Europe | Short term (≤ 2 years) |
| Emerging Methane-Leak Detection Rules for Oil and Gas (OGMP 2.0) | +1.20% | Global, early adoption in North America and Middle East | Medium term (2-4 years) |
| Miniaturised MEMS-Based Multi-Gas Arrays (< 3 mm) Driving ASP Uplift | +0.90% | Global, led by consumer electronics and wearable device manufacturers | Long term (≥ 4 years) |
| Source: Mordor Intelligence | |||
Stricter Vehicle On-Board Diagnostics
Euro 7 rules effective July 2025 cut allowable nitrogen-oxide slip to 10 mg km⁻¹ for the full vehicle life, forcing automakers to install dual NOₓ probes with self-diagnostic redundancy.[1] In the United States, EPA Tier 3 tightened fleet-average NOₓ to 30 mg mile⁻¹, while China’s National VI-b mirrors the same thresholds, together covering close to 90 million light-duty vehicles per year. Tier-1 suppliers now specify zirconia cells that survive 850 °C exhaust streams and deliver sub-5 s response. Larger order volumes are compressing average selling prices but are also boosting total unit demand. Multi-gas modules that simultaneously read NOₓ, ammonia slip, and hydrocarbons are emerging to trim wiring and ECU costs.[2]
IoT-Enabled Air-Quality Monitoring Rollouts
Cities are moving from one regulatory-grade station per 100 000 residents to grid densities of 10-50 low-cost nodes km⁻², generating hyperlocal maps in real time. The European Union cut annual PM₂. ₅ limits to 10 µg m⁻³ and NO₂ to 20 µg m⁻³ in 2024, prompting Milan, Warsaw, and Athens to deploy supplementary electrochemical and NDIR arrays. China has surpassed 5 000 automated stations and plans another 2 000 township nodes by 2027.[3] India budgeted INR 22 billion (USD 265 million) in 2025 for networks across 132 non-attainment cities. Platforms from Siemens, ABB, and Teledyne upload data to cloud dashboards that apply drift correction, trimming field service visits by 25%.[4]
Surging Demand from Hydrogen Production and Fuel-Cell Value Chain
Global electrolyzer additions reached 8 GW in 2025, and the pipeline exceeds 50 GW, propelled by production credits of up to USD 3 kg⁻¹ in the United States and the European Repower EU plan. Electrolyzers require trace oxygen sensors below 10 ppm at 70 bars, while fuel-cell vehicles integrate three hydrogen leak detectors per unit to comply with SAE J2578. Refuelling stations now exceed 1 200 worldwide, each using catalytic bead pairs for emergency shut off. Solid-state MOS probes are replacing carrier-gas chromatographs in steam-methane reformers, lowering five-year ownership cost by 40%.
Workplace Safety Mandates
OSHA cut the 8-hour hydrogen-sulfide limit to 5 ppm and imposed a 10 ppm 15-minute ceiling in 2024, triggering plant-wide deployment of personal gas badges. Europe’s REACH added formaldehyde and benzene to its very high concern list in 2025, mandating continuous monitoring in pharma and specialty-chemical lines. ISO 45001 accreditation now demands real-time alert logs, driving Bluetooth-enabled wearables from Honeywell and Dräger that stream live readings to supervisory tablets. OSHA penalties for inadequate detection rose 35% year on year to USD 120 million in 2025, pushing firms toward proactive exposure prevention.
Restraints Impact Analysis of Gas Sensors Market*
| Restraint | (~) % Impact on CAGR Forecast | Geographic Relevance | Impact Timeline |
|---|---|---|---|
| Sub-10 ppm Cross-Sensitivity Challenges in Mixed-Gas Matrices | -1.80% | Global, most acute in chemical processing and confined-space applications | Medium term (2-4 years) |
| Silicon Supply Volatility Inflating Wafer Prices | -1.20% | Global, concentrated impact on MEMS and solid-state sensor manufacturers | Short term (≤ 2 years) |
| Lack of Global Calibration Standards Hampers Interchangeability | -0.90% | Global, regulatory fragmentation between North America, Europe, and Asia | Long term (≥ 4 years) |
| Cost Pressure from Low-End Chinese Electrochemical Suppliers | -0.70% | Global, strongest impact in building automation and consumer segments | Medium term (2-4 years) |
| Source: Mordor Intelligence | |||
Sub-10 ppm Cross-Sensitivity Challenges in Mixed Gas Matrices
Platinum-based CO cells respond to hydrogen at about 50% of CO sensitivity, while H₂S cells cross-respond 20-30% to SO₂, leading to costly application-specific validation that can add 25% to project budgets. MOS sensors have even wider interference bands, and ISO 17025 covers only single-gas calibrations, leaving end users to design custom test regimes. Alphasense released a Kalman-filter front-end chip in 2025 that cuts transient false positives yet adds USD 15-30 to each module.
Silicon Supply Volatility Inflating Wafer Prices
A 15% jump in 150-200 mm wafer prices in early 2025 lengthened lead times from 12 to 20 weeks, squeezing fabless designers such as Sensirion and ScioSense. Bosch and STMicroelectronics leveraged captive fabs, but total 200 mm capacity additions of 150 000 wpm in 2025 fell short of demand, a gap that IC Insights expects to persist beyond 2028. Alternative substrates like glass or SOI require fresh process qualification, delaying volume rollouts by two years or more.
*Our forecasts treat driver/restraint impacts as directional, not additive. The impact forecasts reflect baseline growth, mix effects, and variable interactions.
Gas Sensors Market Segment Analysis
By Gas Type:
Oxygen Sustains Scale While Hydrocarbons AccelerateOxygen probes delivered 28.19% of 2025 revenue thanks to universal use in lambda control, industrial combustion tuning, and ventilators. The gas sensors market size for oxygen detection remains buoyed by zirconia cells that achieve sub-1% accuracy across −40 °C to 850 °C. Hydrocarbons, including VOCs and methane, are advancing at an 11.77% CAGR because OGMP 2.0 compels quarterly surveys at upstream sites, boosting sales of photo-ionization detectors and open-path laser spectrometers.
Hydrogen-rich atmospheres in electrolyzers and fuel-cell vehicles are pushing demand for trace oxygen and nitrogen sensors able to measure below 10 ppm at 70 bars. CO₂ sensors benefited from HVAC retrofits that hold in-room levels under 800 ppm. Nitrogen-oxide probes rose sharply after Euro 7 but saw unit price erosion from USD 45 to 38. Premium pricing persists for SO₂, NH₃, and Cl₂ modules that ship in explosion-proof enclosures.

By Technology:
Electrochemical Dominates, MEMS-Optical Gains ShareElectrochemical devices held 35.45% of 2025 value, backed by high selectivity in single-gas contexts. MEMS-optical arrays are climbing at an 11.95% CAGR, integrating micro-mirrors and IR detectors within 3 mm packages that fit wearables and phones. The gas sensors market share of MEMS modules is widening as ASPs stay high relative to discrete designs.
PID instruments remain niche for hazmat teams, whereas MOS parts offer the lowest bill-of-materials but drift under humidity swings, requiring frequent zeroing. NDIR remains indispensable for CO₂ and hydrocarbon analysis in ambient stations where 15-year lifetimes justify USD 50-150 pricing. Catalytic beads still dominate residential methane alarms, though silicone poisoning is nudging premium installations toward infrared options.
By Form Factor:
Wearables Rise Beside Established Fixed ModulesFixed in-situ modules kept 49.29% share in 2025 because process plants need line-powered, wired analyzers certified for hazardous zones. Yet wearables are growing at 11.82% CAGR as rules force every worker in confined areas to carry a personal badge. The gas sensors market size for wearables is swelling on the back of clip-on devices that now weigh 120 g and run 48 h on a lithium-polymer cell. GPS and accelerometer functions support man-down alerts.
Portable handheld meters occupy the middle ground for maintenance crews. Design priorities are shifting toward ruggedized plastics that resist caustic washdowns and toward wireless uplinks that automate exposure logbooks under ISO 45001.
By Connectivity:
Wireless Protocols Unlock Retrofit ApplicationsWired links still accounted for 62.37% of 2025 shipments, favoured in refineries that demand deterministic latency. NB-IoT, LoRaWAN, and BLE nodes are scaling at a 12.11% CAGR, cutting conduit labour and enabling five-year battery life. The gas sensors market size attributable to wireless shipments is expanding fastest where building codes allow battery nodes to serve as secondary monitors.
NB-IoT excels in dense urban grids, while LoRaWAN covers landfills and farms across 15 km ranges. BLE dominates consumer and occupational badges that sync directly to phones. Cybersecurity fears lead many plants to keep primary alarms on wired loops and place wireless units on segregated VPN gateways that add USD 500-2 000 per site.
By End-Use Industry:
Environmental Monitoring Overtakes Growth LeadershipIndustrial safety topped 31.86% of 2025 revenue but faces mid-single-digit growth as many legacy plants already comply with baseline rules. Environmental monitoring nodes are climbing at a 12.06% CAGR because municipal air-quality grids qualify for green-bond financing and must meet WHO limits. The gas sensors market share for city networks is broadening as average node counts rise from hundreds to tens of thousands per metropolis.
Automotive powertrains are absorbing dual NOₓ and CO₂ sensors, especially in plug-in hybrids that switch combustion modes frequently. Building automation retrofits accelerated after ASHRAE 62.1 moved the CO₂ trigger from 1 000 ppm to 800 ppm. Medical, food, and cold-chain niches remain small in volume yet command premium ASPs up to USD 800 per module.
Geography Analysis
APAC Gas Sensors Market
Asia-Pacific generated 36.12% of 2025 revenue and is forecast to grow at an 11.59% CAGR, the fastest regional pace. China operates more than 5 000 government air-quality stations and will add 2 000 township nodes by 2027, each specified for <10% annual drift. India budgeted INR 22 billion (USD 265 million) under its National Clean Air Programme, mandating NDIR SO₂ and NOₓ probes in thermal plants. Japan aims for 1 000 hydrogen stations by 2030, boosting demand for catalytic bead detectors certified to ISO 19881, while South Korea’s Green New Deal earmarked KRW 1.8 trillion for smart factories with wireless sensor grids.
North America Gas Sensors Market
North America provided roughly 28% of 2025 turnover. OSHA’s stricter hydrogen-sulfide limits triggered plant-wide badge issuance, and the Inflation Reduction Act’s USD 3 kg⁻¹ hydrogen credit stimulated more than 15 GW of electrolyzer projects needing trace oxygen sensors. Canada’s methane rule mandates quarterly leak checks, while Mexico expanded continuous monitoring across 1 200-point sources.
Europe Gas Sensors Market
Europe held about 24% share in 2025. The EU cut PM₂. ₅ and NO₂ limits, forcing southern capitals to deploy dense IoT nodes. Germany extended continuous emission rules to medium combustion plants, adding 8 000 new installations. The United Kingdom fixed a binding PM₂. ₅ target under the Environment Act 2021, and France introduced indoor-air monitoring in all schools.
MEA Gas Sensors Market
Middle East and Africa contributed close to 8% of revenue. Saudi Aramco’s Jafurah gas field is fitting H₂S networks across wellheads, and the UAE installed 150 ambient stations in 2025. South Africa lowered diesel particulate limits in mines, prompting retrofits with BLE badges.
South America Gas Sensors Market
South America accounted for 4% of revenue, led by Brazil’s sugarcane ethanol complexes and Argentina’s Vaca Muerta shale pads, both of which now mandate fixed methane and CO detectors on compressor skids.
Regulatory Landscape
Gas sensor requirements are tightening across safety, emissions, and building codes, with compliance increasingly tied to formal performance, software, and functional-safety standards. In the United States, ANSI/UL 2075 (Edition 2) was revised effective March 26, 2025 for toxic and combustible gas detectors used in non-hazardous locations, reinforcing test and safety expectations for widely deployed residential and light-commercial devices.
Across regions, regulatory pull is also coming from (i) workplace exposure and chemical controls (for example, EU REACH restrictions driving continuous monitoring for substances such as formaldehyde and benzene in specialty-chemical and pharma lines, as reflected in the report scope) and (ii) digital-functional safety standards for fixed systems and software-driven apparatus (for example, BS EN 50271:2018 for digital technologies and GSO EN 50402:2024 for functional safety of gas detection systems). Trade and supply policy has also become a compliance factor: February 2026 U.S. Customs and Border Protection actions on certain semiconductors and April 2026 reciprocal U.S.-China tariff standardization at 10% for instruments under HS 9025-9031 can affect landed costs and qualification choices for globally sourced sensing modules.
Value Chain Analysis
The value chain covers raw materials and substrates (silicon wafers for MEMS/solid-state devices, ceramic elements, and precious-metal catalysts for electrochemical cells), sensing element fabrication and packaging (including hazardous-area designs that require ATEX/IECEx pathways), module assembly and connectivity integration (wired 4-20 mA/CAN/RS-485 and wireless BLE/NB-IoT/LoRaWAN), and distribution through OEM channels (automotive Tier-1s, HVAC/building automation integrators) and industrial safety distributors, followed by calibration, field commissioning, and recurring service. Service layers are expanding as end users move from stand-alone instruments to systems that capture alert logs and exposure histories aligned with workplace safety and audit needs (for example, ISO 45001-style digital recordkeeping referenced in the report context).
Bottlenecks and differentiators on the supply side center on certification throughput, component availability, and application validation. Certification backlogs at ATEX/IECEx notified bodies in Germany and the UK can delay hazardous-area launches by six to nine months, while early-2025 wafer price and lead-time volatility pressures fabless suppliers relative to companies with captive capacity. Downstream, providers increasingly bundle calibration and analytics with hardware to reduce drift and cross-sensitivity burden in mixed-gas environments, supporting recurring revenue while lowering total ownership cost for industrial and municipal deployments.
Competitive Landscape
The gas sensors market remains moderately fragmented; the top five suppliers Bosch, Honeywell, Sensirion, Drägerwerk, and Figaro Engineering held an estimated 42% share in 2025. Bosch expanded Reutlingen MEMS output by 30 million automotive NOₓ and O₂ dies after a EUR 150 million (USD 165 million) investment, shaving die cost by 20%. Honeywell bought Carrier’s industrial refrigeration detection line, adding ammonia leak systems that extend its City Technology cell range.
Sensirion closed its acquisition of Senseair in 2024, consolidating CO₂ sensing for HVAC and vehicle cabins, and in January 2026 released the SCD42 photoacoustic module that draws just 15 mW. Patent filings show Honeywell focusing on machine-learning drift compensation, while Bosch is co-packaging NOₓ and NH₃ heaters to halve power draw. NevadaNano’s molecular property spectrometer uses acoustic resonance to all but eliminate calibration for combustible-gas alarms, positioning the firm as a disruptive entrant.
Chinese challengers such as Zhengzhou Winsen sell CO₂ and VOC cells at 30-40% lower prices, rapidly gaining share in smart homes and building automation. Yet shorter calibration cycles and higher cross-sensitivity limit penetration in safety-critical use cases. Foundry constraints remain a strategic lever: firms with captive 200 mm lines secure priority wafers amid ongoing silicon shortages, while fabless rivals sign multi-year take-or-pay deals that squeeze gross margins.
Gas Sensors Industry Leaders
-
Robert Bosch GmbH
-
Honeywell International Inc. (City Technology)
-
Drägerwerk AG & Co. KGaA
-
Figaro Engineering Inc.
-
Sensirion Holding AG
- *Disclaimer: Major Players sorted in no particular order
Gas Sensors Market Companies Covered in this Report
- Robert Bosch GmbH
- Honeywell International Inc. – City Technology
- Drägerwerk AG & Co. KGaA
- Figaro Engineering Inc.
- Sensirion Holding AG
- AlphaSense Inc.
- Amphenol SGX Sensortech Ltd.
- Membrapor AG
- Nemoto and Co., Ltd.
- Niterra Co., Ltd. (NGK-NTK)
- Delphi Technologies (BorgWarner Inc.)
- Senseair AB (Asahi Kasei Microdevices)
- Dynament Ltd.
- Siemens AG – BT Sensors
- ABB Ltd. – Ability Gas Analytics
- Yokogawa Electric Corporation
- Emerson Electric Co. – Rosemount
- Teledyne FLIR LLC
- General Electric Company – Panametrics
- Zhengzhou Winsen Electronics Technology Co., Ltd.
- NevadaNano Inc.
- MSA Safety Incorporated
Market Opportunities and Future Outlook
Hydrogen and emissions compliance programs continue to open whitespace for higher-selectivity, lower-maintenance sensing in harsh or safety-critical environments. In hydrogen production and dispensing, the report context highlights electrolyzer build-outs and refueling stations that require trace oxygen measurement below 10 ppm at elevated pressures and multiple hydrogen leak detectors per fuel-cell vehicle to meet SAE J2578, creating demand for rugged, low-drift sensors and simplified calibration workflows. On the emissions side, April 2026 U.S. EPA activity around National Emission Standards proposals for crude oil and natural gas production supports continued procurement of methane and hydrocarbon detection across upstream and midstream operations, reinforcing demand for fixed networks and survey-grade instruments.
Product and standards activity in 2026 also points to clearer opportunity areas in industrial flammable-gas detection and connected fleet management. Honeywell launched a 4-Series NDIR hydrocarbon gas sensor in March 2026 for methane, propane, and butane detection in industrial settings, supporting a shift toward optical approaches that reduce poisoning sensitivity versus catalytic bead designs in some applications. In China, GB 15322.1-2026 and GB 15322.2-2026 for point-type industrial/commercial and domestic flammable gas detectors reinforce requirements that favor suppliers with compliant designs and documentation, while software platforms that centralize exposure logs and device health align with end users migrating from discrete detectors to managed fleets across industrial safety and environmental monitoring deployments.
Recent Industry Developments in Gas Sensors Market
- June 2026: Honeywell announced enhanced capabilities for its Safety Suite 2.0 software focused on fleet management of portable gas detectors, adding historical data views and dashboarding. The update strengthens the shift from stand-alone instruments to connected compliance workflows that reduce manual recordkeeping and support faster response across multi-site operations.
- March 2026: Honeywell launched its 4-Series NDIR hydrocarbon gas sensor for detecting flammable gases such as methane, propane, and butane in industrial environments. The release expands optical sensing options for safety-critical applications where resistance to poisoning and reduced maintenance burden can differentiate against catalytic bead solutions.
- August 2024: Honeywell introduced an end-to-end Emissions Management Suite for offshore oil and gas assets with marine certification, pairing monitoring software with hardware updates including solar-powered gas detector upgrades. The offering aligns gas detection with emissions reporting and compliance needs in remote environments where power and maintenance access are constrained.
Gas Sensors Market Report Scope and Research Methodology
Market Definition and Coverage
This market covers revenues generated from gas sensing devices used to detect and measure targeted gases across industrial, commercial, and consumer environments, where value is counted at the point of sensor sale or integration into a sensing module.
Scope exclusions: We exclude standalone gas analyzers and complete safety systems where the sensing element is not priced and tracked as a distinct gas sensor product.
Segments Covered in This Report
-
By Gas Type
- Oxygen
- Carbon Monoxide (CO)
- Carbon Dioxide (CO?)
- Nitrogen Oxides (NO?)
- Hydrocarbons (VOC/CH?)
- Other Gases (SO?, H?S)
-
By Technology
- Electrochemical
- Photo-Ionisation (PID)
- Solid-State / MOS
- Catalytic Bead
- Non-Dispersive Infra-Red (NDIR)
- MEMS-Semiconductor Optical
-
By Form Factor
- Fixed / In-Situ Modules
- Portable / Hand-Held Devices
- Wearable Badges / Patches
-
By Connectivity
- Wired (4-20 mA, CAN, RS-485)
- Wireless (BLE, NB-IoT, LoRaWAN)
-
By End-Use Industry
- Industrial Safety and Process (Oil and Gas, Chemicals)
- Automotive Powertrain and HVAC
- Building Automation / Smart Homes
- Medical and Life-Science Equipment
- Food, Beverage and Cold-Chain Logistics
- Environmental Monitoring and Smart City Nodes
-
By Geography
-
North America
- United States
- Canada
- Mexico
-
South America
- Brazil
- Argentina
-
Europe
- Germany
- United Kingdom
- France
- Russia
-
Asia-Pacific
- China
- Japan
- India
- South Korea
-
Middle East and Africa
-
Middle East
- United Arab Emirates
- Saudi Arabia
-
Africa
- South Africa
- Rest of Africa
-
Middle East
-
North America
Data Sources, Market Sizing, and Validation
Desk Research
Desk work was used to set the market boundary, map where sensors are used, and build a realistic demand story by region before any modeling started. We relied on public sources such as workplace safety and exposure standards, environmental monitoring guidance, and building safety codes that often specify when gas detection is required and how frequently systems are inspected.
To anchor inputs, we also reviewed trade and production statistics for electronics and sensing components, customs data for relevant sensor shipments, and patent databases to understand which sensing principles are gaining adoption. Company annual reports, product catalogs, investor presentations, and trusted industry press helped us sanity check pricing direction and typical product positioning across fixed, portable, and wearable use cases. We also used a paid subscription for company financials and intelligence to support revenue splits where public reporting was limited. These sources are illustrative only, and many additional references were used for data collection, cross-checking, and clarification during the study.
Primary Interviews and Surveys
Primary work focused on validating what the desk inputs could not fully explain, mainly adoption rates by end-use setting, typical replacement cycles, and how sensor pricing shifts with performance and certification needs. We spoke with a mix of manufacturers, channel partners, system integrators, and end users across APAC, EMEA, and the Americas, so assumptions could be corrected before finalizing the model.
Distribution of primary research fieldwork respondents
| Company type | Respondent position | Region |
|---|---|---|
| Top tier: 32% | CXOs: 17% | APAC: 39% |
| Mid tier: 50% | Functional/Unit leaders: 38% | EMEA: 35% |
| Smaller Players: 18% | Managers: 45% | Americas: 26% |
Market-Sizing & Forecasting
Sizing starts from a top-down demand pool build that links sensor consumption to where gas monitoring is typically deployed, and then scales it by region using industrial activity and safety compliance intensity. For each major application area, volumes were inferred using indicators such as installed base of industrial sites with detection needs, building automation penetration, automotive sensing content trends, and environmental monitoring deployment patterns, which are then converted to value using realistic ASP ranges.
Those totals were then cross-checked with selective bottom-up approximations, including sampled price-by-volume checks for common sensor types and channel feedback on mix shifts across electrochemical, MOS, infrared, catalytic, and photo-ionization solutions. Where supplier reporting was incomplete, gaps were handled by applying peer-based revenue per product line and adjusting with primary feedback on shipment mix by form factor (fixed, portable, wearable). Forecasts were built using scenario analysis supported by expert views on regulation timing, industrial capex cycles, and adoption in smart buildings and connected devices, and then smoothed so year-to-year growth stays consistent with observable demand signals.
Data Validation & Update Cycle
Outputs were validated by comparing results against independent signals such as regional industrial production trends, safety regulation momentum, and visible pricing movements for mainstream sensor technologies. Variances are investigated through analyst review, and follow-up outreach is triggered when a country or end-use line item moves outside expected ranges or conflicts with interview guidance.
Before sign-off, the model and assumptions go through multiple review steps so calculation logic, units, and currency treatment are consistent across regions. The report is refreshed annually, and interim updates are made when material events occur, such as major regulation changes or sharp supply-demand shifts. Right before delivery, we run a final update pass so the numbers reflect the latest available information.
Mordor Intelligence's Global Gas Sensors Market Market Size Compared Against Other Published Estimates
Published market values for gas sensors can look far apart because firms do not always count the same products, and they also make different calls on which end-use deployments qualify as a gas sensor sale. Differences also come from the base year picked, the currency conversion timing used, and whether forecast growth is built from regulation led adoption or from more aggressive technology diffusion assumptions.
The biggest gaps usually show up when some studies bundle full detection systems, controllers, or analyzer equipment into the same revenue pool, which makes the number jump even if sensor volumes are similar. Other spreads come from ASP logic, where one model assumes a fast move to higher priced sensors in all regions, while another keeps price and mix changes tied to certification needs and replacement cycles that were confirmed in interviews.
Benchmark comparison
| Source | Market Size | Gaps in Research Methodology |
|---|---|---|
| Mordor Intelligence | USD 1.86 B (2026) | |
| Industry Research Group A | USD 3.10 B (2024) | Uses an earlier base year and appears to fold detector and analyzer style revenues into the same pool, which inflates value beyond sensor-only hardware and modules. |
| Industry Research Group B | USD 1.77 B (2024) | Anchors on 2024 revenues and mixes in broader technology groupings, where application mapping and regional coverage can shift the counted volumes and average selling prices. |
The table shows a wide spread that is largely explained by scope and timing, and in Mordor Intelligence's model the value is counted for gas sensors and sensor modules by form factor and connectivity, rather than bundling full detection systems and analyzers into the same revenue line. Once definitions are aligned and pricing is tied back to real replacement and compliance patterns, the remaining differences become much smaller and easier to reconcile.
Key Questions Answered in the Report
How large will the gas sensors market be by 2031?
It is projected to reach USD 2.99 billion by 2031, growing at a 9.96% CAGR from 2026.
Which gas type segment is expanding the fastest?
Hydrocarbon sensors, driven by stricter methane-leak rules, are advancing at an 11.77% CAGR through 2031.
Why are wireless gas sensors gaining ground in plants?
NB-IoT, LoRaWAN, and BLE models cut conduit labor costs and enable five-year battery life, spurring a 12.11% CAGR for wireless nodes.
Which region leads in gas sensor demand?
Asia-Pacific holds the largest share at 36.12% of 2025 revenue and also posts the fastest growth at an 11.59% CAGR.
How fragmented is supplier competition?
The top five vendors command around 42% of sales, indicating moderate fragmentation with room for niche entrants.
What is the impact of Euro 7 on sensor uptake?
Euro 7 forces dual NO? probes in every diesel vehicle, increasing annual automotive sensor demand and compressing unit prices.