
Gas Sensor, Detector And Analyzer Market Size and Share
Market Overview
| Study Period | 2020 - 2031 |
|---|---|
| Market Size (2026) | USD 5.21 Billion |
| Market Size (2031) | USD 6.84 Billion |
| Growth Rate (2026 - 2031) | 5.59 % |
| Fastest Growing Market | Asia Pacific |
| Largest Market | Asia Pacific |
| Market Concentration | Medium |
Major Players
*Disclaimer: Major Players sorted in no particular order Image © Mordor Intelligence. Reuse requires attribution under CC BY 4.0. |
|
Gas Sensor, Detector And Analyzer Market Analysis by Mordor Intelligence
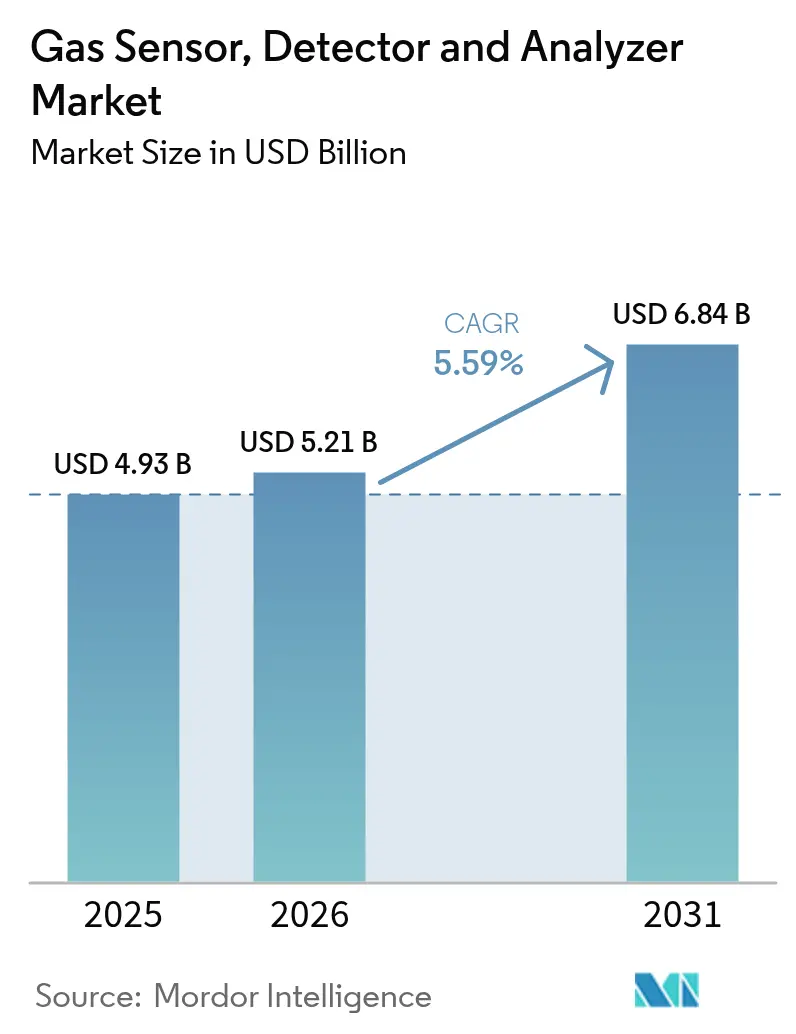
The Gas Sensor, Detector, and Analyzer Market size is expected to grow from USD 4.93 billion in 2025 to USD 5.21 billion in 2026 and is forecast to reach USD 6.84 billion by 2031 at 5.59% CAGR over 2026-2031. Robust enforcement of occupational safety statutes, expanding green hydrogen build-outs, and IoT-centric monitoring architectures collectively underpin this steady trajectory. Momentum is shifting from legacy detectors to miniaturized, multi-parameter sensors that can stream continuous data into analytics platforms. Industrial buyers are increasingly favoring integrated hardware-software bundles that convert raw readings into actionable safety intelligence, which is accelerating the replacement of standalone systems. Supply-side competition, therefore, revolves around sensor selectivity, power efficiency, and secure connectivity rather than basic detection capability. Asia Pacific, led by China and India, remains the pivotal demand engine as regulators align domestic codes with global best practice, while North America and Europe sustain demand through upgrade cycles and tightening emissions limits.
Key Report Takeaways
- By product category, sensors led with a 47.33% share of the gas sensor, detector, and analyzer market in 2025, whereas detectors are projected to register the fastest growth of 6.78% CAGR through 2031.
- By technology, electrochemical modules held 37.08% share of the gas sensor, detector, and analyzer market size in 2025, and semiconductor devices are forecast to expand at 5.66% CAGR during 2026-2031.
- By communication type, wired installations accounted for 68.72% of the revenue in 2025; wireless architectures are expected to grow at a 6.95% CAGR as 5G and LoRaWAN overcome earlier latency and security concerns.
- By end-user industry, the oil and gas sector accounted for 24.31% of the gas sensor, detector, and analyzer size in 2025, while the pharmaceutical industry is poised for a 5.73% CAGR, driven by stringent clean-room validation rules.
- By geography, Asia Pacific captured 35.42% share in 2025 and is projected to log the fastest 5.86% CAGR to 2031 as regional manufacturing scales under harmonized safety mandates.
Note: Market size and forecast figures in this report are generated using Mordor Intelligence’s proprietary estimation framework, updated with the latest available data and insights as of 2026.
Market Trends and Insights
Drivers Impact Analysis of Gas Sensor, Detector And Analyzer Market*
| Driver | (~) % Impact on CAGR Forecast | Geographic Relevance | Impact Timeline |
|---|---|---|---|
| Increasing Safety Awareness Regarding Occupational Hazards | +1.2% | Global, with strongest impact in North America and Europe | Medium term (2-4 years) |
| Proliferation of Handheld Multigas Detectors | +0.8% | Asia Pacific core, spillover to Middle East and Africa | Short term (≤ 2 years) |
| Rising Stringency of Emission Control Regulations | +1.5% | North America and EU, expanding to Asia Pacific | Long term (≥ 4 years) |
| Growing Adoption of IoT-Enabled Gas Monitoring Solutions | +1.1% | Global, led by developed markets | Medium term (2-4 years) |
| Rapid Expansion of Green Hydrogen Production Facilities | +0.7% | Europe and Asia Pacific, emerging in North America | Long term (≥ 4 years) |
| Miniaturization of Photoacoustic Spectroscopy Sensors | +0.3% | North America and Europe | Long term (≥ 4 years) |
| Source: Mordor Intelligence | |||
Increasing Safety Awareness Regarding Occupational Hazards
Rising public scrutiny of workplace fatalities has prompted industrial operators to incorporate continuous detection into their standard operating procedures. OSHA recorded 5,190 worker deaths in 2024, with exposure to gases accounting for 8% of those incidents. Insurance carriers now offer discounts of up to 25% on premiums when certified detection networks are installed, making compliance a direct cost-saving measure. Expanded mandates also reach “non-traditional” settings such as food processing plants, forcing first-time buyers to enter the gas sensor, detector, and analyzer market. Demand therefore shifts from episodic purchase cycles to programmatic rollouts tied to enterprise-wide safety KPIs.
Proliferation of Handheld Multigas Detectors
Portable multigas units have transitioned from specialty gear to first-response essentials following the International Association of Fire Chiefs' endorsement in 2024 for all emergency teams.[1] Current devices feature six-gas arrays with cross-sensitivity trimmed to below 2%, enabling firefighters and maintenance crews to validate hazards in real-time. Battery life now stretches to 72 hours, eliminating mid-shift downtimes, while GPS and cellular backhauls convert each worker into a mobile sensing node. This behavioral shift supports sustained double-digit unit volumes, especially across fast-growing Southeast Asian construction sectors.
Rising Stringency of Emission Control Regulations
Climate policy reforms are being directly translated into sensor line-item budgets. The European Commission’s 2024 Industrial Emissions Directive sliced permissible NOx thresholds by 40%, obliging power stations to install continuous sampling systems with 95% uptime.[2] The EPA’s parallel methane rule mandates quarterly surveys of oil and gas assets using optical or equivalent sensors. Because non-compliance fines in the United States average USD 15,625 per violation, operators prioritize certified analyzers capable of parts-per-billion resolution and automated audit trails.
Growing Adoption of IoT-Enabled Gas Monitoring Solutions
Seventy-seven percent of manufacturing sites worldwide now stream detection data into cloud dashboards, up from 52% two years ago, according to the Industrial Internet Consortium.[3] Edge analytics reduces false alarms by 45% and decreases maintenance call-outs, while encrypted IEC 62443 protocols alleviate cybersecurity concerns. Vendors bundling sensors, gateways, and software analytics therefore realize higher recurring revenue, and this integrative model is steering consolidation moves among tier-one suppliers.
Restraints Impact Analysis of Gas Sensor, Detector And Analyzer Market*
| Restraint | (~) % Impact on CAGR Forecast | Geographic Relevance | Impact Timeline |
|---|---|---|---|
| High Initial Installation and Calibration Costs | -0.9% | Global, most pronounced in emerging markets | Short term (≤ 2 years) |
| Limited Sensor Selectivity Leading to Cross-Sensitivity Errors | -0.6% | Global, particularly affecting multi-gas applications | Medium term (2-4 years) |
| Shortage of Skilled Calibration Technicians in Emerging Economies | -0.4% | Asia Pacific, Middle East, and Africa | Long term (≥ 4 years) |
| Data Security Concerns in Cloud-Connected Detection Networks | -0.3% | Global, concentrated in critical infrastructure sectors | Medium term (2-4 years) |
| Source: Mordor Intelligence | |||
High Initial Installation and Calibration Costs
A full-plant wired detection grid can cost USD 25,000-75,000, and annual calibration contracts add 20-30% to ownership outlays. Forty percent of factories in emerging Asia defer upgrades because budgets are exhausted by other capital projects. Subscription models are gaining traction, trimming entry costs by as much as 70%, yet many small operators still treat gas monitoring as discretionary until regulators intervene.
Limited Sensor Selectivity Leading to Cross-Sensitivity Errors
Electrochemical cells often misclassify gases when humidity and temperature swing, fueling 8-12% false positives per NIST field trials. Every misread forces a work stoppage, so operators remain wary of adopting networked arrays in complex chemical plants. Machine-learning filters improve accuracy but increase device cost and power consumption, constraining deployment in low-margin sectors, such as municipal wastewater treatment.
*Our forecasts treat driver/restraint impacts as directional, not additive. The impact forecasts reflect baseline growth, mix effects, and variable interactions.
Gas Sensor, Detector And Analyzer Market Segment Analysis
By Product Category:
Sensors Drive Integration FlexibilityIn value terms, sensors captured 47.33% of the gas sensor, detector, and analyzer market share in 2025, reflecting their plug-and-play compatibility within distributed architectures. The segment is expected to grow at a 6.62% CAGR to 2031, driven by the miniaturization of MEMS detectors that can be embedded directly into machinery panels without requiring structural retrofits. Detectors sustain relevance for confined-space alerts and firefighter kits, whereas analyzers dominate lab and emissions-reporting contexts that demand parts-per-million precision. Manufacturers now collapse these boundaries, offering hybrid modules under IEC 62990 for universal slot-in use, a move expected to reinforce sensor-first design approaches.
Second-generation platforms fold alarms, analytics, and cloud gateways into a single housing, cutting installation hours by 35%. Smaller vendors can now exploit open-standard protocols to sell niche analyzers that integrate seamlessly with tier-one supervisory systems, thereby reducing vendor lock-in concerns. This interoperability steers procurement away from one-off detector orders toward enterprise-wide framework agreements, and the gas sensor, detector, and analyzer market, therefore, inches toward larger average contract values.


By Technology:
Semiconductor Innovation Disrupts Electrochemical DominanceElectrochemical stacks still hold 37.08% of the gas sensor, detector, and analyzer market size because their cost-performance ratio remains favorable in legacy deployments. Nevertheless, semiconductor arrays are driving near-term innovation, with a 5.66% CAGR in operational durability and sub-milliwatt power budgets. Non-dispersive infrared heads maintain a stronghold niche for CO₂ trace detection in food packaging, while paramagnetic loops safeguard oxygen purity in inerting systems. Catalytic beads endure in hydrocarbon environments, where intrinsically safe ratings outweigh selectivity concerns.
Advanced photoacoustic cells, although currently more expensive, offer multi-gas capabilities with compact footprints; patent filings for this class increased by 45% in 2024, underscoring the heightened R&D investments. Regulatory bodies are noticing: the EPA cleared several novel sensor chemistries for mandated leak surveys last year. Consortia expect end users to phase in these solid-state variants as battery life targets extend beyond five years and calibration cycles widen to annual intervals.
By Communication Type:
Wireless Gains Despite Security ConcernsWired backbones still transmit 68.72% of detection data, a figure rooted in industrial mistrust of radio links for life-critical services. Even so, wireless nodes are climbing at 6.95% CAGR as 5G deterministic networks and LoRaWAN low-power profiles demonstrate <100 ms latency. The Federal Communications Commission (FCC) doubled the unlicensed spectrum for industrial IoT in 2024, thereby widening channel availability for dense sensor clusters. Batteries and energy harvesting enable instrumentation in Class I, Division 1 zones where power wiring is cost-prohibitive.
Standards bodies have mitigated cyber risks through certificate-based authentication within WirelessHART and ISA100.11a suites. Vendors add edge-compute chips that quarantine the measurement loop from the corporate network, satisfying CISO audits. Consequently, the addressable gas sensor, detector, and analyzer market expands into brownfield sites that were previously deemed wiring-impossible, particularly within sprawling midstream pipelines.

By End-User Industry:
Pharmaceuticals Accelerate Beyond Traditional MarketsOil and gas remained the largest buyer cohort, accounting for 24.31% of 2025 spending, primarily driven by methane leak surveys and refinery turnarounds. However, pharmaceutical plants now post a 5.73% CAGR as FDA process-validation rules prescribe continuous monitoring to protect drug sterility. Clean-room contracts often bundle hundreds of nodes into a single facility, directing high-margin revenue toward suppliers familiar with Good Manufacturing Practice documentation.
Chemical and petrochemical complexes maintain baseline volumes for combustible-gas arrays, while water utilities implement H₂S and chlorine monitoring to comply with worker-safety regulations. Mining houses embed kits into battery-electric vehicles underground, balancing the risks of explosions against the need for efficient ventilation. Food processors utilize CO₂ probes to verify modified-atmosphere packaging, a niche market growing in tandem with the expansion of plant-based meat manufacturing. Each application incrementally widens the gas sensor, detector, and analyzer market, shifting it from a heavy-industry monopoly to a multi-vertical mainstream.
Geography Analysis
APAC Gas Sensor, Detector and Analyzer Market
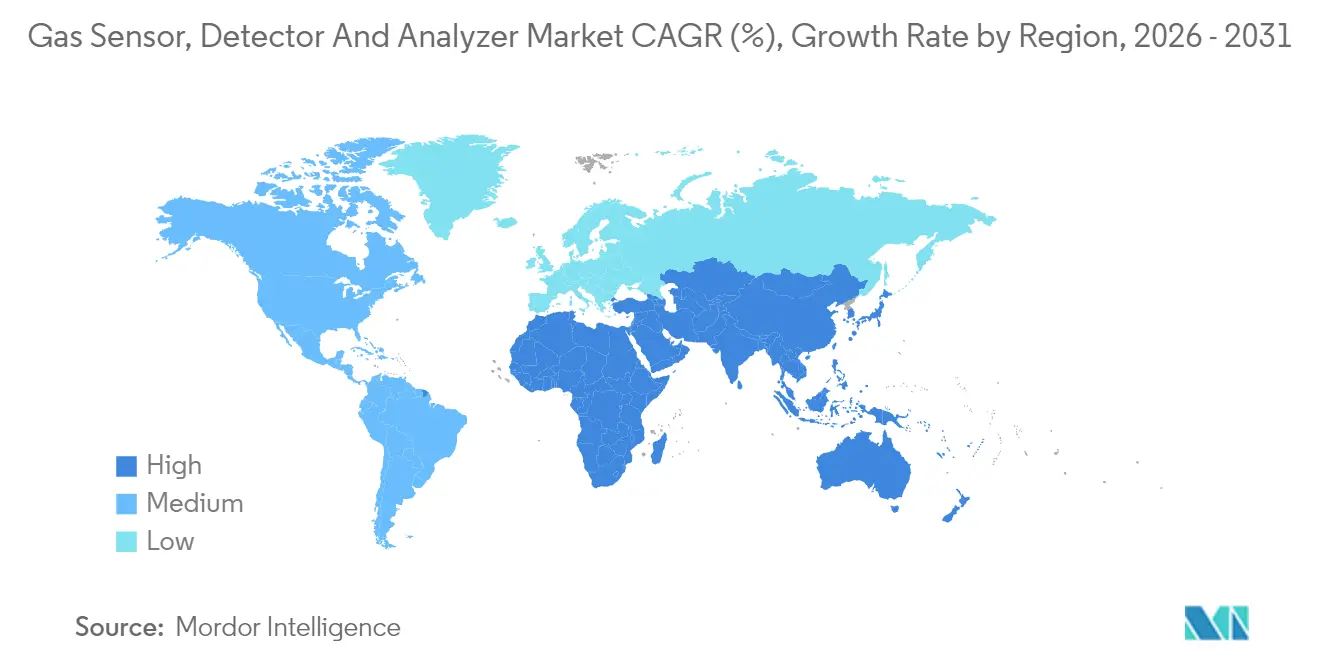
Asia Pacific controlled 35.42% of 2025 revenue and is advancing at a 5.86% CAGR. China enforces GB/T 50493-2024, which compels chemical producers to install multi-point detection networks, while India’s amended Factories Act mandates real-time monitoring in hazardous units. Japanese OEMs, such as Figaro Engineering, export MEMS sensors that reduce power consumption by 30%, thereby accelerating adoption among cost-sensitive Southeast Asian SMEs. South Korea’s shipyards deploy marine-grade detectors resistant to salt spray, and Australia’s underground mines opt for long-range mesh networks to overcome rock-mass RF attenuation.
North America Gas Sensor, Detector and Analyzer Market
North America shows replacement-driven stability rather than first-time adoption. OSHA’s confined-space code ensures the health of portable detector volumes, and Canada’s oil-sands operators require ruggedized analyzers capable of operating at -40 °C. Upcoming U.S. methane legislation will enforce quarterly leak surveys, ensuring sustained orders for optical imagers and high-accuracy analyzers. Mexico’s growing automotive clusters are also installing CO and NO₂ arrays in paint-shop ventilation, adding incremental unit sales.
EMEA and South America Gas Sensor, Detector and Analyzer Market
Europe emphasizes near-continuous emissions monitoring. Power generators equipped with NOx scrubbers must verify exhaust levels of less than 15 ppm under the 2024 Industrial Emissions Directive. Germany integrates sensor outputs into Industry 4.0 platforms, feeding predictive maintenance algorithms that prevent furnace trips. The United Kingdom’s offshore wind farms require H₂S monitoring during monopile grouting, while Poland’s copper mines adopt flameproof detectors as production pivots to battery metals. South America, the Middle East, and Africa round out the landscape, with the former driven by copper and lithium projects, and the latter by refinery expansions and gas-powered desalination plants.
Regulatory Landscape
Compliance requirements for gas sensors, detectors, and analyzers sit within safety and emissions regimes that specify certified performance, traceability, and suitability for explosive atmospheres. In the European Union, the ATEX Directive 2014/34/EU continues to govern equipment used in potentially explosive environments, alongside the EMC Directive 2014/30/EU and Low Voltage Directive 2014/35/EU for electrical and electromagnetic conformity. In North America, ANSI/UL 2075 (Gas and Vapor Detectors and Sensors) was revised and finalized in March 2025, reflecting updated safety requirements for detectors and sensors used in non-hazardous locations, and certification alignment efforts also reference Canada-focused work on ULC-S588.
Standardization updates are tightening test methods and accelerating harmonization across jurisdictions, which feeds into vendor product roadmaps and certification cycles. EN IEC 60079-29-0:2026 (published under the IEC/CENELEC framework in early 2026) updates general requirements and test methods for gas detection equipment in explosive atmospheres, reinforcing IEC 60079-29 series compliance as a procurement gate for hazardous-area deployments. In Southeast Asia, national frameworks such as Thailand (TISI) and Singapore increasingly reference IECEx-aligned expectations for hazardous industrial equipment, pushing manufacturers toward globally testable designs rather than region-specific variants.
Value Chain Analysis
The value chain starts with sensing materials and components (electrochemical cell chemistries, MEMS/semiconductor dies, infrared sources and optics, photoacoustic modules). It then moves into module and instrument assembly (fixed and portable detectors, analyzers, and integrated sensor nodes), followed by system integration into plant safety and control layers (wired and wireless gateways, protocols such as WirelessHART/ISA100.11a, and cloud software for dashboards, audit trails, and fleet management). Calibration gases, accessories, and service networks (commissioning, periodic bump tests, calibration and maintenance contracts) provide recurring downstream revenue, especially in regulated industries that require documented uptime and validation.
Two forces are reshaping how suppliers position across the chain: compliance harmonization and mission-critical end-market build-outs. On the compliance side, national adoption pathways for IEC 60079-29-0 are advancing, including the Standards Council of Canada initiating development work in May 2026 and BSI publishing BS EN IEC 60079-29-0:2026 in January 2026, which supports multi-market design and reduces duplicated certification effort. On the end-market side, large industrial gas suppliers are expanding on-site and high-purity supply models that sit adjacent to downstream sensing demand in semiconductors and hydrogen. Air Liquide announced an investment of over USD 170 million in July 2026 to build production units in Indiana to supply ultra-pure gases for SK hynix, Air Products was selected in April 2026 to supply nitrogen, oxygen, argon, and hydrogen to Samsung Electronics in Pyeongtaek, and Messer reached a milestone in July 2026 with a 10-year renewable hydrogen contract and a 30% equity entry into four hydrogen production sites with Lhyfe. These projects increase the installed base of gas-handling infrastructure where continuous monitoring and certified detection are embedded into operational procedures and vendor service contracts.
Competitive Landscape
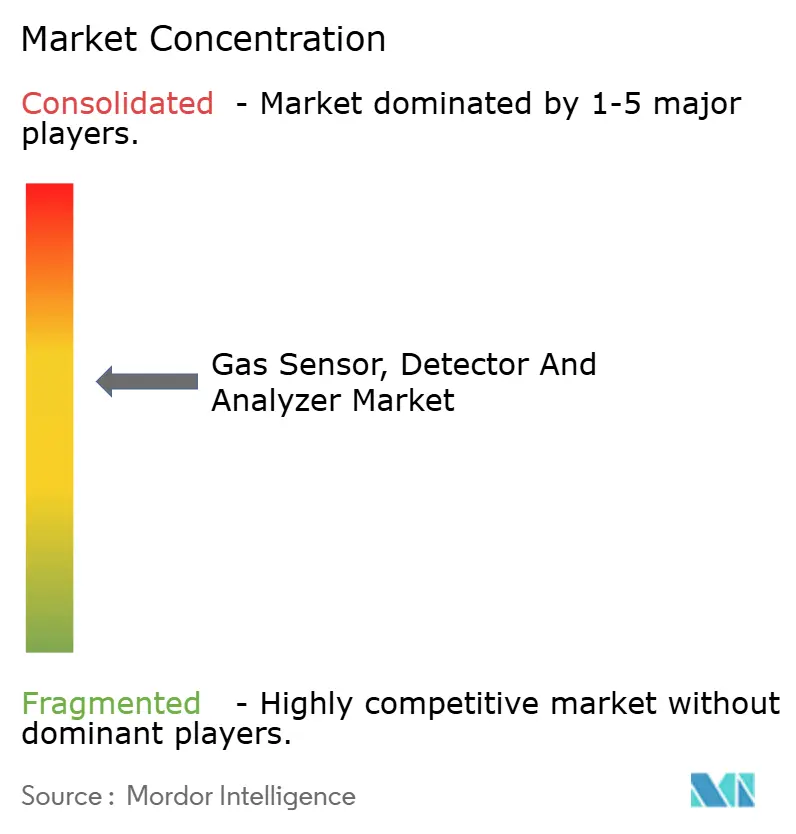
The field remains moderately fragmented despite headline acquisitions. Honeywell, Siemens, and Emerson collectively account for roughly 38% of 2024 revenue, yet more than 200 smaller firms serve regional or application-specific niches. Scale players weaponize M and A to fold advanced chemistries into broader automation suites; Siemens’ 2025 takeover of Sensirion’s industrial arm added MEMS arrays that bridge process-control and building-automation sales channels. Honeywell’s USD 180 million plant upgrade earmarks capacity for semiconductor sensors, underscoring a strategic pivot away from purely electrochemical catalogs.
Software capability now differentiates winners. Emerson’s Rosemount 6888 detector bundles edge analytics to flag drift events before calibration expires, and Draeger-Microsoft’s Azure alliance marries detector fleets with AI-driven predictive models. Smaller innovators leverage IEC 62990 interoperability to integrate specialized photoacoustic cells without recreating full monitoring stacks, allowing them to focus on core sensing IP. Patent filings around low-power photoacoustic designs highlight intensifying R&D rivalry, with a 45% rise in 2024, signaling an impending leap in multi-gas handheld performance.
Pricing pressure persists in entry-level SKUs, but high-spec units retain premium margins thanks to stringent certification hurdles. Supply-chain resilience also shapes share: firms owning vertically integrated MEMS fabs can ride component shortages that trip competitors reliant on contract foundries. Overall, the gas sensor, detector, and analyzer market rewards vendors balancing hardware excellence with cloud-grade software, global service footprints, and credible cybersecurity credentials.
Gas Sensor, Detector And Analyzer Industry Leaders
-
Emerson Electric Company
-
Teledyne Technologies Incorporated
-
Siemens Aktiengesellschaft
-
Spectris plc (Servomex Group Limited)
-
Honeywell Analytics Inc.
- *Disclaimer: Major Players sorted in no particular order
Gas Sensor, Detector And Analyzer Market Companies Covered in this Report
- Emerson Electric Company
- Teledyne Technologies Incorporated
- Siemens Aktiengesellschaft
- Spectris plc (Servomex Group Limited)
- Honeywell Analytics Inc.
- Draegerwerk Aktiengesellschaft and Co. KGaA
- Industrial Scientific Corporation
- MSA Safety Incorporated
- Crowcon Detection Instruments Limited
- Yokogawa Electric Corporation
- Control Instruments Corporation
- Membrapor AG
- Senseair AB
- Eaton Corporation plc
- GfG Gesellschaft fuer Gerätebau mbH
- Figaro Engineering Inc.
- Robert Bosch GmbH
- Thermo Fisher Scientific Inc.
- Detector Electronics Corporation
- Alphasense Limited
- California Analytical Instruments, Inc.
- Testo SE and Co. KGaA
- Trolex Ltd.
- Bacharach Inc.
- MKS Instruments Inc.
- RKI Instruments Inc.
- HORIBA Ltd.
- SGX Sensortech Limited
- AFRISO-Euro-Index GmbH
- General Electric Company
- NGK Spark Plug Co., Ltd.
- BorgWarner Inc. (Delphi Technologies)
- Denso Corporation
Market Opportunities and Future Outlook
White space is emerging around higher-sensitivity, lower-cost trace-gas measurement and around product architectures that embed analytics close to the sensor while maintaining certification readiness. In June 2026, Fraunhofer IPM disclosed a compact resonant photoacoustic gas sensor concept positioned for highly sensitive trace detection at roughly one-tenth the cost of conventional equipment, which supports commercialization headroom for photoacoustic miniaturization beyond premium niches. Research direction also points to stronger multi-gas selectivity, including the February 2026 KRISS electronic-nose demonstration (reported with parts-per-trillion level detection and long-term stability), which aligns with end-user concerns about cross-sensitivity and false positives in complex environments.
On the system side, procurement is shifting from standalone detectors toward connected fleets that pair rugged hardware with software for documentation, compliance workflows, and lifecycle management, consistent with broader adoption of IoT-enabled monitoring in industrial sites. This creates an opportunity for suppliers that can deliver certified sensor nodes along with secure connectivity and audit-ready data handling, particularly where regulations and standards updates (ATEX/IECEx alignment and the IEC 60079-29-0:2026 refresh) drive replacement and standardization programs. There is also room to reduce total cost of ownership for smaller plants facing high installation and calibration costs through packaged calibration support, remote diagnostics, and subscription-style service, while preserving the traceability and uptime controls demanded in emissions monitoring and safety-critical applications.
Recent Industry Developments in Gas Sensor, Detector And Analyzer Market
- June 2026: Emerson expanded the Rosemount 928 Wireless Gas Monitor line to add combustible gas detection using WirelessHART for locations where wiring and access are constrained. The move extends wireless monitoring beyond toxic gas use cases and supports broader fleet deployments in hard-to-reach industrial assets.
- March 2025: Emerson introduced the Rosemount 625IR fixed gas detector using solid-state dual IR sources to deliver fast detection while reducing false alarms. The product update targets safety-critical operations seeking lower nuisance shutdowns and more reliable fixed-point coverage.
- April 2024: Valmet completed the acquisition of Siemens process gas chromatography and integration business for EUR 102.5 million. The transaction shifted chromatography assets into a focused process-analytics portfolio, influencing competitive positioning in analyzer offerings tied to emissions and process monitoring.
Gas Sensor, Detector And Analyzer Market Report Scope and Research Methodology
Market Definition and Coverage
This market covers revenues from gas sensors, gas detectors, and gas analyzers used to detect, measure, and monitor gas presence or concentration in industrial, commercial, and environmental settings. Revenue is captured at the point of equipment sale.
Scope exclusions: services, installation labor, calibration gases, and extended maintenance contracts are not counted unless they are bundled and priced inside the equipment sale value.
Segments Covered in This Report
-
By Product Category
- Gas Analyzers
- Gas Sensors
- Gas Detectors
-
By Technology
- Electrochemical
- Paramagnetic
- Zirconia
- Non Dispersive Infrared
- Semiconductor
- Photoionization
- Catalytic
- Photoacoustic
- Other Technology
-
By Communication Type
- Wired
- Wireless
-
By End-User Industry
- Oil and Gas
- Chemicals and Petrochemicals
- Water and Wastewater Treatment
- Metals and Mining
- Utilities and Power Generation
- Pharmaceuticals
- Food and Beverage
- Other End-User Industry
-
By Geography
-
North America
- United States
- Canada
-
Europe
- Germany
- United Kingdom
- France
- Italy
- Spain
- Rest of Europe
-
Asia Pacific
- China
- Japan
- India
- South Korea
- Australia
- Rest of Asia Pacific
-
South America
- Brazil
- Argentina
- Rest of South America
-
Middle East
- Saudi Arabia
- United Arab Emirates
- Turkey
- Rest of Middle East
-
Africa
- South Africa
- Nigeria
- Rest of Africa
-
North America
Data Sources, Market Sizing, and Validation
Desk Research
Desk work starts by mapping where gas sensing and detection equipment is actually deployed, then linking those use areas to measurable data series. For end-use intensity and equipment flow checks, public sources such as OSHA and NIOSH safety guidance, the US EPA air and emissions programs, the European Environment Agency datasets, the International Energy Agency, and UN Comtrade trade statistics are used to support assumptions on relevant equipment categories.
We also rely on manufacturer product documentation, public annual reports, investor presentations, and credible press releases to understand product positioning and typical replacement patterns. When needed, paid subscriptions for company financials and business intelligence, patent databases, and import-export shipment level checks are used to confirm technology shifts and directionality of shipments. These examples are not exhaustive, and other public sources were reviewed for data collection, validation, and clarification.
Primary Interviews and Surveys
Primary discussions were conducted with device manufacturers, channel partners, and end user buyers in higher-use industries such as oil and gas, chemicals, utilities, and manufacturing. This mix helps test key assumptions in plain terms, including how purchasing teams differentiate detectors versus analyzers, how fixed versus portable systems are budgeted, and how replacement and calibration practices differ by region, before the model is finalized.
Distribution of primary research fieldwork respondents
| Company type | Respondent position | Region |
|---|---|---|
| Top tier: 37% | CXOs: 19% | APAC: 42% |
| Mid tier: 44% | Functional/Unit leaders: 31% | EMEA: 35% |
| Smaller Players: 19% | Managers: 50% | Americas: 23% |
Market-Sizing & Forecasting
The sizing logic is built from a top-down demand pool, where industrial activity and regulatory driven monitoring needs are translated into likely equipment adoption, then filtered by typical replacement cycles. To cross-check totals, we add selective bottom-up approximations, including sampled average selling prices multiplied by estimated shipment volumes in key applications, plus channel feedback on mix shifts.
The model inputs include installed base renewal patterns for fixed and portable systems, average selling price bands by technology (electrochemical, infrared, and catalytic), safety compliance intensity by end use, the pace of industrial capacity additions in process industries, and the share of deployments tied to emissions monitoring and indoor air quality. Where bottom-up visibility is weaker, gaps are handled by using conservative price-volume bands and then revisiting those bands during interviews until the range narrows.
For forecasting, scenario analysis is run with a central case, and the drivers are carried forward using a blend of trend smoothing and expert validated inflection points. The final forecast is adjusted when adoption signals and pricing direction do not move together, which helps prevent short term jumps from being carried into the long range view.
Data Validation & Update Cycle
Results are validated through multiple passes that compare the model output against independent signals such as trade direction, industrial production momentum, and end use spending patterns gathered in interviews. If a region or technology shows an unusual jump, the underlying assumptions are rechecked, and specific respondents are recontacted to confirm whether the change is real or tied to a classification boundary.
Before sign-off, the dataset and formulas are reviewed by a second analyst, followed by a final variance check on growth rates, pricing movement, and regional shares. The report is refreshed annually, with interim updates when major regulation changes, plant shutdowns, or sharp input cost moves materially affect demand. A final review pass is completed just before delivery so the updated view is reflected in the client output.
Mordor Intelligence's Global Gas Analyzer Sensor and Detector Market Sizing Compared With Other Published Estimates
Published figures for this market can differ even when the topic name looks the same, since teams may apply different equipment boundaries, treat portable and fixed systems differently, and use different base years for currency conversion. Variations can also come from how replacement demand is modeled versus new project demand, and whether pricing is held flat or allowed to shift with technology mix.
The benchmark table shows a spread for the same general market, and in Mordor Intelligence's model the scope focuses on equipment revenue for gas sensors, detectors, and analyzers while excluding services and unbundled calibration activities. Other estimates can trend higher or lower when they expand the boundary into broader gas detection systems, use a more aggressive ASP progression for newer sensing technologies, or apply a different refresh cadence that captures industrial cycle swings sooner or later.
Benchmark comparison
| Source | Market Size | Gaps in Research Methodology |
|---|---|---|
| Mordor Intelligence | USD 4.93 B (2025) | |
| Global Consultancy A | USD 4.37 B (2024) | Uses a different base year and may weight application mix and pricing by sensor technology more heavily, which can shift the value when older low price detectors dominate the shipment mix. |
| Industry Publisher B | USD 4.84 B (2025) | Often blends fixed and portable systems with a wider set of technologies and end uses, and may treat bundled software and monitoring features as part of system value, which can lift the total versus equipment only counting. |
Overall, the comparison points to scope and pricing treatment as the main reasons behind the gap. When the market is tied to clear equipment definitions, replacement patterns, and region level demand indicators, the result is easier to trace, update, and explain on a client call without relying on hidden assumptions.
Key Questions Answered in the Report
What is the current value of the gas sensor market?
It is valued at USD 5.21 billion in 2026 and is projected to reach USD 6.84 billion by 2031.
Which product category commands the largest share?
Sensors hold 47.33% of 2025 revenue thanks to their integration flexibility in distributed monitoring.
Which region is growing the fastest?
Asia Pacific is advancing at a 5.86% CAGR driven by industrial expansion and tighter safety laws.
Why are semiconductor sensors gaining traction?
They offer solid-state reliability, lower power draw, and support for compact multigas designs.
What hinders broader adoption in small plants?
High upfront installation and calibration costs remain the primary barrier, especially in emerging markets.
How are regulations shaping demand?
Stricter emissions and safety mandates in the United States, European Union, and Asia are making continuous monitoring a non-discretionary capital expense.