
Garlic Market Size and Share
Garlic Market Analysis by Mordor Intelligence
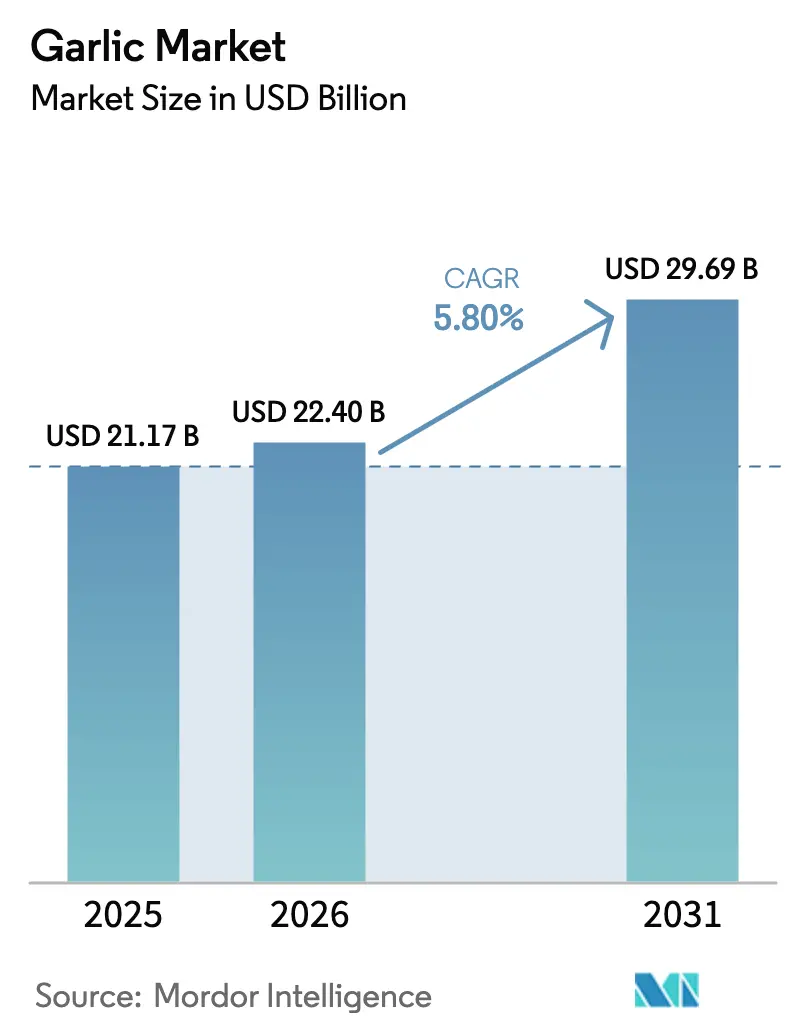
The garlic market size is projected to expand from USD 21.17 billion in 2025 and USD 22.40 billion in 2026 to USD 29.69 billion by 2031, registering a CAGR of 5.80% between 2026 to 2031. Growing consumer interest in cardiovascular and metabolic wellness, rising penetration of aged garlic extract in supplements, and the rapid uptake of dehydrated and fermented formats across foodservice channels are shaping near-term revenue momentum. Large buyers are hedging against fresh-crop price swings by locking in multi-year contracts for granulated and black garlic, while the commercialization of tissue-culture seeds lifts yields in emerging production belts. Regulatory vigilance on sulfur dioxide residues increases compliance costs but also encourages exporters to adopt controlled-atmosphere storage and natural sprout inhibitors. Investment in blockchain traceability is beginning to earn retail premiums, particularly in high-income markets where provenance, pesticide history, and cold-chain integrity drive consumer trust.
Key Report Takeaways
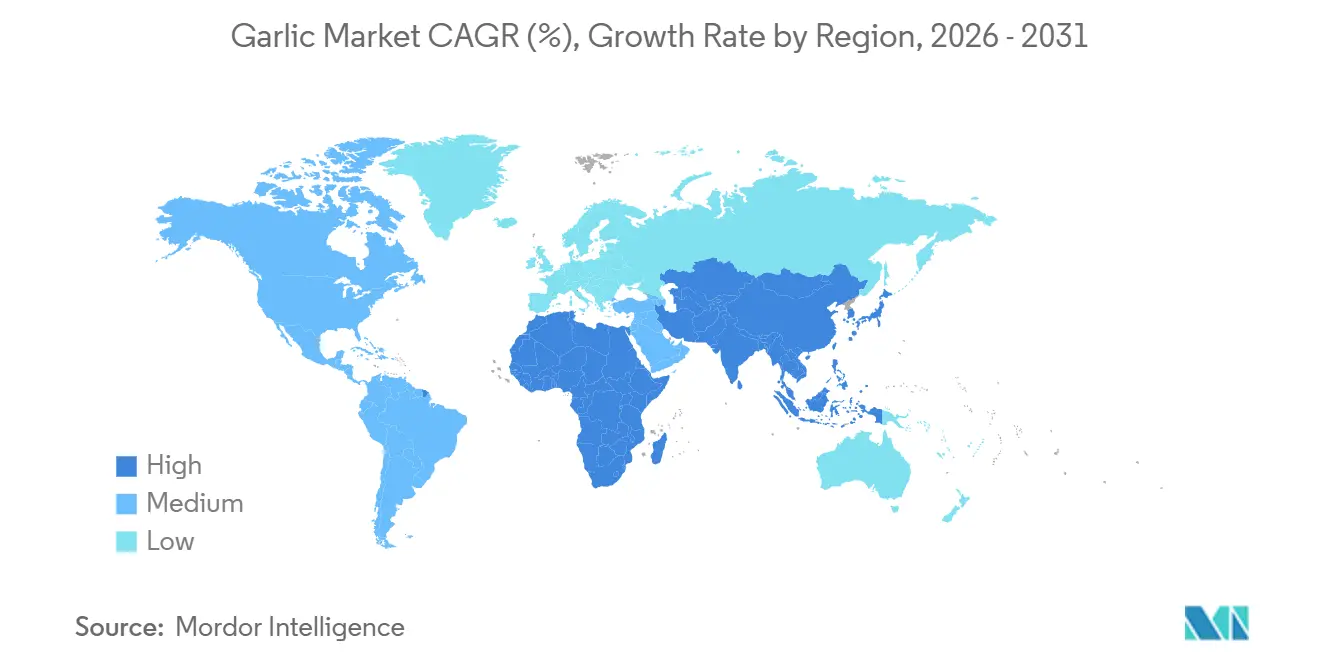
- By geography, the Asia-Pacific region led with 55.2% of the garlic market share in 2025. Africa is forecast to post the fastest regional expansion, at a 6.8% CAGR, through 2031.
Note: Market size and forecast figures in this report are generated using Mordor Intelligence’s proprietary estimation framework, updated with the latest available data and insights as of January 2026.
Market Trends and Insights
Drivers Impact Analysis of Garlic Market*
| Driver | (~) % Impact on CAGR Forecast | Geographic Relevance | Impact Timeline |
|---|---|---|---|
| Health-driven culinary demand surge | +1.2% | Global, peak adoption in North America and Europe | Medium term (2-4 years) |
| Expanding pharmaceutical and nutraceutical usage | +1.5% | North America, Europe, and Asia-Pacific | Long term (≥ 4 years) |
| Rising popularity of processed formats in foodservice | +0.9% | North America, Europe, and Middle East | Short term (≤ 2 years) |
| Fermentation technology unlocking premium black garlic exports | +0.7% | China, South Korea, and North America | Medium term (2-4 years) |
| Blockchain traceability premiums in specialty retail | +0.4% | North America and Europe | Long term (≥ 4 years) |
| Tissue-culture seed commercialization in emerging growers | +0.8% | India, Indonesia, Egypt, and South America | Medium term (2-4 years) |
| Source: Mordor Intelligence | |||
Health-Driven Culinary Demand Surge
Clinical evidence linking garlic’s organosulfur compounds to reduced low-density lipoprotein cholesterol and systolic blood pressure has elevated the bulb from a flavor enhancer to a functional staple [1]Source: National Center for Complementary and Integrative Health, “Garlic,” nccih.nih.gov. Retailers report steady unit growth as aging consumers fold garlic into heart-healthy diets. Restaurateurs and meal-kit brands highlight garlic-forward dishes, nudging per-capita intake upward. Provenance labels that signal organic or heirloom varieties command price premiums and attract consumers seeking transparency. The momentum amplifies baseline volume across both fresh and processed channels, giving producers an incentive to document cultivation practices and secure third-party certifications.
Expanding Pharmaceutical and Nutraceutical Usage
Aged garlic extract rich in S-allylcysteine migrated from niche supplement to core ingredient in mainstream cardiovascular and immune formulations, validated by 2025 peer-reviewed trials that show superior bioavailability after thermal aging [2]Source: Applied Sciences, “Influence of Thermal Processing on Black Garlic,” mdpi.com. Large buyers, such as NOW Health Group, specify International Organization for Standardization (ISO) and Good Manufacturing Practice (GMP) credentials, driving vertical integration from tissue-culture seed to solvent-free extraction. Buyers reward suppliers who can furnish batch-level chromatograms that verify the sulfur profile and absence of residue, thereby widening margins for compliant processors. Rising regulatory scrutiny on health claims in the United States and European Union further differentiates suppliers with clinical dossiers.
Rising Popularity of Processed Formats in Foodservice
Commercial kitchens shift to dehydrated, minced, and granulated garlic as hourly wages for seasonal pickers rise in California. Dehydrated supply removes prep labor, improves shelf stability, and smooths flavor across multi-unit chains. OFI reported granulated-garlic shortages in 2024, prompting long-term supply contracts that lock growers into processor pipelines [3]Source: OFI Investor Relations, “Q2 2025 Earnings Report,” ofi.com. The movement compresses fresh-bulb volume but lifts unit values for processors who secure dehydration capacity adjacent to production zones. Export flows benefit as dehydrated garlic faces fewer quarantine inspections than fresh bulbs.
Fermentation Technology Unlocking Premium Black Garlic Exports
Turnkey fermenters automate multi-stage temperature and humidity cycles, cutting processing time from 30 days to 22 days while preserving S-allylcysteine levels. Chinese equipment suppliers offer modular units that handle batches ranging from 30 kilograms to 2,000 kilograms, lowering entry barriers for mid-tier processors in South Korea and Australia. Black garlic retails at three to five times the price of fresh garlic bulbs and enjoys a shelf life of over 18 months, which underpins export programs into high-income markets. Premium positioning aligns with consumer interest in fermented superfoods, providing processors with a buffer against fluctuations in commodity prices.
Restraints Impact Analysis of Garlic Market*
| Restraint | (~) % Impact on CAGR Forecast | Geographic Relevance | Impact Timeline |
|---|---|---|---|
| Weather-driven price and yield volatility | -0.6% | China, India, and California | Short term (≤ 2 years) |
| Rising labor shortages and mechanization gaps | -0.5% | North America, Europe, and China | Medium term (2-4 years) |
| Sulfur-dioxide residue phytosanitary rejections | -0.3% | China export lanes to North America and Europe | Medium term (2-4 years) |
| Growing acceptance of low-odor allium substitutes | -0.2% | North America and Europe convenience segments | Long term (≥ 4 years) |
| Source: Mordor Intelligence | |||
Weather-Driven Price and Yield Volatility
Chinese weather shocks reduced 2024 output and increased global prices, allowing Indian exporters to capture market share. California acreage suffered from white rot across 22,000 acres, resulting in a reduction in 2023 production. Such swings force processors to hold higher safety stocks or chase spot cargoes at elevated rates. Climate variability narrows optimal harvest windows, raising the risk of undersized bulbs or post-harvest losses. Growers answer with precision irrigation and crop monitoring, yet capital outlay constrains smallholders.
Rising Labor Shortages and Mechanization Gaps
Garlic remains hand-planted and hand-harvested because bruising undermines fresh-market grades. Seasonal worker shortages intensify as wages rise, and mechanized harvesters remain cost-prohibitive for small-scale farms. Production shifts toward dehydration-friendly cultivars that tolerate mechanical handling, but this reduces the availability of jumbo fresh bulbs, which are prized in export lanes. Prolonged shortages could cap output growth in high-wage regions.
*Our forecasts treat driver/restraint impacts as directional, not additive. The impact forecasts reflect baseline growth, mix effects, and variable interactions.
Geography Analysis
APAC Garlic Market
The Asia-Pacific region led with 55.2% share of the garlic market in 2025, supported by China’s output and integrated dehydration lines that supply the global garlic market. India stepped in as a swing exporter during Chinese weather disruptions, underscoring the interdependence of the regional garlic market. Indonesia remains import-dependent, with 564.1 thousand metric tons of inflows in 2023. Tissue-culture adoption could increase domestic output and reduce reliance on Chinese supply. Vietnam and Thailand operate as re-export hubs, arbitraging tariff gaps inside Southeast Asia.
Africa Garlic Market
Africa registers the fastest expansion at 6.8% CAGR. Egypt shipped 21,965 metric tons between January and August 2024, leveraging proximity to European ports and looser congestion at the Suez corridor. South Africa’s urbanizing middle class boosts per capita intake, and cold-chain investments improve year-round availability. Funding for irrigation and tissue-culture labs will determine whether the region translates hectare expansion into sustained export competitiveness.
North America, Europe and APAC Garlic Market
North America remains consumption-heavy yet production-light. United States acreage declined as white rot and wage inflation pressured Californian growers, prompting importers to source more from Mexico and Spain. The Department of Commerce reaffirmed anti-dumping duties for Chinese transshipments through third countries, prompting tighter origin documentation and increasing landed costs. Canada’s 24.2 thousand metric tons import volume shows persistent demand, while Mexico balances domestic consumption with shipments northward during price spikes.


Regulatory Landscape
Global garlic trade is shaped by phytosanitary entry requirements, pesticide and contaminant limits, and tariff-rate quota (TRQ) administration that affects landed costs and shipping calendars. Quality and labeling alignment commonly references Codex CXS 337-2020 for garlic, while the European Union applies strict maximum residue limit enforcement under Regulation (EC) 396/2005, alongside plant health controls under Regulation (EU) 2019/2072. This combination raises the bar for residue management and lot-level documentation for both fresh and processed exports.
On market access, import licensing and TRQ mechanisms remain a defining constraint for major origin flows. The United Kingdom continues to apply licensing requirements for imports of garlic from China under Statutory Instrument 2020/1432, and in January 2026 Defra issued Notice to Traders 03/26 outlining the application window and quota requirements for the 1 March 2026 to 31 May 2026 tranche. This reinforces the need for precise shipment scheduling. In the United States, USDA APHIS import requirements for fresh garlic (under 7 CFR 319.56-3) keep entry tied to permits and inspection at the port of arrival, while anti-dumping enforcement actions in key consuming markets increase the importance of origin verification and compliant traceability systems.
Value Chain Analysis
The garlic value chain starts with seed material (including tissue-culture propagation and conventional cloves), farm inputs and labor, and then moves through harvesting, curing, grading, and storage before either fresh packing or processing into dehydrated, minced, granulated, fermented (black garlic), and extract formats. China anchors the upstream and midstream structure through scale cultivation and integrated drying capacity, and it also dominates trade flows (about 71% of global export value and 79% of export volume as of 2024). This concentration means global pricing and availability remain sensitive to Chinese planting and storage decisions, with inventory and storage release timing feeding into spot markets across importing regions.
Downstream value capture concentrates in processing, quality assurance, and logistics. Dehydration and fermentation reduce perishability and simplify cross-border handling relative to fresh bulbs, while batch documentation supports foodservice, retail provenance programs, and nutraceutical specifications. Cold-chain and storage infrastructure also stay central bottlenecks, since curing and temperature control shape shelf life, sprout control performance, and defect rates, especially for exporters serving distant markets. Regional diversification shows up where nearer-to-market suppliers leverage logistics advantages, for example Egypt's increased role into Europe (EU imports of Egyptian garlic reached 19,555 tonnes in 2025). Proximity to European ports and the ability to synchronize shipments with import windows and buyer specifications support this shift.
Competitive Landscape
Fresh garlic remains fragmented among thousands of smallholders across China and India, yet value-added sub-segments are concentrated. Christopher Ranch cultivates more than 45,350 metric tons annually and commands a strong brand presence in United States supermarkets. Shandong Liancheng and Jining Fenduni dominate dehydrated export lanes, leveraging low-cost Chinese feedstock and scale dehydration capacity to hold cost leadership positions. Zhengzhou Wenming Machinery sells fermentation equipment that underpins smaller entrants in Australia and South Korea, shifting margin capture toward technology providers.
Strategy polarization defines competition. Commodity-oriented exporters compete on price and shipment reliability. Differentiated players chase premiums via organic certification, blockchain traceability, and clinical validation of bioactive content. Patent filings covering two-stage humidity curves for black garlic fermentation increased between 2022 and 2025, indicating rapid innovation and potential for licensing revenue. Investments in tissue-culture propagation laboratories extend beyond seed sales into royalty streams on proprietary genetics.
Regional challengers gain traction. Egyptian exporters can leverage shorter freight times to the European Union, thereby undercutting Chinese transit times. Indian labs supplying virus-free seed capture value by contracting acreage in Indonesia and East Africa, effectively exporting technology. Mid-tier processors in North America import bulbs from Argentina and convert them into granulated powder near foodservice hubs, offsetting high labor costs through automation. The collective share of the top five processors in value-added formats signals a moderately concentrated premium tier.
Market Opportunities and Future Outlook
Product and channel mix shifts are creating whitespace beyond commodity bulbs, especially where buyers pay for verified quality attributes and reduced operational friction. Foodservice and industrial users continue shifting toward dehydrated, minced, and granulated formats to reduce kitchen labor and stabilize flavor, while nutraceutical and functional-ingredient buyers are tightening requirements around bioactive profiles, GMP/ISO credentials, and residue-free assurances. That is supporting premiumization for extract and aged or fermented inputs. The spread of turnkey fermentation systems and automated processing lines lowers entry barriers for mid-tier processors that can source bulbs competitively and differentiate through standardized S-allylcysteine profiles, longer shelf life, and consistent sensory performance.
Supply-chain modernization and technology adoption also create an opportunity layer, particularly where labor shortages and post-harvest losses constrain competitiveness. Mechanization and precision systems are moving from pilot to deployment, including Shandong Maria Agricultural Machinery's April 2025 launch of the 4DS-128A garlic combine harvester aimed at full-process automation in key Chinese regions. At the same time, trade-policy friction is catalyzing new origin strategies and compliance investments: the Garlic Contact Group (France, Italy, Spain) agreed in March 2026 to request EU safeguard action against Egyptian and Chinese imports, and Brazil's National Garlic Producers Association (Anapa) announced in June 2026 plans to seek changes to trade remedies affecting Chinese and Argentine garlic. These steps elevate the value of origin documentation and residue compliance, and they also reinforce diversified sourcing or near-market processing as a way to keep buyers supplied when quotas, licensing, or safeguards tighten access for specific origins.
Recent Industry Developments in Garlic Market
- June 2026: Wakunaga Pharmaceuticals initiated production using Platykampos garlic from Larissa, Greece, after six years of scientific testing for use in food supplements. The move ties a regional fresh-garlic origin into a higher-margin nutraceutical supply chain and reinforces demand for standardized, traceable raw material that can support supplement-grade specifications.
- February 2026: Arbor Investments acquired Furlani Foods, a producer of specialty garlic breads, from Entrepreneurial Equity Partners. The transaction consolidates capacity in a garlic-forward processed food category, strengthening scale advantages in procurement, innovation, and distribution for value-added garlic applications.
- January 2025: Bayer and Ecospray signed an exclusive distribution agreement for Velsinum, a garlic-extracted liquid biological crop protection product positioned as a nematicide across Europe, the Middle East, and Africa. This expands commercial pathways for garlic-derived actives beyond food uses and supports residue-conscious production systems that align with strict MRL enforcement in major import markets.


Garlic Market Report Scope and Research Methodology
Market Definition and Coverage
For this study, the global garlic market is defined as the value and volume of garlic sold for consumption and ingredient use, counted across fresh and processed forms at the producer to first buyer level, and then tracked across major producing and consuming regions.
Scope exclusions: This sizing does not count ornamental garlic grown only for landscaping, and it does not add retail margins or downstream food product value where garlic is only a minor input.
Segments Covered in This Report
- By Geography
- North America
- United States
- Production Analysis (Area Harvested, Yield, and Production Volume)
- Consumption Analysis (Consumption Value and Volume)
- Import Market Analysis (Import Value, Volume, and Key Supplying Markets)
- Export Market Analysis (Export Value, Volume, and Key Destination Markets)
- Wholesale Price Trend Analysis and Forecast
- Regulatory Framework
- List of Key Players
- Logistics and Infrastructure
- Seasonality Analysis
- Canada
- Production Analysis (Area Harvested, Yield, and Production Volume)
- Consumption Analysis (Consumption Value and Volume)
- Import Market Analysis (Import Value, Volume, and Key Supplying Markets)
- Export Market Analysis (Export Value, Volume, and Key Destination Markets)
- Wholesale Price Trend Analysis and Forecast
- Regulatory Framework
- List of Key Players
- Logistics and Infrastructure
- Seasonality Analysis
- Mexico
- Production Analysis (Area Harvested, Yield, and Production Volume)
- Consumption Analysis (Consumption Value and Volume)
- Import Market Analysis (Import Value, Volume, and Key Supplying Markets)
- Export Market Analysis (Export Value, Volume, and Key Destination Markets)
- Wholesale Price Trend Analysis and Forecast
- Regulatory Framework
- List of Key Players
- Logistics and Infrastructure
- Seasonality Analysis
- United States
- Europe
- Spain
- Production Analysis (Area Harvested, Yield, and Production Volume)
- Consumption Analysis (Consumption Value and Volume)
- Import Market Analysis (Import Value, Volume, and Key Supplying Markets)
- Export Market Analysis (Export Value, Volume, and Key Destination Markets)
- Wholesale Price Trend Analysis and Forecast
- Regulatory Framework
- List of Key Players
- Logistics and Infrastructure
- Seasonality Analysis
- Ukraine
- Production Analysis (Area Harvested, Yield, and Production Volume)
- Consumption Analysis (Consumption Value and Volume)
- Import Market Analysis (Import Value, Volume, and Key Supplying Markets)
- Export Market Analysis (Export Value, Volume, and Key Destination Markets)
- Wholesale Price Trend Analysis and Forecast
- Regulatory Framework
- List of Key Players
- Logistics and Infrastructure
- Seasonality Analysis
- France
- Production Analysis (Area Harvested, Yield, and Production Volume)
- Consumption Analysis (Consumption Value and Volume)
- Import Market Analysis (Import Value, Volume, and Key Supplying Markets)
- Export Market Analysis (Export Value, Volume, and Key Destination Markets)
- Wholesale Price Trend Analysis and Forecast
- Regulatory Framework
- List of Key Players
- Logistics and Infrastructure
- Seasonality Analysis
- United Kingdom
- Production Analysis (Area Harvested, Yield, and Production Volume)
- Consumption Analysis (Consumption Value and Volume)
- Import Market Analysis (Import Value, Volume, and Key Supplying Markets)
- Export Market Analysis (Export Value, Volume, and Key Destination Markets)
- Wholesale Price Trend Analysis and Forecast
- Regulatory Framework
- List of Key Players
- Logistics and Infrastructure
- Seasonality Analysis
- Russia
- Production Analysis (Area Harvested, Yield, and Production Volume)
- Consumption Analysis (Consumption Value and Volume)
- Import Market Analysis (Import Value, Volume, and Key Supplying Markets)
- Export Market Analysis (Export Value, Volume, and Key Destination Markets)
- Wholesale Price Trend Analysis and Forecast
- Regulatory Framework
- List of Key Players
- Logistics and Infrastructure
- Seasonality Analysis
- Spain
- Asia-Pacific
- China
- Production Analysis (Area Harvested, Yield, and Production Volume)
- Consumption Analysis (Consumption Value and Volume)
- Import Market Analysis (Import Value, Volume, and Key Supplying Markets)
- Export Market Analysis (Export Value, Volume, and Key Destination Markets)
- Wholesale Price Trend Analysis and Forecast
- Regulatory Framework
- List of Key Players
- Logistics and Infrastructure
- Seasonality Analysis
- India
- Production Analysis (Area Harvested, Yield, and Production Volume)
- Consumption Analysis (Consumption Value and Volume)
- Import Market Analysis (Import Value, Volume, and Key Supplying Markets)
- Export Market Analysis (Export Value, Volume, and Key Destination Markets)
- Wholesale Price Trend Analysis and Forecast
- Regulatory Framework
- List of Key Players
- Logistics and Infrastructure
- Seasonality Analysis
- Indonesia
- Production Analysis (Area Harvested, Yield, and Production Volume)
- Consumption Analysis (Consumption Value and Volume)
- Import Market Analysis (Import Value, Volume, and Key Supplying Markets)
- Export Market Analysis (Export Value, Volume, and Key Destination Markets)
- Wholesale Price Trend Analysis and Forecast
- Regulatory Framework
- List of Key Players
- Logistics and Infrastructure
- Seasonality Analysis
- Vietnam
- Production Analysis (Area Harvested, Yield, and Production Volume)
- Consumption Analysis (Consumption Value and Volume)
- Import Market Analysis (Import Value, Volume, and Key Supplying Markets)
- Export Market Analysis (Export Value, Volume, and Key Destination Markets)
- Wholesale Price Trend Analysis and Forecast
- Regulatory Framework
- List of Key Players
- Logistics and Infrastructure
- Seasonality Analysis
- Myanmar
- Production Analysis (Area Harvested, Yield, and Production Volume)
- Consumption Analysis (Consumption Value and Volume)
- Import Market Analysis (Import Value, Volume, and Key Supplying Markets)
- Export Market Analysis (Export Value, Volume, and Key Destination Markets)
- Wholesale Price Trend Analysis and Forecast
- Regulatory Framework
- List of Key Players
- Logistics and Infrastructure
- Seasonality Analysis
- South Korea
- Production Analysis (Area Harvested, Yield, and Production Volume)
- Consumption Analysis (Consumption Value and Volume)
- Import Market Analysis (Import Value, Volume, and Key Supplying Markets)
- Export Market Analysis (Export Value, Volume, and Key Destination Markets)
- Wholesale Price Trend Analysis and Forecast
- Regulatory Framework
- List of Key Players
- Logistics and Infrastructure
- Seasonality Analysis
- China
- South America
- Brazil
- Production Analysis (Area Harvested, Yield, and Production Volume)
- Consumption Analysis (Consumption Value and Volume)
- Import Market Analysis (Import Value, Volume, and Key Supplying Markets)
- Export Market Analysis (Export Value, Volume, and Key Destination Markets)
- Wholesale Price Trend Analysis and Forecast
- Regulatory Framework
- List of Key Players
- Logistics and Infrastructure
- Seasonality Analysis
- Argentina
- Production Analysis (Area Harvested, Yield, and Production Volume)
- Consumption Analysis (Consumption Value and Volume)
- Import Market Analysis (Import Value, Volume, and Key Supplying Markets)
- Export Market Analysis (Export Value, Volume, and Key Destination Markets)
- Wholesale Price Trend Analysis and Forecast
- Regulatory Framework
- List of Key Players
- Logistics and Infrastructure
- Seasonality Analysis
- Brazil
- Middle East
- Iran
- Production Analysis (Area Harvested, Yield, and Production Volume)
- Consumption Analysis (Consumption Value and Volume)
- Import Market Analysis (Import Value, Volume, and Key Supplying Markets)
- Export Market Analysis (Export Value, Volume, and Key Destination Markets)
- Wholesale Price Trend Analysis and Forecast
- Regulatory Framework
- List of Key Players
- Logistics and Infrastructure
- Seasonality Analysis
- Turkey
- Production Analysis (Area Harvested, Yield, and Production Volume)
- Consumption Analysis (Consumption Value and Volume)
- Import Market Analysis (Import Value, Volume, and Key Supplying Markets)
- Export Market Analysis (Export Value, Volume, and Key Destination Markets)
- Wholesale Price Trend Analysis and Forecast
- Regulatory Framework
- List of Key Players
- Logistics and Infrastructure
- Seasonality Analysis
- Iran
- Africa
- Egypt
- Production Analysis (Area Harvested, Yield, and Production Volume)
- Consumption Analysis (Consumption Value and Volume)
- Import Market Analysis (Import Value, Volume, and Key Supplying Markets)
- Export Market Analysis (Export Value, Volume, and Key Destination Markets)
- Wholesale Price Trend Analysis and Forecast
- Regulatory Framework
- List of Key Players
- Logistics and Infrastructure
- Seasonality Analysis
- South Africa
- Production Analysis (Area Harvested, Yield, and Production Volume)
- Consumption Analysis (Consumption Value and Volume)
- Import Market Analysis (Import Value, Volume, and Key Supplying Markets)
- Export Market Analysis (Export Value, Volume, and Key Destination Markets)
- Wholesale Price Trend Analysis and Forecast
- Regulatory Framework
- List of Key Players
- Logistics and Infrastructure
- Seasonality Analysis
- Egypt
- North America
Data Sources, Market Sizing, and Validation
Desk Research
Desk research was used to set the supply and trade boundary first, then to anchor the model to observable tonnage and price signals. We relied on public and official references such as FAOSTAT, UN Comtrade, national agriculture ministries, customs and port statistics, and trade association releases related to spices and fresh produce. Academic and extension publications were also used to sanity check agronomy-linked items like yield ranges, seasonality, and post-harvest loss ranges.
Alongside these, we reviewed company filings, investor presentations, and credible press to understand how garlic moves through fresh, dehydrated, and ingredient channels, and where processing value is typically added. A few paid subscriptions were used only for company financials and intelligence, patent lookups, and shipment-level trade checks when public series had gaps or lags. This desk list is illustrative, and other sources were referenced during collection, clarification, and cross-checking.
Primary Interviews and Surveys
Primary interviews and surveys were used to stress-test assumptions that are difficult to observe in public data, such as typical conversion ratios from fresh to dehydrated forms, export grade mix, and realistic price spreads across origins and seasons. We spoke with growers, processors, traders, distributors, and large buyers, and we kept input balance across APAC, EMEA, and the Americas so the model did not overfit to one trade corridor.
Distribution of primary research fieldwork respondents
| Company type | Respondent position | Region |
|---|---|---|
| Top tier: 32% | CXOs: 14% | APAC: 49% |
| Mid tier: 53% | Functional/Unit leaders: 40% | EMEA: 32% |
| Smaller Players: 15% | Managers: 46% | Americas: 19% |
Market-Sizing & Forecasting
Market totals were built using a top-down approach where production and trade data are reconstructed into an apparent consumption pool, which is then valued using representative producer and first-buyer price bands. To keep totals realistic, we also ran selective bottom-up checks using sampled exporter and processor volumes, channel checks for conversion yields, and simple price times volume math by form, and then adjusted the final number only when the gap was explainable.
Key inputs in the model included global and country-level garlic production (tons), harvested area and yield movement, export and import volumes by major routes, the split between fresh and processed garlic, and seasonal pricing patterns tied to harvest windows and storage. Processing conversion ratios (for items like dehydrated or paste) were handled as ranges and then narrowed through interviews, since public sources rarely present them consistently. When a country had weak reporting, we used peer-country ratios for yield and trade intensity, then rechecked against import partner data.
For forecasting, scenario analysis was applied on top of a time series baseline using drivers that stakeholders consistently referenced, such as acreage response to farmgate prices, freight and container availability effects on trade, and demand pull from food manufacturing and foodservice. Assumptions were kept simple enough to be repeated, and were accepted only after they matched the direction and scale seen in the latest production and trade signals.
Data Validation & Update Cycle
Validation starts with consistency checks across independent series, so volumes, prices, and implied values do not drift away from what production and trade data can support. We run variance checks by region and by form, and anything that looks abnormal is traced back to a specific input, such as an outlier price, a double-counted trade flow, or an unrealistic conversion yield.
Before sign-off, the model goes through multi-step analyst review where assumptions are rechecked against interview notes and recent public releases, then the calculations are re-run to confirm reproducibility. If a major mismatch appears, the team re-contacts sources to confirm whether it reflects a real market change or a data timing issue. Reports are refreshed annually, and interim updates are made when material events occur, followed by a final pre-delivery pass so clients receive the most current view.
Mordor Intelligence's Global Garlic Market Size Versus Other Published Estimates
Published garlic market values can differ even when everyone is talking about the same crop, because the counted price level and the included forms are not always aligned. Some publishers count producer and importer revenues, others aim closer to first-buyer value, and a few blend in broader food ingredient value in a way that is hard to replicate.
FAOSTAT production totals and UN Comtrade trade flows are the evidence checks that keep Mordor Intelligence aligned to a producer-to-first-buyer boundary in constant 2025 dollars, rather than drifting toward nominal importer revenue or retail value add. Differences also come from how fresh versus processed garlic is valued, whether conversion yields are explicitly modeled, and whether the latest crop year and currency timing are refreshed before publishing.
Benchmark comparison
| Source | Market Size | Gaps in Research Methodology |
|---|---|---|
| Mordor Intelligence | USD 22.40 B (2026) | |
| Trade Analytics Publisher A | USD 34.40 B (2024) | Uses producer and importer revenues in nominal terms and can blend shifts in import pricing and trade margins, which tends to lift value versus a constant-dollar, first-buyer boundary. |
| Global Publisher B | USD 22.45 B (2024) | Reported as factory gate values and includes a broad processed product list, but the year basis and price normalization choices can shift the value when compared to a constant-dollar model anchored to production and trade balances. |
Taken together, the spread is mostly explained by price-level choice and timing, not by disagreement on garlic tonnage. By tying value to observable supply and trade signals, then validating sensitive items like conversion yields and price bands through interviews, the estimate stays traceable to clear inputs that can be rechecked when new crop and trade data is released.


Key Questions Answered in the Report
What is the projected global revenue for the garlic market in 2031?
The garlic market will reach USD 29.69 billion by 2031, rising at a 5.80% CAGR.
Which region led global sales in 2025?
In 2025, Asia-Pacific held 55.2% of revenue due to China's dominant production base.
Why are processed garlic formats gaining share?
Dehydrated and minced products cut kitchen labor, lower spoilage, and face lighter border inspections than fresh bulbs.
How are nutraceutical trends influencing demand?
Mainstream cardiovascular and immune supplements now specify aged garlic extract rich in S-allylcysteine, driving an 8.7% CAGR in the pharmaceutical channel through 2031.
What technology reduces black garlic fermentation time?
Automated fermenters with programmable humidity and temperature profiles shorten cycles from 30 days to 22 days while retaining bioactive strength.
Which factor most threatens short term supply stability?
Weather variability in China, India, and California causes abrupt yield swings that ripple through global prices.
Page last updated on:


 Your data is secure and never sold or shared.


