Fungicide Market Size and Share
Market Overview
| Study Period | 2017 - 2030 |
|---|---|
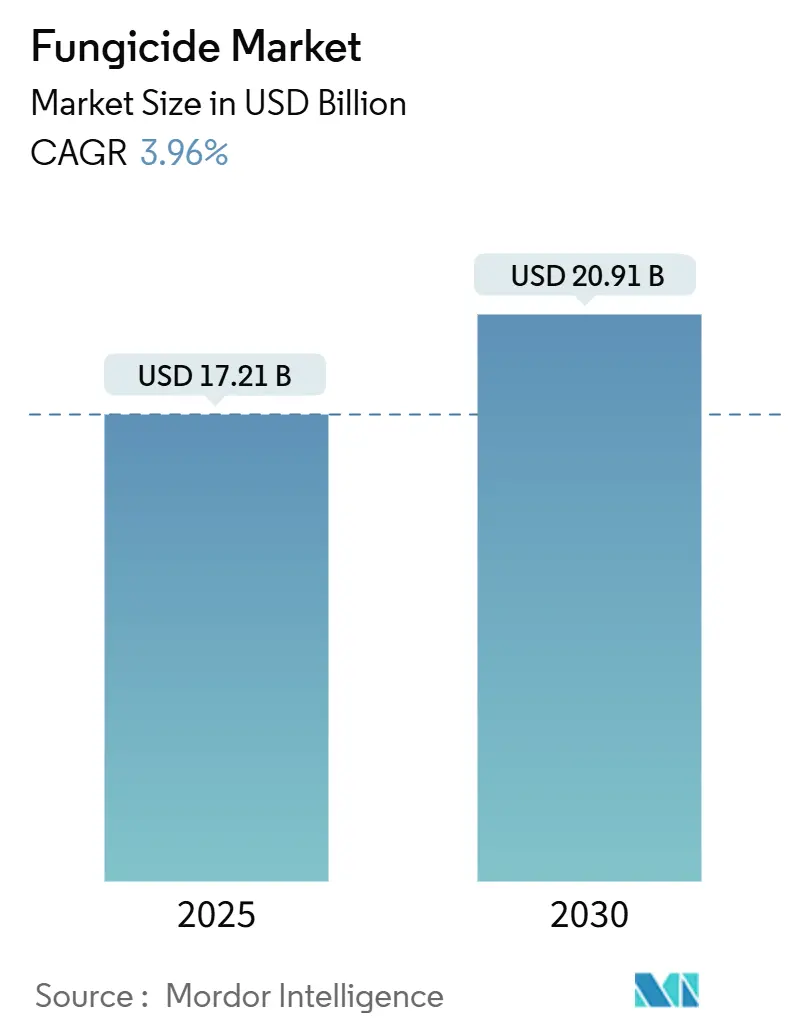
| Market Size (2025) | USD 17.21 Billion |
| Market Size (2030) | USD 20.91 Billion |
| Growth Rate (2025 - 2030) | 3.96% CAGR |
| Fastest Growing Market | South America |
| Largest Market | South America |
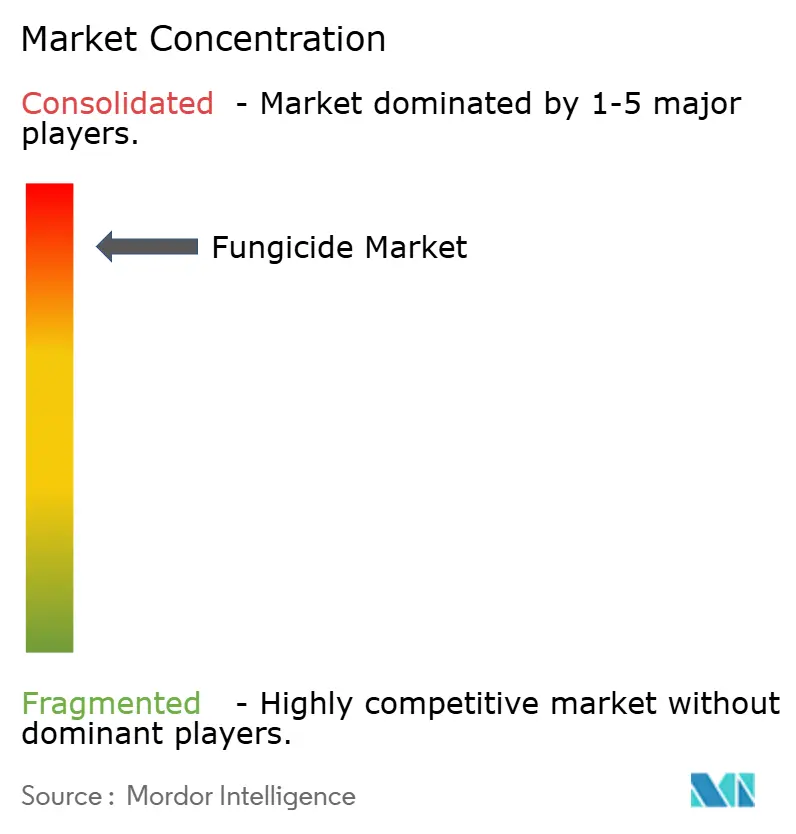
| Market Concentration | High |
Major Players
*Disclaimer: Major Players sorted in no particular order Image © Mordor Intelligence. Reuse requires attribution under CC BY 4.0. |
|
Fungicide Market Analysis by Mordor Intelligence
The fungicide market size was at USD 17.21 billion in 2025 and is projected to reach USD 20.91 billion by 2030, registering a CAGR of 3.96%. Climate-induced increases in fungal disease pressure drive growth, the adoption of multi-site chemistries such as SDHIs, and the integration of precision application tools that lower input costs while safeguarding yields. South America leads global demand, with Brazil's intensive grain production model necessitating season-long disease control programs. Globally, growers are transitioning from calendar-based to risk-based spraying, supported by AI-driven disease forecasting platforms that optimize application timing and minimize waste. In Europe, stringent residue regulations are fostering innovation in stewardship-oriented products that ensure crop safety while meeting regulatory standards. Despite moderate overall growth, the fungicide market continues to attract investment due to emerging revenue opportunities from product stewardship services and digital decision-making tools alongside traditional chemistry sales.
Key Report Takeaways
- By application mode, foliar treatments accounted for 59.8% of the fungicide market share in 2024, and are anticipated to experience the fastest expansion at a 4.0% CAGR through 2030.
- By crop type, grains and cereals held 46.1% of the fungicide market share in 2024, and fruits and vegetables are projected to record the highest 4.1% CAGR through 2030.
- By geography, South America accounted for 34.5% of the market in 2024 and is also forecasted to post the fastest CAGR of 4.2% over the outlook period.
Global Fungicide Market Trends and Insights
Drivers Impact Analysis
| Driver | (~) % Impact on CAGR Forecast | Geographic Relevance | Impact Timeline |
|---|---|---|---|
| Climate-driven surge in fungal disease pressure | +1.0% | Global, heightened in South America and Asia-Pacific | Medium term (2-4 years) |
| Adoption of SDHI and other multi-site chemistries | +0.7% | North America and Europe, spreading to emerging markets | Long term (≥ 4 years) |
| Regenerative and no-till farming boosting seed-treatment fungicides | +0.5% | North America and South America, early uptake in Europe | Medium term (2-4 years) |
| Yield-boost imperatives for low-margin row crops | +0.6% | Global, concentrated in grain belts | Short term (≤ 2 years) |
| AI-enabled disease forecasting tools accelerating fungicide uptake | +0.4% | North America and Europe, pilots in Asia-Pacific | Long term (≥ 4 years) |
| Carbon-credit programs rewarding crop-loss avoidance | +0.2% | North America and Europe, emerging in South America | Long term (≥ 4 years) |
| Source: Mordor Intelligence | |||
Climate-Driven Surge in Fungal Disease Pressure
Increasing weather volatility has led to a 23% rise in fungal infection incidents since 2020, intensifying risks such as wheat rust and late blight[1]Source: Intergovernmental Panel on Climate Change, “Climate Change 2024: Impacts, Adaptation and Vulnerability,” ipcc.ch. Transitional climate zones now experience multiple infection periods each season, requiring growers to apply two to three additional fungicide treatments to safeguard yields. Field trials in South America reported a 15-20% yield loss in untreated plots during high-pressure seasons, highlighting the need for intensive crop protection. This growing demand is driving research and development efforts toward broad-spectrum formulations that can simultaneously target multiple pathogen complexes. Concurrently, stewardship programs emphasize rotation practices to mitigate the development of resistance as new chemical solutions are introduced.
Adoption of SDHI and Other Multi-Site Chemistries
In 2024, regulators approved 12 new Succinate Dehydrogenase Inhibitor (SDHI) products, underscoring the industry's confidence in their multi-site activity against strains resistant to strobilurins and azoles [2]Source: U.S. Environmental Protection Agency, “Pesticide Registration Review: SDHI Fungicides 2024,” epa.gov. Currently, European growers incorporate SDHIs in 34% of their spray programs, while adoption rates in North America and the Asia-Pacific remain lower at 18% and 12%, respectively. Despite premium pricing—typically 25-40% higher than generic azoles—commercial producers continue to invest in SDHIs due to their consistent effectiveness in controlling diseases where older modes of action are less effective. As a result, the fungicide market experiences price-mix gains even when overall volumes remain stable. Suppliers promote SDHIs as key components of integrated resistance management strategies, which also include digital scouting and predictive modeling tools.
Yield-Boost Imperatives for Low-Margin Row Crops
Corn and soybean futures have been trading 15-20% below their 2021 peaks on the Chicago Board of Trade, putting pressure on grower margins. Even in conditions of low disease pressure, preventive fungicide programs offer yield advantages of 3-7 bushels per acre by enhancing plant health traits. As a result, row-crop growers in regions with historically moderate disease risk are increasingly adopting fungicides as a standard practice. The use of precision agriculture equipment has further supported this trend by enabling variable-rate spraying based on yield maps and disease risk indices, making the investment more justifiable in challenging economic conditions. This shift underscores the increasing importance of technology in enhancing agricultural practices. It highlights the need for growers to strike a balance between cost management and yield improvement strategies.
AI-Enabled Disease Forecasting Tools Accelerating Fungicide Uptake
Machine-learning models, such as IBM’s Watson Decision Platform, now predict infection risks for key pathogens with an accuracy of 87%. Early adopters in high-value crops have reported fewer but more precisely timed applications, maintaining high control levels while reducing unnecessary treatments. Drone-mounted multispectral cameras provide sub-acre disease maps to these platforms, enabling targeted treatments that optimize chemical usage. These advancements not only improve crop health but also contribute to sustainable farming practices by minimizing chemical overuse. By 2024, adoption reached 23% of European farms, which is twice the penetration rate observed in North America. As software costs decline and cellular connectivity improves, AI-driven forecasting is projected to drive fungicide market growth by enhancing application efficiency rather than increasing overall usage volumes. This trend underscores the increasing importance of technology in transforming traditional agricultural practices.
Restraints Impact Analysis
| Restraint | (~) % Impact on CAGR Forecast | Geographic Relevance | Impact Timeline |
|---|---|---|---|
| Stringent residue and registration regulations | -0.7% | Europe and North America, spreading worldwide | Medium term (2-4 years) |
| Pathogen resistance to azoles and benzimidazoles | -0.5% | Global, acute in intensive systems | Short term (≤ 2 years) |
| Accelerating shift to organic farming | -0.4% | Europe and North America, emerging in Asia-Pacific | Long term (≥ 4 years) |
| Soil-copper accumulation limits repeat use in high-value orchards | -0.2% | Mediterranean, California, and Australia | Medium term (2-4 years) |
| Source: Mordor Intelligence | |||
Stringent Residue and Registration Regulations
The European Food Safety Authority (EFSA) reduced tolerance levels for 47 fungicide actives in 2024, with some limits lowered by up to 75%[3]Source: European Food Safety Authority, “Pesticide Residues in Food: Annual Report 2024,” efsa.europa.eu. Developing a new active ingredient requires an investment of USD 350-400 million and approximately 11.2 years, creating significant barriers that limit the throughput of the pipeline. Differences in regulatory requirements across jurisdictions compel multinational companies to conduct parallel studies, which increases costs and delays product launches. Growers face longer pre-harvest intervals or are forced to adopt newer, more expensive products that comply with the stricter limits. Smaller manufacturers struggle to justify the costs of re-registering older chemistries, resulting in a gradual decline in label availability and limited fungicide options in the market.
Pathogen Resistance to Azoles and Benzimidazoles
The Fungicide Resistance Action Committee reported resistance rates exceeding 50% for several key chemistry-pathogen combinations in 2024[4]Source: Fungicide Resistance Action Committee, “Fungicide Resistance Monitoring Report 2024,” frac.info. This decline in efficacy forces growers to increase application rates or reduce intervals between applications, leading to a 35-60% rise in per-acre costs without achieving better control. Specialty crops are especially at risk, as they depend on a limited number of chemistry classes that are applied multiple times per season. The growing resistance issue underscores the need for innovation in fungicide development to ensure sustainable crop protection. It emphasizes the importance of integrated pest management practices in mitigating the risks of resistance. Concerns over resistance are driving a shift toward premium, multi-site, and biological solutions. This shift also introduces uncertainty, potentially slowing fungicide market growth until alternative solutions are widely available.
Segment Analysis
By Application Mode: Foliar Programs Dominate Precision Targeting
Foliar spraying accounted for 59.8% of the fungicide market share in 2024 and is projected to grow at a 4.0% CAGR through 2030. This growth reflects growers' preference for visible canopy coverage during critical stages such as flowering and grain fill. The segment benefits from advancements such as lighter booms, GPS guidance, and variable-rate nozzles, which enhance on-target deposition and minimize drift. These technological improvements continue to strengthen the appeal of foliar spraying, even as regulatory bodies impose stricter stewardship requirements. The ease of application and adaptability to various crop types further contribute to its widespread adoption.
Chemigation is gaining traction as irrigated acreage expands and water-delivery systems are increasingly utilized as carriers for fungicides. Smart pivot controls now align fungicide application with disease risk forecasts, promoting more efficient use of chemicals. The seed-treatment segment also remains significant, with EPA approvals for vegetable seed applications increasing by 34% in 2024, thereby expanding the customer base beyond traditional row crops. Soil and fumigation applications continue to focus on high-intensity horticulture and greenhouse operations, where higher pathogen loads necessitate more intensive interventions. Furthermore, advancements in application technologies are improving precision and reducing environmental impact in these high-intensity settings.

Note: Segment shares of all individual segments available upon report purchase
By Crop Type: Grains and Cereals Dominate While Fruits and Vegetables Secure Premiums
Grains and cereals are projected to account for 46.1% of the fungicide market size in 2024, driven by extensive acreages of wheat, corn, and rice that cannot afford yield reductions amidst tight commodity margins. Preventive spray programs targeting diseases such as rust, gray leaf spot, and blast have become standard agronomic practices, ensuring steady demand. In terms of revenue, the fungicide market for grains surpasses that of any other crop group. The consistent reliance on fungicides in this segment highlights their critical role in safeguarding staple food production and maintaining global food security.
Fruits and vegetables are projected to register the fastest CAGR of 4.1% through 2030, fueled by consumer demand for blemish-free produce and a willingness to invest in higher input programs. Export market requirements for low-residue produce drive horticultural growers to adopt low-dose, fast-degrading fungicides, which often command premium prices. Other segments, including pulses, oilseeds, turf, and ornamentals, also contribute to the market, each requiring specialized fungicide solutions to meet quality or aesthetic standards, irrespective of their direct commodity value. The increasing focus on sustainable farming practices further influences the adoption of fungicides across these diverse crop groups.

Note: Segment shares of all individual segments available upon report purchase
Geography Analysis
South America accounted for 34.5% of the fungicide market share in 2024, driven by Brazil’s double-cropped soybean and corn systems, which require multiple disease control applications. Soybean rust alone necessitates three to four sprays per season, ensuring consistent product turnover. Regulatory frameworks in Brazil and Argentina facilitate the rapid introduction of new chemistries, enabling growers to effectively address resistance challenges. Favorable credit lines and government support for precision agriculture have accelerated the adoption of chemigation and drone spraying technologies across expanding agricultural areas. The region is projected to achieve a 4.2% CAGR through 2030, positioning it as the fastest-growing contributor to the fungicide market's future expansion.
North America represents a technologically advanced yet growth-oriented market, where investments focus on digital scouting, resistant hybrid deployment, and input optimization. The United States remains the largest single-country market, with foliar fungicide applications viewed as preventive measures rather than emergency responses. Canada contributes to market volume through its wheat and canola sectors, relying on seed treatments to protect early-stage growth in cooler soils. Meanwhile, Mexico’s export-driven fruit and vegetable farms utilize specialty fungicides that comply with stringent residue standards for entry into the United States market, thereby boosting revenue in high-margin segments. Regional policies emphasizing risk-management labeling encourage growers to adopt integrated programs that combine chemical and analytical approaches, thereby maintaining fungicide market share even as active ingredient volumes stabilize.
Europe continues to generate significant revenue despite initiatives to reduce pesticide usage. The Farm to Fork strategy aims to halve chemical inputs by 2030, yet high-value crops such as grapes, tomatoes, and leafy greens still require fungicidal protection. Strict residue limits have driven the adoption of lower-dose chemistries and biological alternatives, resulting in increased expenditure per kilogram of active ingredient sold. Germany and France remain central to the market, while Italy and Spain contribute through viticulture and horticulture, which demand season-long disease management. Subsidies for integrated pest management ensure fungicides remain integral to balanced crop protection strategies. The Asia-Pacific and Africa regions are emerging as key areas for fungicide market growth, driven by increasing agricultural acreage and the pace of agricultural modernization. Farm consolidation and food-security initiatives are expanding the area of protected farmland, providing significant opportunities for market development in these regions.

Competitive Landscape
The fungicide market is highly concentrated, with the top five suppliers, Syngenta Group, Bayer AG, BASF SE, Corteva Agriscience, and UPL Limited, accounting for a significant share of the market in 2024. Syngenta Group's market dominance is driven by substantial research and development investments, with expenses nearing USD 400 million per molecule, coupled with decade-long approval cycles that act as barriers for smaller competitors. These leading companies leverage their scale to establish global manufacturing networks, ensuring supply chain resilience. Syngenta’s USD 2.1 billion investment in capacity expansion across Brazil, India, and China is projected to increase output by 25% by 2027. Strategic investments in digital agronomy are evident, as seen in Corteva’s AI platform, which operates in 15 countries and provides disease-timing recommendations, fostering customer reliance on proprietary chemical solutions.
Product development efforts are centered on SDHIs, mixed-mode formulations, and biological solutions. Bayer’s next-generation SDHI, approved by the U.S. EPA in 2024, offers extended residual control, reducing the number of applications required while addressing resistance management challenges. Although patent expirations create opportunities for generic manufacturers, stringent regulatory data requirements and growers' need for technical support limit their influence, particularly outside price-sensitive market segments. To counter the threat of generics, market leaders offer bundled services, including drone mapping and resistance management counseling, which enhance customer loyalty and reinforce brand preference.
Sustainability initiatives play a critical role in competitive positioning. Companies emphasize reduced-dose formulations and carbon footprint metrics to align with the expectations of retailers and consumers. FMC’s joint venture with a Chinese technology partner focuses on precision sprayer systems, combining chemical solutions with hardware to capture value beyond active ingredient margins. Growth opportunities also exist in emerging markets, where increasing mechanization and improvements in post-harvest logistics drive demand. Collaborations with local distribution networks in regions such as Asia-Pacific and Africa enable multinational firms to establish early market presence before domestic competitors gain significant traction.
Fungicide Industry Leaders
-
Syngenta Group
-
Bayer AG
-
BASF SE
-
Corteva Agriscience
-
UPL Limited
- *Disclaimer: Major Players sorted in no particular order
Recent Industry Developments
- September 2025: Syngenta has introduced SEEKER, a fungicide developed for soybean and wheat crops. It contains Fenpropidin, a new active ingredient from the Piperidine group (FRAC 5). This product addresses diseases that have developed resistance to older treatments, providing a crucial solution for improved disease management in the Brazilian market.
- September 2025: Corteva Agriscience introduced Zorvec Entecta, a fungicide designed to enhance grape and potato cultivation in India. Leveraging the established success of its global Zorvec technology, this solution provides growers with effective protection against significant diseases such as Downy Mildew (Plasmopara viticola) in grapes and Late Blight (Phytophthora infestans) in potatoes.
- July 2025: Bayer AG has launched Felujit, a fungicide designed to protect all parts of the rice plant from sheath blight, a significant and persistent disease affecting paddy cultivation in India. Felujit incorporates a formulation combining Penflufen and Tebuconazole, providing a dual mode of action to control sheath blight caused by the soil-borne pathogen Rhizoctonia solani.
- June 2025: FMC Corporation has obtained regulatory approval for Fidresa fungicide in Argentina, representing a strategic step in the global commercialization of fluindapyr. This approval provides cereal growers in Argentina with an effective solution to combat persistent disease challenges, including tan spot, leaf scald, leaf spots, and rusts.
Global Fungicide Market Report Scope
Chemigation, Foliar, Fumigation, Seed Treatment, Soil Treatment are covered as segments by Application Mode. Commercial Crops, Fruits & Vegetables, Grains & Cereals, Pulses & Oilseeds, Turf & Ornamental are covered as segments by Crop Type. Africa, Asia-Pacific, Europe, North America, South America are covered as segments by Region.| Chemigation |
| Foliar |
| Fumigation |
| Seed Treatment |
| Soil Treatment |
| Commercial Crops |
| Fruits and Vegetables |
| Grains and Cereals |
| Pulses and Oilseeds |
| Turf and Ornamental |
| Africa | By Country | South Africa |
| Rest of Africa | ||
| Asia-Pacific | By Country | Australia |
| China | ||
| India | ||
| Indonesia | ||
| Japan | ||
| Myanmar | ||
| Pakistan | ||
| Philippines | ||
| Thailand | ||
| Vietnam | ||
| Rest of Asia-Pacific | ||
| Europe | By Country | France |
| Germany | ||
| Italy | ||
| Netherlands | ||
| Russia | ||
| Spain | ||
| Ukraine | ||
| United Kingdom | ||
| Rest of Europe | ||
| North America | By Country | Canada |
| Mexico | ||
| United States | ||
| Rest of North America | ||
| South America | By Country | Argentina |
| Brazil | ||
| Chile | ||
| Rest of South America |
| Application Mode | Chemigation | ||
| Foliar | |||
| Fumigation | |||
| Seed Treatment | |||
| Soil Treatment | |||
| Crop Type | Commercial Crops | ||
| Fruits and Vegetables | |||
| Grains and Cereals | |||
| Pulses and Oilseeds | |||
| Turf and Ornamental | |||
| Geography | Africa | By Country | South Africa |
| Rest of Africa | |||
| Asia-Pacific | By Country | Australia | |
| China | |||
| India | |||
| Indonesia | |||
| Japan | |||
| Myanmar | |||
| Pakistan | |||
| Philippines | |||
| Thailand | |||
| Vietnam | |||
| Rest of Asia-Pacific | |||
| Europe | By Country | France | |
| Germany | |||
| Italy | |||
| Netherlands | |||
| Russia | |||
| Spain | |||
| Ukraine | |||
| United Kingdom | |||
| Rest of Europe | |||
| North America | By Country | Canada | |
| Mexico | |||
| United States | |||
| Rest of North America | |||
| South America | By Country | Argentina | |
| Brazil | |||
| Chile | |||
| Rest of South America | |||
Market Definition
- Function - Fungicides are chemicals used to control or prevent fungi from damaging the crop and prevent yield loss.
- Application Mode - Foliar, Seed Treatment, Soil Treatment, Chemigation, and Fumigation are the different type of application modes through which crop protection chemicals are applied to the crops.
- Crop Type - This represents the consumption of crop protection chemicals by Cereals, Pulses, Oilseeds, Fruits, Vegetables, Turf, and Ornamental crops.
| Keyword | Definition |
|---|---|
| IWM | Integrated weed management (IWM) is an approach to incorporate multiple weed control techniques throughout the growing season to give producers the best opportunity to control problematic weeds. |
| Host | Hosts are the plants that form relationships with beneficial microorganisms and help them colonize. |
| Pathogen | A disease-causing organism. |
| Herbigation | Herbigation is an effective method of applying herbicides through irrigation systems. |
| Maximum residue levels (MRL) | Maximum Residue Limit (MRL) is the maximum allowed limit of pesticide residue in food or feed obtained from plants and animals. |
| IoT | The Internet of Things (IoT) is a network of interconnected devices that connect and exchange data with other IoT devices and the cloud. |
| Herbicide-tolerant varieties (HTVs) | Herbicide-tolerant varieties are plant species that have been genetically engineered to be resistant to herbicides used on crops. |
| Chemigation | Chemigation is a method of applying pesticides to crops through an irrigation system. |
| Crop Protection | Crop protection is a method of protecting crop yields from different pests, including insects, weeds, plant diseases, and others that cause damage to agricultural crops. |
| Seed Treatment | Seed treatment helps to disinfect seeds or seedlings from seed-borne or soil-borne pests. Crop protection chemicals, such as fungicides, insecticides, or nematicides, are commonly used for seed treatment. |
| Fumigation | Fumigation is the application of crop protection chemicals in gaseous form to control pests. |
| Bait | A bait is a food or other material used to lure a pest and kill it through various methods, including poisoning. |
| Contact Fungicide | Contact pesticides prevent crop contamination and combat fungal pathogens. They act on pests (fungi) only when they come in contact with the pests. |
| Systemic Fungicide | A systemic fungicide is a compound taken up by a plant and then translocated within the plant, thus protecting the plant from attack by pathogens. |
| Mass Drug Administration (MDA) | Mass drug administration is the strategy to control or eliminate many neglected tropical diseases. |
| Mollusks | Mollusks are pests that feed on crops, causing crop damage and yield loss. Mollusks include octopi, squid, snails, and slugs. |
| Pre-emergence Herbicide | Preemergence herbicides are a form of chemical weed control that prevents germinated weed seedlings from becoming established. |
| Post-emergence Herbicide | Postemergence herbicides are applied to the agricultural field to control weeds after emergence (germination) of seeds or seedlings. |
| Active Ingredients | Active ingredients are the chemicals in pesticide products that kill, control, or repel pests. |
| United States Department of Agriculture (USDA) | The Department of Agriculture provides leadership on food, agriculture, natural resources, and related issues. |
| Weed Science Society of America (WSSA) | The WSSA, a non-profit professional society, promotes research, education, and extension outreach activities related to weeds. |
| Suspension concentrate | Suspension concentrate (SC) is one of the formulations of crop protection chemicals with solid active ingredients dispersed in water. |
| Wettable powder | A wettable powder (WP) is a powder formulation that forms a suspension when mixed with water prior to spraying. |
| Emulsifiable concentrate | Emulsifiable concentrate (EC) is a concentrated liquid formulation of pesticide that needs to be diluted with water to create a spray solution. |
| Plant-parasitic nematodes | Parasitic Nematodes feed on the roots of crops, causing damage to the roots. These damages allow for easy plant infestation by soil-borne pathogens, which results in crop or yield loss. |
| Australian Weeds Strategy (AWS) | The Australian Weeds Strategy, owned by the Environment and Invasives Committee, provides national guidance on weed management. |
| Weed Science Society of Japan (WSSJ) | WSSJ aims to contribute to the prevention of weed damage and the utilization of weed value by providing the chance for research presentation and information exchange. |
Research Methodology
Mordor Intelligence follows a four-step methodology in all our reports.
- Step-1: Identify Key Variables: In order to build a robust forecasting methodology, the variables and factors identified in Step-1 are tested against available historical market numbers. Through an iterative process, the variables required for market forecast are set and the model is built on the basis of these variables.
- Step-2: Build a Market Model: Market-size estimations for the forecast years are in nominal terms. Inflation is not a part of the pricing, and the average selling price (ASP) is kept constant throughout the forecast period.
- Step-3: Validate and Finalize: In this important step, all market numbers, variables and analyst calls are validated through an extensive network of primary research experts from the market studied. The respondents are selected across levels and functions to generate a holistic picture of the market studied.
- Step-4: Research Outputs: Syndicated Reports, Custom Consulting Assignments, Databases & Subscription Platforms


