
| Study Period | 2017 - 2030 |
| Base Year For Estimation | 2024 |
| Forecast Data Period | 2025 - 2030 |
| Market Size (2025) | USD 29.94 Billion |
| Market Size (2030) | USD 47.42 Billion |
| CAGR (2025 - 2030) | 9.63 % |
| Market Concentration | Low |
Major Players*Disclaimer: Major Players sorted in no particular order |


Agricultural Biologicals Market Analysis
The Agricultural Biologicals Market size is estimated at 29.94 billion USD in 2025, and is expected to reach 47.42 billion USD by 2030, growing at a CAGR of 9.63% during the forecast period (2025-2030).
The agricultural biologicals industry is experiencing a significant transformation driven by the increasing adoption of sustainable farming practices and technological innovations. The shift towards biological alternatives has been particularly evident in crop nutrition, where organic fertilizers have emerged as a dominant force, accounting for 58.8% of the crop nutrition market in 2022. This transition reflects a broader industry-wide movement towards environmentally responsible agricultural practices, supported by advances in biotechnology and microbial research. The integration of precision agriculture technologies with biological products has enabled farmers to optimize application methods and improve the efficacy of these sustainable solutions.
The industry has witnessed remarkable developments in product formulations and application technologies, particularly in the biocontrol segment. Meal-based fertilizers, which accounted for 43.2% of the organic fertilizer market in 2022, have undergone significant improvements in terms of nutrient availability and release patterns. Manufacturers are investing heavily in research and development to enhance the stability and shelf life of biological products, addressing historical challenges related to storage and handling. These advancements have led to the development of new delivery systems and formulation technologies that improve the consistency and reliability of biological products.
The emergence of integrated pest management (IPM) strategies has revolutionized the biological control segment, with predator species demonstrating remarkable effectiveness. In 2022, predator species dominated the macrobial market, accounting for 91% of the market value, highlighting their crucial role in sustainable pest management. This success has spurred increased investment in research and development of new biocontrol agents, leading to the discovery and commercialization of novel strains and species. The agricultural microbials industry has also seen significant advancement in production techniques, enabling more efficient and cost-effective manufacturing of biological control agents.
Technological innovation continues to drive market evolution, with significant developments in fermentation technologies and production processes. Companies are increasingly adopting advanced manufacturing techniques to improve product quality and consistency while reducing production costs. The integration of artificial intelligence and machine learning in product development has accelerated the discovery of new biological compounds and organisms with agricultural applications. These technological advancements have been complemented by improvements in formulation technologies, enabling the development of products with enhanced stability, efficacy, and ease of application. The agricultural microbials market is poised to benefit from these innovations, as agricultural microorganisms play a pivotal role in advancing sustainable agriculture.
Global Agricultural Biologicals Market Trends
Organic production is at an all-time high in North America and Europe, due to the increasing awareness and Government initiatives.
- Organic agriculture has emerged as a significant contributor to sustainable food systems, with 187 countries practicing it globally. As of 2021, there was 72.3 million ha of organic agricultural land worldwide, with an average increase of 2.9% across all regions from 2018 to 2021. Organic arable land accounted for 14.4 million ha, representing 19.9% of the total organic agricultural land.
- The strongest markets for organic farming are North America and Europe, accounting for 41.0% of the global organic arable land. In 2022, Europe had 6.5 million ha of organic arable land, equivalent to 44.1% of the overall organic arable agricultural area. The most significant crops grown organically in North America and Europe are apples, strawberries, cereals, and olives.
- Developing countries in Asia-Pacific are also joining the organic agriculture movement and becoming self-sufficient in producing and providing fresh organic produce to meet their domestic demand. The trend of organic farming is gaining momentum in Asia-Pacific, with the region recording an 18.8% increase in organic arable land from 2017 to 2022. The major initiatives by governments in the region also play a vital role in the growing trend of organic farming. For example, Japan's Basic Plan for Food, Agriculture, and Rural Areas aims to triple the number of organic farmers and lands by 2030.
- The growth of organic agriculture is driven by the rising awareness of the benefits of organic farming, such as promoting soil health, reducing environmental impacts, and producing healthier food.

Understand The Key Trends Shaping This Market
Download PDF
Per capita spending of organic food majorly observed in United States and Germany, attributed to the consumer demand for healthier and sustainable food
- The organic food market experienced significant growth in the past few years, with global sales reaching USD 120.6 billion in 2020, up from USD 70.8 billion in 2012. The trend toward organic food is being driven by several factors, such as increasing consumer demand for healthier, more sustainable food options and a growing awareness of the environmental impact of conventional agriculture. The global organic food market is expected to continue its growth trend over the coming years.
- According to a survey conducted by the Organic Trade Association in 2021, sales of organic fruits and vegetables increased by around 4.5% in the same year, accounting for 15% of the overall organic sales. North America dominates the market in terms of average spending on organic products, with per capita spending in the United States reaching USD 186.7 in 2021, the highest among all North American countries. Europe is also expected to experience significant growth in the organic food market, with Germany accounting for the highest per capita spending of USD 75.6 in 2021.
- While the organic food market is still dominated by developed countries with high consumer disposable incomes, it is also expected to grow in developing nations. For example, the increasing number of working-class people in the Asia-Pacific region may contribute to the market's expansion due to the growing availability and affordability of organic food products.

Segment Analysis: Function
Crop Nutrition Segment in Agricultural Biologicals Market
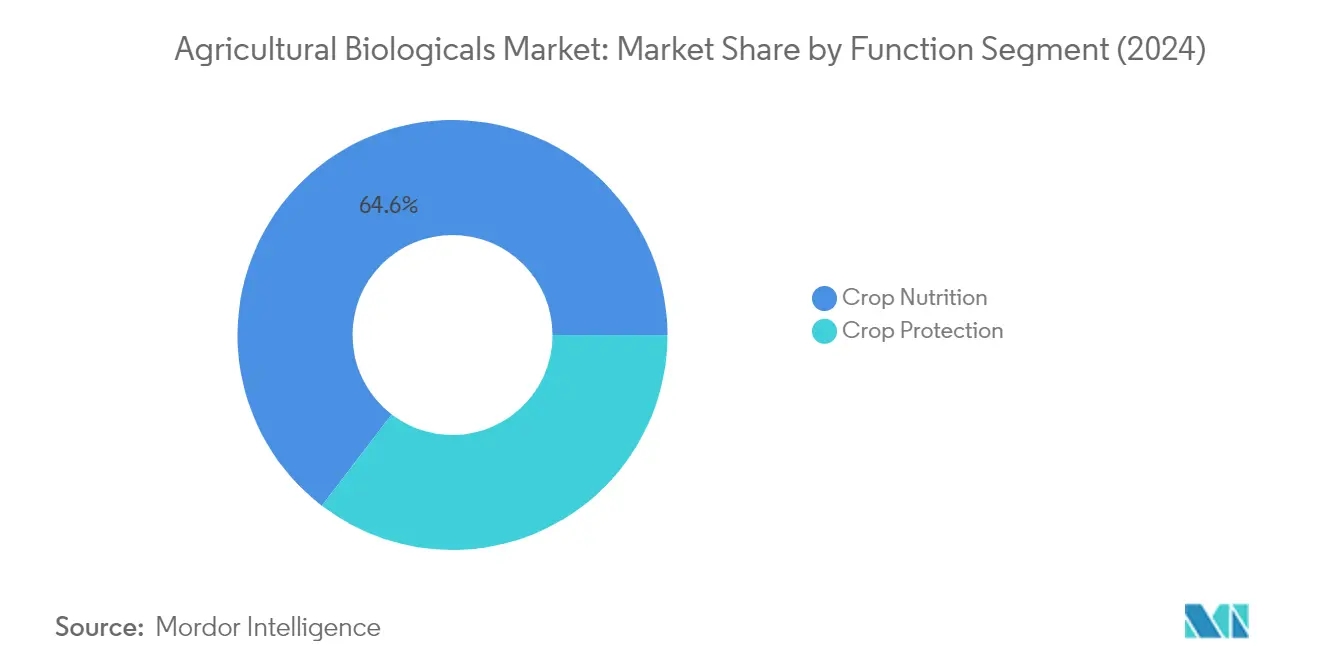
The Crop Nutrition segment continues to dominate the global agricultural microbials market, accounting for approximately 65% of the total market value in 2024. This segment's dominance is primarily driven by the widespread adoption of organic fertilizers, which represent about 59% of the crop nutrition market due to their vast availability and cost-effectiveness. Within the crop nutrition segment, meal-based fertilizers hold the largest share at around 43%, particularly due to their high specific nutrient content like phosphorus and nitrogen. The segment's strong performance is further supported by increasing adoption in row crops, which account for over 72% of crop nutrition product consumption. Europe and Asia-Pacific have emerged as the major consumers of crop nutrition biologicals, collectively accounting for over 76% of the segment's market value, driven by extensive organic farming practices and supportive government initiatives promoting sustainable agriculture.
Crop Protection Segment in Agricultural Biologicals Market
The Crop Protection segment is experiencing rapid growth in the agricultural microbials market, projected to expand at approximately 11% annually from 2024 to 2029. This accelerated growth is primarily driven by the increasing adoption of biopesticides, which dominate the crop protection segment with nearly 84% market share. Biofungicides are emerging as the most widely used biopesticides, effectively controlling plant diseases caused by pathogenic fungi in both organic and conventional farming systems. The segment's growth is further catalyzed by rising awareness about sustainable pest management practices and stringent regulations on chemical pesticide usage across major agricultural markets. The expansion is particularly notable in North America and Europe, where farmers are increasingly transitioning to biological crop protection solutions as part of integrated pest management strategies.
Segment Analysis: Crop Type
Row Crops Segment in Agricultural Biologicals Market
Row crops dominate the global agricultural biologicals market, accounting for approximately 75% of the total market value in 2024. This significant market share is primarily attributed to the vast cultivation area dedicated to row crops globally, including major staples like maize, rice, sorghum, and wheat. Europe leads the market value for row crops, contributing about 36% of the segment's total value, with wheat, maize, corn, barley, and oats being the most important crops grown in the region. The dominance of row crops is further strengthened by the extensive adoption of organic farming practices in these crops, with organic fertilizers holding the highest share at around 85% in major producing regions. The segment's strong position is also supported by the increasing trend in organic cereal agriculture and the growing recognition of the benefits of organic farming methods in row crop production.
Horticultural Crops Segment in Agricultural Biologicals Market
The horticultural crops segment is experiencing the fastest growth in the agricultural biologicals market, projected to grow at approximately 10% CAGR from 2024 to 2029. This robust growth is driven by the increasing demand for organic fruits and vegetables in both local and international markets, with prices typically commanding a 10-15% premium over conventional produce. The segment's growth is particularly strong in the European region, where climate conditions in southern areas are ideal for growing various tropical fruits. The expansion is further supported by research indicating that organic foods may contain higher levels of antioxidants than conventionally cultivated foods, making them more beneficial for health and cancer prevention. The segment's growth is also bolstered by the rising consumer awareness about food safety and the increasing preference for chemical-free produce.
Remaining Segments in Crop Type Segmentation
The cash crops segment, while smaller in market share, plays a vital role in the agricultural biologicals market, particularly in regions specializing in crops like cotton, tea, coffee, sugarcane, tobacco, cocoa, and rubber. This segment is particularly significant in developing regions where these crops represent major export commodities. The segment's importance is enhanced by the growing trend toward sustainable farming practices in cash crop production, with organic certification becoming increasingly important for international trade. The adoption of biological solutions in cash crops is driven by both environmental concerns and the premium prices that organic cash crops command in the global market. The role of agricultural microorganisms in enhancing soil health and crop yield is becoming increasingly recognized, further boosting the segment's growth potential.
Agricultural Biologicals Market Geography Segment Analysis
Agricultural Biologicals Market in Africa
The African agricultural biologicals market is experiencing significant transformation as countries across the region embrace sustainable farming practices. Egypt, Nigeria, and South Africa are the key markets driving the adoption of biological products, with each country showing distinct patterns in usage across different crop segments. The region's growth is supported by increasing awareness about environmental sustainability and government initiatives to promote organic farming methods.Agricultural Biologicals Market in NigeriaNigeria has emerged as the dominant force in Africa's agricultural microbials market, with the largest market share in the region. The country accounts for approximately 7% of the total African agricultural biologicals market value in 2024. The market is particularly strong in crop protection products, with biocontrol agents leading the segment. The government's National Organic Agriculture Program and support from organizations like OOCORD are helping small-scale organic farmers connect to markets.Agricultural Biologicals Market in EgyptEgypt represents the fastest-growing market in the African region, with an expected growth rate of approximately 11% between 2024-2029. The country's biological market is dominated by crop nutrition products, particularly organic fertilizers. Egypt's strong position in organic exports and various government initiatives, including collaboration with FAO and IFAD, are driving market expansion. The country has also implemented projects to strengthen smallholder farmers' capabilities in adopting sustainable water, soil, and agronomic practices.
Agricultural Biologicals Market in Asia-Pacific
The Asia-Pacific region represents a significant market for agricultural biologicals, with diverse adoption patterns across different countries. China and India lead the market, while countries like Japan, Australia, Indonesia, the Philippines, Thailand, and Vietnam show increasing acceptance of biological products. The region's growth is driven by rising awareness about sustainable farming practices and government initiatives to reduce chemical inputs in agriculture.Agricultural Biologicals Market in ChinaChina dominates the Asia-Pacific agricultural microbials market, commanding approximately 75% of the regional market value in 2024. The country has set ambitious goals for reducing chemical pesticide use in major crops, targeting a 5% reduction in rice, corn, and wheat, and a 10% reduction in fruits and vegetables by 2025. The government's emphasis on "green" prevention methods and sustainable farming practices has created a strong foundation for market growth.Agricultural Biologicals Market in IndiaIndia represents the fastest-growing market in the Asia-Pacific region, with a projected growth rate of approximately 7% between 2024-2029. The country's biological market is supported by various government initiatives, including the Paramparagat Krishi Vikas Yojana and Mission Organic Value Chain Development. The increasing trend in organic farming and rising demand for organic products both domestically and internationally are driving market expansion.
Agricultural Biologicals Market in Europe
Europe stands as a global leader in the agricultural microbials market, with a strong focus on sustainable farming practices. The region benefits from supportive regulatory frameworks and ambitious targets, including the Farm to Fork Strategy's goal of achieving 25% organic farming by 2030. Key markets include France, Germany, Italy, the Netherlands, Russia, Spain, Turkey, and the UK, each contributing significantly to the region's biological agriculture sector.Agricultural Biologicals Market in FranceFrance leads the European agricultural biologicals market, holding the largest market share in the region. The country has established itself as a pioneer in organic farming, with extensive organic crop areas and a comprehensive support system for biological agriculture. The market is particularly strong in crop nutrition products, with organic fertilizers and biostimulants showing significant adoption rates.Agricultural Biologicals Market in GermanyGermany represents the fastest-growing market in the European region. The country has set ambitious targets for organic food market penetration, aiming to achieve 30% organic food in German supermarkets by 2030. The market shows particular strength in row crops, which dominate the biological products consumption, supported by increasing consumer awareness and demand for organic products.
Agricultural Biologicals Market in Middle East
The Middle East agricultural biologicals market is witnessing steady growth, driven by increasing awareness of sustainable farming practices and government initiatives to promote organic agriculture. Saudi Arabia leads the regional market, benefiting from strong consumer demand for organic products and government support for sustainable farming practices. Iran shows the fastest growth potential in the region, supported by the Ministry of Agriculture's promotion of certified organic farming methods with support from FAO to address environmental concerns related to chemical fertilizers and pesticides in agriculture.
Agricultural Biologicals Market in North America
The North American agricultural biologicals market demonstrates strong growth potential, supported by robust research and development infrastructure and increasing consumer demand for organic products. The United States leads the regional market, with extensive adoption across various crop segments and strong regulatory support for biological products. Canada shows the fastest growth potential, driven by increasing awareness about sustainable farming practices and government initiatives to promote organic agriculture. Mexico continues to expand its organic farming area, contributing significantly to the region's biological agriculture sector.
Agricultural Biologicals Market in South America
The South American agricultural biologicals market is experiencing significant growth, driven by increasing awareness about sustainable farming practices and stringent regulations on chemical pesticides. Brazil emerges as the regional market leader, with strong adoption across various crop segments and robust government support for organic farming initiatives. Argentina shows the fastest growth potential, supported by FAO's Strategic Framework 2022-2031, which focuses on transforming agri-food systems to be more efficient and sustainable through agroeconomic approaches.
Get Analysis on Important Geographic Markets
Download PDF
Agricultural Biologicals Industry Overview
Top Companies in Agricultural Biologicals Market
The agricultural microbials market is characterized by active product innovation and strategic expansion initiatives from leading players like Corteva Agriscience, Biobest Group, and Koppert Biological Systems. Companies are increasingly focusing on developing safer and environmentally friendly crop protection solutions through extensive research and development programs. Strategic partnerships for product development and commercialization have become a common trend, with firms collaborating to leverage complementary capabilities. Geographic expansion, particularly into emerging markets, represents another key strategic priority as companies aim to capture growth opportunities. The industry has witnessed moderate merger and acquisition activity, primarily driven by companies looking to either expand their geographical presence or strengthen their product portfolios through strategic acquisitions of specialized biologicals firms.
Fragmented Market with Diverse Player Base
The agricultural microbials industry exhibits a highly fragmented structure with a mix of global conglomerates and specialized regional players. The top companies collectively hold a relatively small share of the total market, indicating low market concentration and high competition. Large agricultural input companies are increasingly entering the space through acquisitions of specialized biologicals firms, while established biologicals specialists maintain their market positions through technical expertise and focused innovation.
The market is witnessing a gradual consolidation trend through strategic acquisitions, though it remains relatively fragmented. Regional players maintain strong positions in their local markets through a deep understanding of farmer needs and established distribution networks. The industry structure supports both large-scale operations of multinational companies and specialized niche players focusing on specific product categories or regional markets. Companies are increasingly focusing on building comprehensive biologicals portfolios through both internal development and strategic acquisitions.
Innovation and Distribution Drive Market Success
Success in the agricultural microbials market increasingly depends on companies' ability to develop effective, reliable products while building strong distribution networks. Market leaders are investing heavily in research and development to create innovative solutions that match or exceed the performance of conventional agricultural inputs. Building farmer trust through product efficacy demonstrations and technical support has become crucial for market success. Companies are also focusing on developing integrated solutions that combine different types of biological products to provide comprehensive crop management solutions.
For new entrants and smaller players, success lies in identifying and serving specific market niches while building strong technical capabilities. Strategic partnerships with established agricultural input companies can provide access to broader distribution networks and customer bases. Regulatory compliance capabilities are becoming increasingly important as governments worldwide develop specific frameworks for biological products. Companies must also focus on production scalability and cost optimization to maintain competitiveness in a market where price sensitivity remains significant. The ability to adapt to evolving farmer needs and changing agricultural practices will be crucial for long-term success in this dynamic market.
Agricultural Biologicals Market Leaders
-
Biobest Group NV
-
Corteva Agriscience
-
Koppert Biological Systems Inc.
-
Suståne Natural Fertilizer Inc.
-
Valent Biosciences LLC
- *Disclaimer: Major Players sorted in no particular order

Need More Details on Market Players and Competiters?
Download PDF
Agricultural Biologicals Market News
- September 2022: Corteva Agriscience agreed to acquire Symborg Inc., and this move will strengthen Symborg's global presence with a strong distribution network.
- August 2022: Biobest announced the acquisition of Agronologica. The acquisition will allow enhanced access to Biobest’s technical expertise, product portfolio, and optimized logistics in Portugal.
- July 2022: A new granular inoculant called LALFIX® START SPHERICAL Granule was launched, which combines Bacillus velezensis, a plant growth-promoting microbe, with two distinct rhizobium strains. This powerful and well-tested PGPM boosts phosphorus solubilization and improves root mass.
Free With This Report
Along with the report, We also offer a comprehensive and exhaustive data pack on Areas under organic cultivation, one of the key trends that affect the market size of agricultural biologicals. This data pack also includes areas under cultivation by crop types, such as Row Crops (Cereals, Pulses, and Oilseeds), Horticultural Crops (Fruits and Vegetables), and Cash Crops in North America, Europe, Asia-Pacific, South America and Africa.


Agricultural Biologicals Market Report - Table of Contents
1. EXECUTIVE SUMMARY & KEY FINDINGS
2. REPORT OFFERS
3. INTRODUCTION
- 3.1 Study Assumptions & Market Definition
- 3.2 Scope of the Study
- 3.3 Research Methodology
4. KEY INDUSTRY TRENDS
- 4.1 Area Under Organic Cultivation
- 4.2 Per Capita Spending On Organic Products
-
4.3 Regulatory Framework
- 4.3.1 Argentina
- 4.3.2 Australia
- 4.3.3 Brazil
- 4.3.4 Canada
- 4.3.5 China
- 4.3.6 Egypt
- 4.3.7 France
- 4.3.8 Germany
- 4.3.9 India
- 4.3.10 Indonesia
- 4.3.11 Italy
- 4.3.12 Japan
- 4.3.13 Mexico
- 4.3.14 Netherlands
- 4.3.15 Nigeria
- 4.3.16 Philippines
- 4.3.17 Russia
- 4.3.18 South Africa
- 4.3.19 Spain
- 4.3.20 Thailand
- 4.3.21 Turkey
- 4.3.22 United Kingdom
- 4.3.23 United States
- 4.3.24 Vietnam
- 4.4 Value Chain & Distribution Channel Analysis
5. MARKET SEGMENTATION (includes market size in Value in USD and Volume, Forecasts up to 2030 and analysis of growth prospects)
-
5.1 Function
- 5.1.1 Crop Nutrition
- 5.1.1.1 Biofertilizer
- 5.1.1.1.1 Azospirillum
- 5.1.1.1.2 Azotobacter
- 5.1.1.1.3 Mycorrhiza
- 5.1.1.1.4 Phosphate Solubilizing Bacteria
- 5.1.1.1.5 Rhizobium
- 5.1.1.1.6 Other Biofertilizers
- 5.1.1.2 Biostimulants
- 5.1.1.2.1 Amino Acids
- 5.1.1.2.2 Fulvic Acid
- 5.1.1.2.3 Humic Acid
- 5.1.1.2.4 Protein Hydrolysates
- 5.1.1.2.5 Seaweed Extracts
- 5.1.1.2.6 Other Biostimulants
- 5.1.1.3 Organic Fertilizer
- 5.1.1.3.1 Manure
- 5.1.1.3.2 Meal Based Fertilizers
- 5.1.1.3.3 Oilcakes
- 5.1.1.3.4 Other Organic Fertilizers
- 5.1.2 Crop Protection
- 5.1.2.1 Biocontrol Agents
- 5.1.2.1.1 Macrobials
- 5.1.2.1.2 Microbials
- 5.1.2.2 Biopesticides
- 5.1.2.2.1 Biofungicides
- 5.1.2.2.2 Bioherbicides
- 5.1.2.2.3 Bioinsecticides
- 5.1.2.2.4 Other Biopesticides
-
5.2 Crop Type
- 5.2.1 Cash Crops
- 5.2.2 Horticultural Crops
- 5.2.3 Row Crops
-
5.3 Region
- 5.3.1 Africa
- 5.3.1.1 Egypt
- 5.3.1.2 Nigeria
- 5.3.1.3 South Africa
- 5.3.1.4 Rest of Africa
- 5.3.2 Asia-Pacific
- 5.3.2.1 Australia
- 5.3.2.2 China
- 5.3.2.3 India
- 5.3.2.4 Indonesia
- 5.3.2.5 Japan
- 5.3.2.6 Philippines
- 5.3.2.7 Thailand
- 5.3.2.8 Vietnam
- 5.3.2.9 Rest of Asia-Pacific
- 5.3.3 Europe
- 5.3.3.1 France
- 5.3.3.2 Germany
- 5.3.3.3 Italy
- 5.3.3.4 Netherlands
- 5.3.3.5 Russia
- 5.3.3.6 Spain
- 5.3.3.7 Turkey
- 5.3.3.8 United Kingdom
- 5.3.3.9 Rest of Europe
- 5.3.4 Middle East
- 5.3.4.1 Iran
- 5.3.4.2 Saudi Arabia
- 5.3.4.3 Rest of Middle East
- 5.3.5 North America
- 5.3.5.1 Canada
- 5.3.5.2 Mexico
- 5.3.5.3 United States
- 5.3.5.4 Rest of North America
- 5.3.6 South America
- 5.3.6.1 Argentina
- 5.3.6.2 Brazil
- 5.3.6.3 Rest of South America
6. COMPETITIVE LANDSCAPE
- 6.1 Key Strategic Moves
- 6.2 Market Share Analysis
- 6.3 Company Landscape
-
6.4 Company Profiles (includes Global Level Overview, Market Level Overview, Core Business Segments, Financials, Headcount, Key Information, Market Rank, Market Share, Products and Services, and Analysis of Recent Developments).
- 6.4.1 Agriculture Solutions Inc.
- 6.4.2 Biobest Group NV
- 6.4.3 Bioworks Inc.
- 6.4.4 California Organic Fertilizers Inc.
- 6.4.5 Cascade Agronomics LLC
- 6.4.6 Corteva Agriscience
- 6.4.7 Indogulf BioAg LLC (Biotech Division of Indogulf Company)
- 6.4.8 Koppert Biological Systems Inc.
- 6.4.9 Lallemand Inc.
- 6.4.10 Samriddhi Crops India Pvt Ltd
- 6.4.11 Sigma Agriscience LLC
- 6.4.12 Suståne Natural Fertilizer Inc.
- 6.4.13 Symborg Inc.
- 6.4.14 The Espoma Company
- 6.4.15 Valent Biosciences LLC
7. KEY STRATEGIC QUESTIONS FOR AGRICULTURAL BIOLOGICALS CEOS
8. APPENDIX
-
8.1 Global Overview
- 8.1.1 Overview
- 8.1.2 Porter’s Five Forces Framework
- 8.1.3 Global Value Chain Analysis
- 8.1.4 Market Dynamics (DROs)
- 8.2 Sources & References
- 8.3 List of Tables & Figures
- 8.4 Primary Insights
- 8.5 Data Pack
- 8.6 Glossary of Terms
You Can Purchase Parts Of This Report. Check Out Prices For Specific Sections
Get Price Break-up Now
List of Tables & Figures
- Figure 1:
- AREA UNDER ORGANIC CULTIVATION IN HECTARES, GLOBAL, 2017 - 2022
- Figure 2:
- PER CAPITA SPENDING ON ORGANIC PRODUCTS IN USD, GLOBAL, 2017 - 2022
- Figure 3:
- GLOBAL AGRICULTURAL BIOLOGICALS MARKET, VOLUME, METRIC TON, 2017 - 2029
- Figure 4:
- GLOBAL AGRICULTURAL BIOLOGICALS MARKET, VALUE, USD, 2017 - 2029
- Figure 5:
- AGRICULTURAL BIOLOGICALS CONSUMPTION IN METRIC TON, GLOBAL, 2017 - 2029
- Figure 6:
- AGRICULTURAL BIOLOGICALS CONSUMPTION IN USD, GLOBAL, 2017 - 2029
- Figure 7:
- AGRICULTURAL BIOLOGICALS CONSUMPTION VOLUME BY FUNCTION IN %, GLOBAL, 2017 VS 2023 VS 2029
- Figure 8:
- AGRICULTURAL BIOLOGICALS CONSUMPTION VALUE BY FUNCTION IN %, GLOBAL, 2017 VS 2023 VS 2029
- Figure 9:
- CROP NUTRITION CONSUMPTION BY TYPE IN METRIC TON, GLOBAL, 2017 - 2029
- Figure 10:
- CROP NUTRITION CONSUMPTION BY TYPE IN USD, GLOBAL, 2017 - 2029
- Figure 11:
- CROP NUTRITION CONSUMPTION VOLUME BY TYPE IN %, GLOBAL, 2017 VS 2023 VS 2029
- Figure 12:
- CROP NUTRITION CONSUMPTION VALUE BY TYPE IN %, GLOBAL, 2017 VS 2023 VS 2029
- Figure 13:
- BIOFERTILIZER CONSUMPTION IN METRIC TON, GLOBAL, 2017 - 2029
- Figure 14:
- BIOFERTILIZER CONSUMPTION IN USD, GLOBAL, 2017 - 2029
- Figure 15:
- BIOFERTILIZER CONSUMPTION VOLUME BY FORM IN %, GLOBAL, 2017 VS 2023 VS 2029
- Figure 16:
- BIOFERTILIZER CONSUMPTION VALUE BY FORM IN %, GLOBAL, 2017 VS 2023 VS 2029
- Figure 17:
- AZOSPIRILLUM CONSUMPTION IN METRIC TON, GLOBAL, 2017 - 2029
- Figure 18:
- AZOSPIRILLUM CONSUMPTION IN USD, GLOBAL, 2017 - 2029
- Figure 19:
- AZOSPIRILLUM CONSUMPTION VALUE BY CROP TYPE IN %, GLOBAL, 2022 VS 2029
- Figure 20:
- AZOTOBACTER CONSUMPTION IN METRIC TON, GLOBAL, 2017 - 2029
- Figure 21:
- AZOTOBACTER CONSUMPTION IN USD, GLOBAL, 2017 - 2029
- Figure 22:
- AZOTOBACTER CONSUMPTION VALUE BY CROP TYPE IN %, GLOBAL, 2022 VS 2029
- Figure 23:
- MYCORRHIZA CONSUMPTION IN METRIC TON, GLOBAL, 2017 - 2029
- Figure 24:
- MYCORRHIZA CONSUMPTION IN USD, GLOBAL, 2017 - 2029
- Figure 25:
- MYCORRHIZA CONSUMPTION VALUE BY CROP TYPE IN %, GLOBAL, 2022 VS 2029
- Figure 26:
- PHOSPHATE SOLUBILIZING BACTERIA CONSUMPTION IN METRIC TON, GLOBAL, 2017 - 2029
- Figure 27:
- PHOSPHATE SOLUBILIZING BACTERIA CONSUMPTION IN USD, GLOBAL, 2017 - 2029
- Figure 28:
- PHOSPHATE SOLUBILIZING BACTERIA CONSUMPTION VALUE BY CROP TYPE IN %, GLOBAL, 2022 VS 2029
- Figure 29:
- RHIZOBIUM CONSUMPTION IN METRIC TON, GLOBAL, 2017 - 2029
- Figure 30:
- RHIZOBIUM CONSUMPTION IN USD, GLOBAL, 2017 - 2029
- Figure 31:
- RHIZOBIUM CONSUMPTION VALUE BY CROP TYPE IN %, GLOBAL, 2022 VS 2029
- Figure 32:
- OTHER BIOFERTILIZERS CONSUMPTION IN METRIC TON, GLOBAL, 2017 - 2029
- Figure 33:
- OTHER BIOFERTILIZERS CONSUMPTION IN USD, GLOBAL, 2017 - 2029
- Figure 34:
- OTHER BIOFERTILIZERS CONSUMPTION VALUE BY CROP TYPE IN %, GLOBAL, 2022 VS 2029
- Figure 35:
- BIOSTIMULANTS CONSUMPTION IN METRIC TON, GLOBAL, 2017 - 2029
- Figure 36:
- BIOSTIMULANTS CONSUMPTION IN USD, GLOBAL, 2017 - 2029
- Figure 37:
- BIOSTIMULANTS CONSUMPTION VOLUME BY FORM IN %, GLOBAL, 2017 VS 2023 VS 2029
- Figure 38:
- BIOSTIMULANTS CONSUMPTION VALUE BY FORM IN %, GLOBAL, 2017 VS 2023 VS 2029
- Figure 39:
- AMINO ACIDS CONSUMPTION IN METRIC TON, GLOBAL, 2017 - 2029
- Figure 40:
- AMINO ACIDS CONSUMPTION IN USD, GLOBAL, 2017 - 2029
- Figure 41:
- AMINO ACIDS CONSUMPTION VALUE BY CROP TYPE IN %, GLOBAL, 2022 VS 2029
- Figure 42:
- FULVIC ACID CONSUMPTION IN METRIC TON, GLOBAL, 2017 - 2029
- Figure 43:
- FULVIC ACID CONSUMPTION IN USD, GLOBAL, 2017 - 2029
- Figure 44:
- FULVIC ACID CONSUMPTION VALUE BY CROP TYPE IN %, GLOBAL, 2022 VS 2029
- Figure 45:
- HUMIC ACID CONSUMPTION IN METRIC TON, GLOBAL, 2017 - 2029
- Figure 46:
- HUMIC ACID CONSUMPTION IN USD, GLOBAL, 2017 - 2029
- Figure 47:
- HUMIC ACID CONSUMPTION VALUE BY CROP TYPE IN %, GLOBAL, 2022 VS 2029
- Figure 48:
- PROTEIN HYDROLYSATES CONSUMPTION IN METRIC TON, GLOBAL, 2017 - 2029
- Figure 49:
- PROTEIN HYDROLYSATES CONSUMPTION IN USD, GLOBAL, 2017 - 2029
- Figure 50:
- PROTEIN HYDROLYSATES CONSUMPTION VALUE BY CROP TYPE IN %, GLOBAL, 2022 VS 2029
- Figure 51:
- SEAWEED EXTRACTS CONSUMPTION IN METRIC TON, GLOBAL, 2017 - 2029
- Figure 52:
- SEAWEED EXTRACTS CONSUMPTION IN USD, GLOBAL, 2017 - 2029
- Figure 53:
- SEAWEED EXTRACTS CONSUMPTION VALUE BY CROP TYPE IN %, GLOBAL, 2022 VS 2029
- Figure 54:
- OTHER BIOSTIMULANTS CONSUMPTION IN METRIC TON, GLOBAL, 2017 - 2029
- Figure 55:
- OTHER BIOSTIMULANTS CONSUMPTION IN USD, GLOBAL, 2017 - 2029
- Figure 56:
- OTHER BIOSTIMULANTS CONSUMPTION VALUE BY CROP TYPE IN %, GLOBAL, 2022 VS 2029
- Figure 57:
- ORGANIC FERTILIZER CONSUMPTION IN METRIC TON, GLOBAL, 2017 - 2029
- Figure 58:
- ORGANIC FERTILIZER CONSUMPTION IN USD, GLOBAL, 2017 - 2029
- Figure 59:
- ORGANIC FERTILIZER CONSUMPTION VOLUME BY FORM IN %, GLOBAL, 2017 VS 2023 VS 2029
- Figure 60:
- ORGANIC FERTILIZER CONSUMPTION VALUE BY FORM IN %, GLOBAL, 2017 VS 2023 VS 2029
- Figure 61:
- MANURE CONSUMPTION IN METRIC TON, GLOBAL, 2017 - 2029
- Figure 62:
- MANURE CONSUMPTION IN USD, GLOBAL, 2017 - 2029
- Figure 63:
- MANURE CONSUMPTION VALUE BY CROP TYPE IN %, GLOBAL, 2022 VS 2029
- Figure 64:
- MEAL BASED FERTILIZERS CONSUMPTION IN METRIC TON, GLOBAL, 2017 - 2029
- Figure 65:
- MEAL BASED FERTILIZERS CONSUMPTION IN USD, GLOBAL, 2017 - 2029
- Figure 66:
- MEAL BASED FERTILIZERS CONSUMPTION VALUE BY CROP TYPE IN %, GLOBAL, 2022 VS 2029
- Figure 67:
- OILCAKES CONSUMPTION IN METRIC TON, GLOBAL, 2017 - 2029
- Figure 68:
- OILCAKES CONSUMPTION IN USD, GLOBAL, 2017 - 2029
- Figure 69:
- OILCAKES CONSUMPTION VALUE BY CROP TYPE IN %, GLOBAL, 2022 VS 2029
- Figure 70:
- OTHER ORGANIC FERTILIZERS CONSUMPTION IN METRIC TON, GLOBAL, 2017 - 2029
- Figure 71:
- OTHER ORGANIC FERTILIZERS CONSUMPTION IN USD, GLOBAL, 2017 - 2029
- Figure 72:
- OTHER ORGANIC FERTILIZERS CONSUMPTION VALUE BY CROP TYPE IN %, GLOBAL, 2022 VS 2029
- Figure 73:
- CROP PROTECTION CONSUMPTION BY TYPE IN METRIC TON, GLOBAL, 2017 - 2029
- Figure 74:
- CROP PROTECTION CONSUMPTION BY TYPE IN USD, GLOBAL, 2017 - 2029
- Figure 75:
- CROP PROTECTION CONSUMPTION VOLUME BY TYPE IN %, GLOBAL, 2017 VS 2023 VS 2029
- Figure 76:
- CROP PROTECTION CONSUMPTION VALUE BY TYPE IN %, GLOBAL, 2017 VS 2023 VS 2029
- Figure 77:
- BIOCONTROL AGENTS CONSUMPTION IN GRAM, GLOBAL, 2017 - 2029
- Figure 78:
- BIOCONTROL AGENTS CONSUMPTION IN USD, GLOBAL, 2017 - 2029
- Figure 79:
- BIOCONTROL AGENTS CONSUMPTION VOLUME BY FORM IN %, GLOBAL, 2017 VS 2023 VS 2029
- Figure 80:
- BIOCONTROL AGENTS CONSUMPTION VALUE BY FORM IN %, GLOBAL, 2017 VS 2023 VS 2029
- Figure 81:
- MACROBIALS CONSUMPTION IN GRAM, GLOBAL, 2017 - 2029
- Figure 82:
- MACROBIALS CONSUMPTION IN USD, GLOBAL, 2017 - 2029
- Figure 83:
- MACROBIALS CONSUMPTION VALUE BY CROP TYPE IN %, GLOBAL, 2022 VS 2029
- Figure 84:
- MICROBIALS CONSUMPTION IN GRAM, GLOBAL, 2017 - 2029
- Figure 85:
- MICROBIALS CONSUMPTION IN USD, GLOBAL, 2017 - 2029
- Figure 86:
- MICROBIALS CONSUMPTION VALUE BY CROP TYPE IN %, GLOBAL, 2022 VS 2029
- Figure 87:
- BIOPESTICIDES CONSUMPTION IN METRIC TON, GLOBAL, 2017 - 2029
- Figure 88:
- BIOPESTICIDES CONSUMPTION IN USD, GLOBAL, 2017 - 2029
- Figure 89:
- BIOPESTICIDES CONSUMPTION VOLUME BY FORM IN %, GLOBAL, 2017 VS 2023 VS 2029
- Figure 90:
- BIOPESTICIDES CONSUMPTION VALUE BY FORM IN %, GLOBAL, 2017 VS 2023 VS 2029
- Figure 91:
- BIOFUNGICIDES CONSUMPTION IN METRIC TON, GLOBAL, 2017 - 2029
- Figure 92:
- BIOFUNGICIDES CONSUMPTION IN USD, GLOBAL, 2017 - 2029
- Figure 93:
- BIOFUNGICIDES CONSUMPTION VALUE BY CROP TYPE IN %, GLOBAL, 2022 VS 2029
- Figure 94:
- BIOHERBICIDES CONSUMPTION IN METRIC TON, GLOBAL, 2017 - 2029
- Figure 95:
- BIOHERBICIDES CONSUMPTION IN USD, GLOBAL, 2017 - 2029
- Figure 96:
- BIOHERBICIDES CONSUMPTION VALUE BY CROP TYPE IN %, GLOBAL, 2022 VS 2029
- Figure 97:
- BIOINSECTICIDES CONSUMPTION IN METRIC TON, GLOBAL, 2017 - 2029
- Figure 98:
- BIOINSECTICIDES CONSUMPTION IN USD, GLOBAL, 2017 - 2029
- Figure 99:
- BIOINSECTICIDES CONSUMPTION VALUE BY CROP TYPE IN %, GLOBAL, 2022 VS 2029
- Figure 100:
- OTHER BIOPESTICIDES CONSUMPTION IN METRIC TON, GLOBAL, 2017 - 2029
- Figure 101:
- OTHER BIOPESTICIDES CONSUMPTION IN USD, GLOBAL, 2017 - 2029
- Figure 102:
- OTHER BIOPESTICIDES CONSUMPTION VALUE BY CROP TYPE IN %, GLOBAL, 2022 VS 2029
- Figure 103:
- ORGANIC FERTILIZER CONSUMPTION IN METRIC TON, GLOBAL, 2017 - 2029
- Figure 104:
- ORGANIC FERTILIZER CONSUMPTION IN USD, GLOBAL, 2017 - 2029
- Figure 105:
- ORGANIC FERTILIZER CONSUMPTION VOLUME BY CROP TYPE IN %, GLOBAL, 2017 VS 2023 VS 2029
- Figure 106:
- ORGANIC FERTILIZER CONSUMPTION VALUE BY CROP TYPE IN %, GLOBAL, 2017 VS 2023 VS 2029
- Figure 107:
- ORGANIC FERTILIZER CONSUMPTION BY CASH CROPS IN METRIC TON, GLOBAL, 2017 - 2029
- Figure 108:
- ORGANIC FERTILIZER CONSUMPTION BY CASH CROPS IN USD, GLOBAL, 2017 - 2029
- Figure 109:
- ORGANIC FERTILIZER CONSUMPTION VALUE BY FUNCTION IN %, GLOBAL, 2022 VS 2029
- Figure 110:
- ORGANIC FERTILIZER CONSUMPTION BY HORTICULTURAL CROPS IN METRIC TON, GLOBAL, 2017 - 2029
- Figure 111:
- ORGANIC FERTILIZER CONSUMPTION BY HORTICULTURAL CROPS IN USD, GLOBAL, 2017 - 2029
- Figure 112:
- ORGANIC FERTILIZER CONSUMPTION VALUE BY FUNCTION IN %, GLOBAL, 2022 VS 2029
- Figure 113:
- ORGANIC FERTILIZER CONSUMPTION BY ROW CROPS IN METRIC TON, GLOBAL, 2017 - 2029
- Figure 114:
- ORGANIC FERTILIZER CONSUMPTION BY ROW CROPS IN USD, GLOBAL, 2017 - 2029
- Figure 115:
- ORGANIC FERTILIZER CONSUMPTION VALUE BY FUNCTION IN %, GLOBAL, 2022 VS 2029
- Figure 116:
- ORGANIC FERTILIZER CONSUMPTION IN METRIC TON, GLOBAL, 2017 - 2029
- Figure 117:
- ORGANIC FERTILIZER CONSUMPTION IN USD, GLOBAL, 2017 - 2029
- Figure 118:
- ORGANIC FERTILIZER CONSUMPTION VOLUME BY REGION IN %, GLOBAL, 2017 VS 2023 VS 2029
- Figure 119:
- ORGANIC FERTILIZER CONSUMPTION VALUE BY REGION IN %, GLOBAL, 2017 VS 2023 VS 2029
- Figure 120:
- ORGANIC FERTILIZER CONSUMPTION IN METRIC TON, AFRICA, 2017 - 2029
- Figure 121:
- ORGANIC FERTILIZER CONSUMPTION IN USD, AFRICA, 2017 - 2029
- Figure 122:
- ORGANIC FERTILIZER CONSUMPTION VOLUME BY COUNTRY IN %, AFRICA, 2017 VS 2023 VS 2029
- Figure 123:
- ORGANIC FERTILIZER CONSUMPTION VALUE BY COUNTRY IN %, AFRICA, 2017 VS 2023 VS 2029
- Figure 124:
- ORGANIC FERTILIZER CONSUMPTION IN METRIC TON, EGYPT, 2017 - 2029
- Figure 125:
- ORGANIC FERTILIZER CONSUMPTION IN USD, EGYPT, 2017 - 2029
- Figure 126:
- ORGANIC FERTILIZER CONSUMPTION VALUE BY FUNCTION IN %, EGYPT, 2022 VS 2029
- Figure 127:
- ORGANIC FERTILIZER CONSUMPTION IN METRIC TON, NIGERIA, 2017 - 2029
- Figure 128:
- ORGANIC FERTILIZER CONSUMPTION IN USD, NIGERIA, 2017 - 2029
- Figure 129:
- ORGANIC FERTILIZER CONSUMPTION VALUE BY FUNCTION IN %, NIGERIA, 2022 VS 2029
- Figure 130:
- ORGANIC FERTILIZER CONSUMPTION IN METRIC TON, SOUTH AFRICA, 2017 - 2029
- Figure 131:
- ORGANIC FERTILIZER CONSUMPTION IN USD, SOUTH AFRICA, 2017 - 2029
- Figure 132:
- ORGANIC FERTILIZER CONSUMPTION VALUE BY FUNCTION IN %, SOUTH AFRICA, 2022 VS 2029
- Figure 133:
- ORGANIC FERTILIZER CONSUMPTION IN METRIC TON, REST OF AFRICA, 2017 - 2029
- Figure 134:
- ORGANIC FERTILIZER CONSUMPTION IN USD, REST OF AFRICA, 2017 - 2029
- Figure 135:
- ORGANIC FERTILIZER CONSUMPTION VALUE BY FUNCTION IN %, REST OF AFRICA, 2022 VS 2029
- Figure 136:
- ORGANIC FERTILIZER CONSUMPTION IN METRIC TON, ASIA-PACIFIC, 2017 - 2029
- Figure 137:
- ORGANIC FERTILIZER CONSUMPTION IN USD, ASIA-PACIFIC, 2017 - 2029
- Figure 138:
- ORGANIC FERTILIZER CONSUMPTION VOLUME BY COUNTRY IN %, ASIA-PACIFIC, 2017 VS 2023 VS 2029
- Figure 139:
- ORGANIC FERTILIZER CONSUMPTION VALUE BY COUNTRY IN %, ASIA-PACIFIC, 2017 VS 2023 VS 2029
- Figure 140:
- ORGANIC FERTILIZER CONSUMPTION IN METRIC TON, AUSTRALIA, 2017 - 2029
- Figure 141:
- ORGANIC FERTILIZER CONSUMPTION IN USD, AUSTRALIA, 2017 - 2029
- Figure 142:
- ORGANIC FERTILIZER CONSUMPTION VALUE BY FUNCTION IN %, AUSTRALIA, 2022 VS 2029
- Figure 143:
- ORGANIC FERTILIZER CONSUMPTION IN METRIC TON, CHINA, 2017 - 2029
- Figure 144:
- ORGANIC FERTILIZER CONSUMPTION IN USD, CHINA, 2017 - 2029
- Figure 145:
- ORGANIC FERTILIZER CONSUMPTION VALUE BY FUNCTION IN %, CHINA, 2022 VS 2029
- Figure 146:
- ORGANIC FERTILIZER CONSUMPTION IN METRIC TON, INDIA, 2017 - 2029
- Figure 147:
- ORGANIC FERTILIZER CONSUMPTION IN USD, INDIA, 2017 - 2029
- Figure 148:
- ORGANIC FERTILIZER CONSUMPTION VALUE BY FUNCTION IN %, INDIA, 2022 VS 2029
- Figure 149:
- ORGANIC FERTILIZER CONSUMPTION IN METRIC TON, INDONESIA, 2017 - 2029
- Figure 150:
- ORGANIC FERTILIZER CONSUMPTION IN USD, INDONESIA, 2017 - 2029
- Figure 151:
- ORGANIC FERTILIZER CONSUMPTION VALUE BY FUNCTION IN %, INDONESIA, 2022 VS 2029
- Figure 152:
- ORGANIC FERTILIZER CONSUMPTION IN METRIC TON, JAPAN, 2017 - 2029
- Figure 153:
- ORGANIC FERTILIZER CONSUMPTION IN USD, JAPAN, 2017 - 2029
- Figure 154:
- ORGANIC FERTILIZER CONSUMPTION VALUE BY FUNCTION IN %, JAPAN, 2022 VS 2029
- Figure 155:
- ORGANIC FERTILIZER CONSUMPTION IN METRIC TON, PHILIPPINES, 2017 - 2029
- Figure 156:
- ORGANIC FERTILIZER CONSUMPTION IN USD, PHILIPPINES, 2017 - 2029
- Figure 157:
- ORGANIC FERTILIZER CONSUMPTION VALUE BY FUNCTION IN %, PHILIPPINES, 2022 VS 2029
- Figure 158:
- ORGANIC FERTILIZER CONSUMPTION IN METRIC TON, THAILAND, 2017 - 2029
- Figure 159:
- ORGANIC FERTILIZER CONSUMPTION IN USD, THAILAND, 2017 - 2029
- Figure 160:
- ORGANIC FERTILIZER CONSUMPTION VALUE BY FUNCTION IN %, THAILAND, 2022 VS 2029
- Figure 161:
- ORGANIC FERTILIZER CONSUMPTION IN METRIC TON, VIETNAM, 2017 - 2029
- Figure 162:
- ORGANIC FERTILIZER CONSUMPTION IN USD, VIETNAM, 2017 - 2029
- Figure 163:
- ORGANIC FERTILIZER CONSUMPTION VALUE BY FUNCTION IN %, VIETNAM, 2022 VS 2029
- Figure 164:
- ORGANIC FERTILIZER CONSUMPTION IN METRIC TON, REST OF ASIA-PACIFIC, 2017 - 2029
- Figure 165:
- ORGANIC FERTILIZER CONSUMPTION IN USD, REST OF ASIA-PACIFIC, 2017 - 2029
- Figure 166:
- ORGANIC FERTILIZER CONSUMPTION VALUE BY FUNCTION IN %, REST OF ASIA-PACIFIC, 2022 VS 2029
- Figure 167:
- ORGANIC FERTILIZER CONSUMPTION IN METRIC TON, EUROPE, 2017 - 2029
- Figure 168:
- ORGANIC FERTILIZER CONSUMPTION IN USD, EUROPE, 2017 - 2029
- Figure 169:
- ORGANIC FERTILIZER CONSUMPTION VOLUME BY COUNTRY IN %, EUROPE, 2017 VS 2023 VS 2029
- Figure 170:
- ORGANIC FERTILIZER CONSUMPTION VALUE BY COUNTRY IN %, EUROPE, 2017 VS 2023 VS 2029
- Figure 171:
- ORGANIC FERTILIZER CONSUMPTION IN METRIC TON, FRANCE, 2017 - 2029
- Figure 172:
- ORGANIC FERTILIZER CONSUMPTION IN USD, FRANCE, 2017 - 2029
- Figure 173:
- ORGANIC FERTILIZER CONSUMPTION VALUE BY FUNCTION IN %, FRANCE, 2022 VS 2029
- Figure 174:
- ORGANIC FERTILIZER CONSUMPTION IN METRIC TON, GERMANY, 2017 - 2029
- Figure 175:
- ORGANIC FERTILIZER CONSUMPTION IN USD, GERMANY, 2017 - 2029
- Figure 176:
- ORGANIC FERTILIZER CONSUMPTION VALUE BY FUNCTION IN %, GERMANY, 2022 VS 2029
- Figure 177:
- ORGANIC FERTILIZER CONSUMPTION IN METRIC TON, ITALY, 2017 - 2029
- Figure 178:
- ORGANIC FERTILIZER CONSUMPTION IN USD, ITALY, 2017 - 2029
- Figure 179:
- ORGANIC FERTILIZER CONSUMPTION VALUE BY FUNCTION IN %, ITALY, 2022 VS 2029
- Figure 180:
- ORGANIC FERTILIZER CONSUMPTION IN METRIC TON, NETHERLANDS, 2017 - 2029
- Figure 181:
- ORGANIC FERTILIZER CONSUMPTION IN USD, NETHERLANDS, 2017 - 2029
- Figure 182:
- ORGANIC FERTILIZER CONSUMPTION VALUE BY FUNCTION IN %, NETHERLANDS, 2022 VS 2029
- Figure 183:
- ORGANIC FERTILIZER CONSUMPTION IN METRIC TON, RUSSIA, 2017 - 2029
- Figure 184:
- ORGANIC FERTILIZER CONSUMPTION IN USD, RUSSIA, 2017 - 2029
- Figure 185:
- ORGANIC FERTILIZER CONSUMPTION VALUE BY FUNCTION IN %, RUSSIA, 2022 VS 2029
- Figure 186:
- ORGANIC FERTILIZER CONSUMPTION IN METRIC TON, SPAIN, 2017 - 2029
- Figure 187:
- ORGANIC FERTILIZER CONSUMPTION IN USD, SPAIN, 2017 - 2029
- Figure 188:
- ORGANIC FERTILIZER CONSUMPTION VALUE BY FUNCTION IN %, SPAIN, 2022 VS 2029
- Figure 189:
- ORGANIC FERTILIZER CONSUMPTION IN METRIC TON, TURKEY, 2017 - 2029
- Figure 190:
- ORGANIC FERTILIZER CONSUMPTION IN USD, TURKEY, 2017 - 2029
- Figure 191:
- ORGANIC FERTILIZER CONSUMPTION VALUE BY FUNCTION IN %, TURKEY, 2022 VS 2029
- Figure 192:
- ORGANIC FERTILIZER CONSUMPTION IN METRIC TON, UNITED KINGDOM, 2017 - 2029
- Figure 193:
- ORGANIC FERTILIZER CONSUMPTION IN USD, UNITED KINGDOM, 2017 - 2029
- Figure 194:
- ORGANIC FERTILIZER CONSUMPTION VALUE BY FUNCTION IN %, UNITED KINGDOM, 2022 VS 2029
- Figure 195:
- ORGANIC FERTILIZER CONSUMPTION IN METRIC TON, REST OF EUROPE, 2017 - 2029
- Figure 196:
- ORGANIC FERTILIZER CONSUMPTION IN USD, REST OF EUROPE, 2017 - 2029
- Figure 197:
- ORGANIC FERTILIZER CONSUMPTION VALUE BY FUNCTION IN %, REST OF EUROPE, 2022 VS 2029
- Figure 198:
- ORGANIC FERTILIZER CONSUMPTION IN METRIC TON, MIDDLE EAST, 2017 - 2029
- Figure 199:
- ORGANIC FERTILIZER CONSUMPTION IN USD, MIDDLE EAST, 2017 - 2029
- Figure 200:
- ORGANIC FERTILIZER CONSUMPTION VOLUME BY COUNTRY IN %, MIDDLE EAST, 2017 VS 2023 VS 2029
- Figure 201:
- ORGANIC FERTILIZER CONSUMPTION VALUE BY COUNTRY IN %, MIDDLE EAST, 2017 VS 2023 VS 2029
- Figure 202:
- ORGANIC FERTILIZER CONSUMPTION IN METRIC TON, IRAN, 2017 - 2029
- Figure 203:
- ORGANIC FERTILIZER CONSUMPTION IN USD, IRAN, 2017 - 2029
- Figure 204:
- ORGANIC FERTILIZER CONSUMPTION VALUE BY FUNCTION IN %, IRAN, 2022 VS 2029
- Figure 205:
- ORGANIC FERTILIZER CONSUMPTION IN METRIC TON, SAUDI ARABIA, 2017 - 2029
- Figure 206:
- ORGANIC FERTILIZER CONSUMPTION IN USD, SAUDI ARABIA, 2017 - 2029
- Figure 207:
- ORGANIC FERTILIZER CONSUMPTION VALUE BY FUNCTION IN %, SAUDI ARABIA, 2022 VS 2029
- Figure 208:
- ORGANIC FERTILIZER CONSUMPTION IN METRIC TON, REST OF MIDDLE EAST, 2017 - 2029
- Figure 209:
- ORGANIC FERTILIZER CONSUMPTION IN USD, REST OF MIDDLE EAST, 2017 - 2029
- Figure 210:
- ORGANIC FERTILIZER CONSUMPTION VALUE BY FUNCTION IN %, REST OF MIDDLE EAST, 2022 VS 2029
- Figure 211:
- ORGANIC FERTILIZER CONSUMPTION IN METRIC TON, NORTH AMERICA, 2017 - 2029
- Figure 212:
- ORGANIC FERTILIZER CONSUMPTION IN USD, NORTH AMERICA, 2017 - 2029
- Figure 213:
- ORGANIC FERTILIZER CONSUMPTION VOLUME BY COUNTRY IN %, NORTH AMERICA, 2017 VS 2023 VS 2029
- Figure 214:
- ORGANIC FERTILIZER CONSUMPTION VALUE BY COUNTRY IN %, NORTH AMERICA, 2017 VS 2023 VS 2029
- Figure 215:
- ORGANIC FERTILIZER CONSUMPTION IN METRIC TON, CANADA, 2017 - 2029
- Figure 216:
- ORGANIC FERTILIZER CONSUMPTION IN USD, CANADA, 2017 - 2029
- Figure 217:
- ORGANIC FERTILIZER CONSUMPTION VALUE BY FUNCTION IN %, CANADA, 2022 VS 2029
- Figure 218:
- ORGANIC FERTILIZER CONSUMPTION IN METRIC TON, MEXICO, 2017 - 2029
- Figure 219:
- ORGANIC FERTILIZER CONSUMPTION IN USD, MEXICO, 2017 - 2029
- Figure 220:
- ORGANIC FERTILIZER CONSUMPTION VALUE BY FUNCTION IN %, MEXICO, 2022 VS 2029
- Figure 221:
- ORGANIC FERTILIZER CONSUMPTION IN METRIC TON, UNITED STATES, 2017 - 2029
- Figure 222:
- ORGANIC FERTILIZER CONSUMPTION IN USD, UNITED STATES, 2017 - 2029
- Figure 223:
- ORGANIC FERTILIZER CONSUMPTION VALUE BY FUNCTION IN %, UNITED STATES, 2022 VS 2029
- Figure 224:
- ORGANIC FERTILIZER CONSUMPTION IN METRIC TON, REST OF NORTH AMERICA, 2017 - 2029
- Figure 225:
- ORGANIC FERTILIZER CONSUMPTION IN USD, REST OF NORTH AMERICA, 2017 - 2029
- Figure 226:
- ORGANIC FERTILIZER CONSUMPTION VALUE BY FUNCTION IN %, REST OF NORTH AMERICA, 2022 VS 2029
- Figure 227:
- ORGANIC FERTILIZER CONSUMPTION IN METRIC TON, SOUTH AMERICA, 2017 - 2029
- Figure 228:
- ORGANIC FERTILIZER CONSUMPTION IN USD, SOUTH AMERICA, 2017 - 2029
- Figure 229:
- ORGANIC FERTILIZER CONSUMPTION VOLUME BY COUNTRY IN %, SOUTH AMERICA, 2017 VS 2023 VS 2029
- Figure 230:
- ORGANIC FERTILIZER CONSUMPTION VALUE BY COUNTRY IN %, SOUTH AMERICA, 2017 VS 2023 VS 2029
- Figure 231:
- ORGANIC FERTILIZER CONSUMPTION IN METRIC TON, ARGENTINA, 2017 - 2029
- Figure 232:
- ORGANIC FERTILIZER CONSUMPTION IN USD, ARGENTINA, 2017 - 2029
- Figure 233:
- ORGANIC FERTILIZER CONSUMPTION VALUE BY FUNCTION IN %, ARGENTINA, 2022 VS 2029
- Figure 234:
- ORGANIC FERTILIZER CONSUMPTION IN METRIC TON, BRAZIL, 2017 - 2029
- Figure 235:
- ORGANIC FERTILIZER CONSUMPTION IN USD, BRAZIL, 2017 - 2029
- Figure 236:
- ORGANIC FERTILIZER CONSUMPTION VALUE BY FUNCTION IN %, BRAZIL, 2022 VS 2029
- Figure 237:
- ORGANIC FERTILIZER CONSUMPTION IN METRIC TON, REST OF SOUTH AMERICA, 2017 - 2029
- Figure 238:
- ORGANIC FERTILIZER CONSUMPTION IN USD, REST OF SOUTH AMERICA, 2017 - 2029
- Figure 239:
- ORGANIC FERTILIZER CONSUMPTION VALUE BY FUNCTION IN %, REST OF SOUTH AMERICA, 2022 VS 2029
- Figure 240:
- GLOBAL AGRICULTURAL BIOLOGICALS MARKET, MOST ACTIVE COMPANIES, BY NUMBER OF STRATEGIC MOVES, 2017-2022
- Figure 241:
- GLOBAL AGRICULTURAL BIOLOGICALS MARKET, MOST ADOPTED STRATEGIES, 2017-2022
- Figure 242:
- GLOBAL AGRICULTURAL BIOLOGICALS MARKET SHARE(%), BY MAJOR PLAYERS
Agricultural Biologicals Industry Segmentation
Crop Nutrition, Crop Protection are covered as segments by Function. Cash Crops, Horticultural Crops, Row Crops are covered as segments by Crop Type. Africa, Asia-Pacific, Europe, Middle East, North America, South America are covered as segments by Region.| Function | Crop Nutrition | Biofertilizer | Azospirillum | |
| Azotobacter | ||||
| Mycorrhiza | ||||
| Phosphate Solubilizing Bacteria | ||||
| Rhizobium | ||||
| Other Biofertilizers | ||||
| Biostimulants | Amino Acids | |||
| Fulvic Acid | ||||
| Humic Acid | ||||
| Protein Hydrolysates | ||||
| Seaweed Extracts | ||||
| Other Biostimulants | ||||
| Organic Fertilizer | Manure | |||
| Meal Based Fertilizers | ||||
| Oilcakes | ||||
| Other Organic Fertilizers | ||||
| Crop Protection | Biocontrol Agents | Macrobials | ||
| Microbials | ||||
| Biopesticides | Biofungicides | |||
| Bioherbicides | ||||
| Bioinsecticides | ||||
| Other Biopesticides | ||||
| Crop Type | Cash Crops | |||
| Horticultural Crops | ||||
| Row Crops | ||||
| Region | Africa | Egypt | ||
| Nigeria | ||||
| South Africa | ||||
| Rest of Africa | ||||
| Asia-Pacific | Australia | |||
| China | ||||
| India | ||||
| Indonesia | ||||
| Japan | ||||
| Philippines | ||||
| Thailand | ||||
| Vietnam | ||||
| Rest of Asia-Pacific | ||||
| Europe | France | |||
| Germany | ||||
| Italy | ||||
| Netherlands | ||||
| Russia | ||||
| Spain | ||||
| Turkey | ||||
| United Kingdom | ||||
| Rest of Europe | ||||
| Middle East | Iran | |||
| Saudi Arabia | ||||
| Rest of Middle East | ||||
| North America | Canada | |||
| Mexico | ||||
| United States | ||||
| Rest of North America | ||||
| South America | Argentina | |||
| Brazil | ||||
| Rest of South America | ||||
Need A Different Region or Segment?
Customize Now
Market Definition
- AVERAGE DOSAGE RATE - The average application rate is the average volume of agricultural biologicals applied per hectare of farmland in the respective region/country.
- CROP TYPE - Crop type includes Row crops (Cereals, Pulses, Oilseeds), Horticultural Crops (Fruits and vegetables) and Cash Crops (Plantation Crops, Fibre Crops and Other Industrial Crops)
- FUNCTION - Agricultural biological products provide crops with essential nutrients, prevent or control abiotic & biotic stresses, and enhance soil quality.
- TYPE - The Crop Nutrition function of agricultural biologicals includes organic fertilizer and Biofertilizer, whereas the Crop Protection function includes Biostimulants, Biopesticides and Biocontrol Agents.
| Keyword | Definition |
|---|---|
| Cash Crops | Cash crops are non-consumable crops sold as a whole or part of the crop to manufacture end-products to make a profit. |
| Integrated Pest Management (IPM) | IPM is an environment-friendly and sustainable approach to control pests in various crops. It involves a combination of methods, including biological controls, cultural practices, and selective use of pesticides. |
| Bacterial biocontrol agents | Bacteria used to control pests and diseases in crops. They work by producing toxins harmful to the target pests or competing with them for nutrients and space in the growing environment. Some examples of commonly used bacterial biocontrol agents include Bacillus thuringiensis (Bt), Pseudomonas fluorescens, and Streptomyces spp. |
| Plant Protection Product (PPP) | A plant protection product is a formulation applied to crops to protect from pests, such as weeds, diseases, or insects. They contain one or more active substances with other co-formulants such as solvents, carriers, inert material, wetting agents or adjuvants formulated to give optimum product efficacy. |
| Pathogen | A pathogen is an organism causing disease to its host, with the severity of the disease symptoms. |
| Parasitoids | Parasitoids are insects that lay their eggs on or within the host insect, with their larvae feeding on the host insect. In agriculture, parasitoids can be used as a form of biological pest control, as they help to control pest damage to crops and decrease the need for chemical pesticides. |
| Entomopathogenic Nematodes (EPN) | Entomopathogenic nematodes are parasitic roundworms that infect and kill pests by releasing bacteria from their gut. Entomopathogenic nematodes are a form of biocontrol agents used in agriculture. |
| Vesicular-arbuscular mycorrhiza (VAM) | VAM fungi are mycorrhizal species of fungus. They live in the roots of different higher-order plants. They develop a symbiotic relationship with the plants in the roots of these plants. |
| Fungal biocontrol agents | Fungal biocontrol agents are the beneficial fungi that control plant pests and diseases. They are an alternative to chemical pesticides. They infect and kill the pests or compete with pathogenic fungi for nutrients and space. |
| Biofertilizers | Biofertilizers contain beneficial microorganisms that enhance soil fertility and promote plant growth. |
| Biopesticides | Biopesticides are natural/bio-based compounds used to manage agricultural pests using specific biological effects. |
| Predators | Predators in agriculture are the organisms that feed on pests and help control pest damage to the crops. Some common predator species used in agriculture include ladybugs, lacewings, and predatory mites. |
| Biocontrol agents | Biocontrol agents are living organisms used to control pests and diseases in agriculture. They are alternatives to chemical pesticides and are known for their lesser impact on the environment and human health. |
| Organic Fertilizers | Organic fertilizer is composed of animal or vegetable matter used alone or in combination with one or more non-synthetically derived elements or compounds used for soil fertility and plant growth. |
| Protein hydrolysates (PHs) | Protein hydrolysate-based biostimulants contain free amino acids, oligopeptides, and polypeptides produced by enzymatic or chemical hydrolysis of proteins, primarily from vegetal or animal sources. |
| Biostimulants/Plant Growth Regulators (PGR) | Biostimulants/Plant Growth Regulators (PGR) are substances derived from natural resources to enhance plant growth and health by stimulating plant processes (metabolism). |
| Soil Amendments | Soil Amendments are substances applied to soil that improve soil health, such as soil fertility and soil structure. |
| Seaweed Extract | Seaweed extracts are rich in micro and macronutrients, proteins, polysaccharides, polyphenols, phytohormones, and osmolytes. These substances boost seed germination and crop establishment, total plant growth and productivity. |
| Compounds related to biocontrol and/or promoting growth (CRBPG) | Compounds related to biocontrol or promoting growth (CRBPG) are the ability of a bacteria to produce compounds for phytopathogen biocontrol and plant growth promotion. |
| Symbiotic Nitrogen-Fixing Bacteria | Symbiotic nitrogen-fixing bacteria such as Rhizobium obtain food and shelter from the host, and in return, they help by providing fixed nitrogen to the plants. |
| Nitrogen Fixation | Nitrogen fixation is a chemical process in soil which converts molecular nitrogen into ammonia or related nitrogenous compounds. |
| ARS (Agricultural Research Service) | ARS is the U.S. Department of Agriculture's chief scientific in-house research agency. It aims to find solutions to agricultural problems faced by the farmers in the country. |
| Phytosanitary Regulations | Phytosanitary regulations imposed by the respective government bodies check or prohibit the importation and marketing of certain insects, plant species, or products of these plants to prevent the introduction or spread of new plant pests or pathogens. |
| Ectomycorrhizae (ECM) | Ectomycorrhiza (ECM) is a symbiotic interaction of fungi with the feeder roots of higher plants in which both the plant and the fungi benefit through the association for survival. |
Need More Details on Market Definition?
Ask a Question
Research Methodology
Mordor Intelligence follows a four-step methodology in all our reports.
- Step-1: Identify Key Variables: In order to build a robust forecasting methodology, the variables and factors identified in Step-1 are tested against available historical market numbers. Through an iterative process, the variables required for market forecast are set and the model is built on the basis of these variables.
- Step-2: Build a Market Model: Market-size estimations for the forecast years are in nominal terms. Inflation is not a part of the pricing, and the average selling price (ASP) is kept constant throughout the forecast period.
- Step-3: Validate and Finalize: In this important step, all market numbers, variables and analyst calls are validated through an extensive network of primary research experts from the market studied. The respondents are selected across levels and functions to generate a holistic picture of the market studied.
- Step-4: Research Outputs: Syndicated Reports, Custom Consulting Assignments, Databases & Subscription Platforms.

Get More Details On Research Methodology
Download PDF


