
Foot and Ankle Devices Market Size and Share
Market Overview
| Study Period | 2021 - 2032 |
|---|---|
| Market Size (2027) | USD 6.28 Billion |
| Market Size (2032) | USD 8.85 Billion |
| Growth Rate (2027 - 2032) | 7.09 % |
| Fastest Growing Market | Asia Pacific |
| Largest Market | North America |
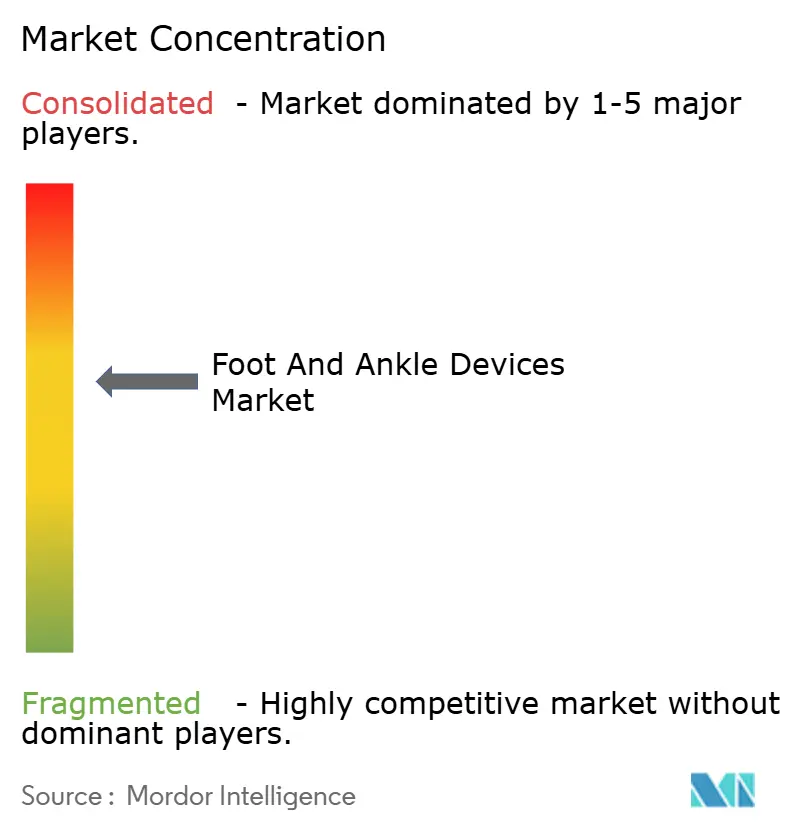
| Market Concentration | Medium |
Major Players *Disclaimer: Major Players sorted in no particular order Image © Mordor Intelligence. Reuse requires attribution under CC BY 4.0. | |
Foot and Ankle Devices Market Analysis by Mordor Intelligence
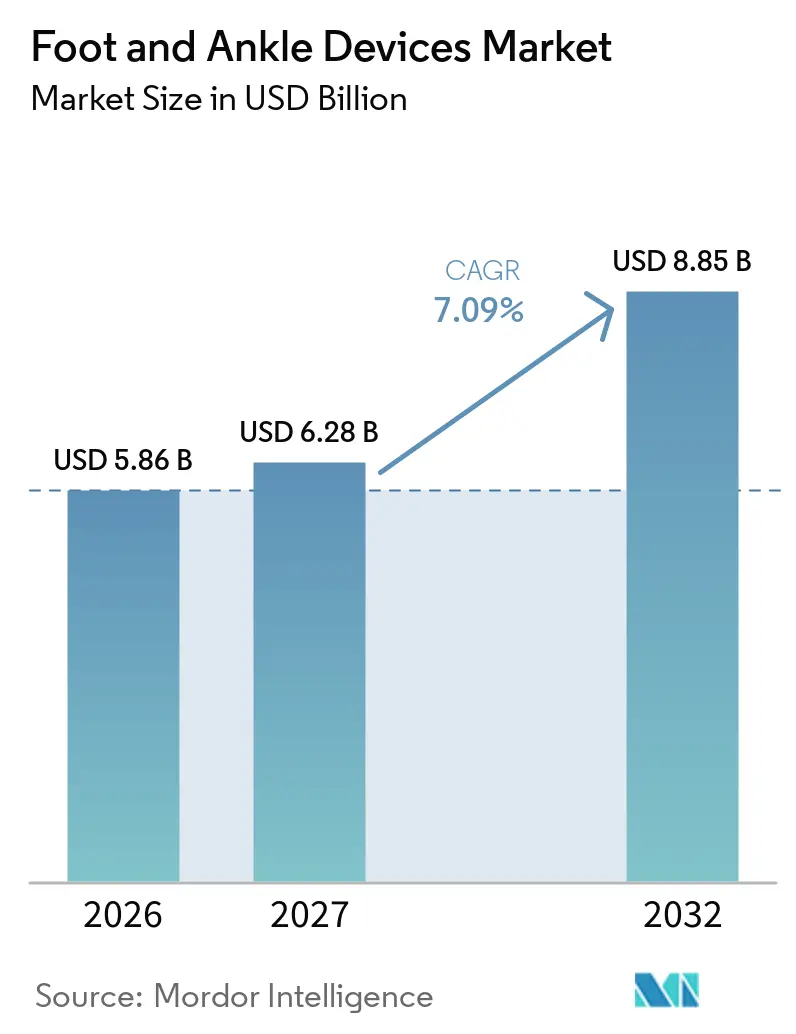
The Foot and Ankle Devices Market size was valued at USD 5.86 billion in 2026 and is estimated to grow from USD 6.28 billion in 2027 to reach USD 8.85 billion by 2032, at a CAGR of 7.09% during the forecast period (2027-2032).
Ambulatory surgery centers are absorbing elective reconstructions at scale, specialty clinics are adding in-house operating suites, and smart implants are entering routine use. Microprocessor-controlled prostheses, patient-matched fixation hardware, and porous 3D-printed fusion cages shorten operating time while raising procedural accuracy. Demographic aging in Asia-Pacific, the diabetes surge in every region, and an uptick in high-energy trauma among younger cohorts sustain double-digit growth in reconstructive and fracture care volumes. Competitive intensity is increasing as niche specialists convert focused R&D into quick FDA clearances, forcing diversified majors to accelerate additive manufacturing and digital-surgery programs.
Key Report Takeaways
- By product type, prostheses commanded 32.8% of the foot and ankle devices market share in 2026 and are projected to lead growth at a 9.5% CAGR through 2032.
- By application, trauma and fractures accounted for 36.8% of the foot and ankle devices market in 2026, while diabetic foot disorders are forecast to grow at a 10.2% CAGR through 2032.
- By end user, specialty orthopedic and podiatric clinics captured the fastest expansion, advancing at a 10.4% CAGR over 2027-2032.
- By geography, North America held 43.21% of the ankle and foot devices market in 2026, whereas Asia is projected to grow the quickest with an 8.54% CAGR over the same period.
Note: Market numbers in this report are based on Mordor Intelligence's proprietary estimation framework, which combines nine months of actuals with Q4 projections for base year 2026.
Market Trends and Insights
Drivers Impact Analysis of Foot and Ankle Devices Market*
| Driver | (~) % Impact on CAGR Forecast | Geographic Relevance | Impact Timeline |
|---|---|---|---|
| Growing Surgical Volume From Trauma And Degenerative Conditions | +1.8% | North America and Europe lead; global relevance | Medium term (2-4 years) |
| Technological Advancements In Implant Materials And Digital Surgery | +1.5% | North America and EU mature; APAC catching up | Long term (≥ 4 years) |
| Migration Of Procedures To Ambulatory Surgery Centers | +1.2% | North America dominant; Australia and UK early movers | Short term (≤ 2 years) |
| Rising Global Geriatric And Obese Population | +1.4% | Core APAC, global spill-over | Long term (≥ 4 years) |
| Emergence Of Bio-Scaffold And Regenerative Solutions | +0.9% | U.S., EU clinical hubs; early uptake in Japan | Medium term (2-4 years) |
| Integration Of Smart Implants And Remote Monitoring | +1.0% | U.S. and Canada first adopters; gradual EU rollout | Long term (≥ 4 years) |
| Source: Mordor Intelligence | |||
Growing Surgical Volume from Trauma and Degenerative Conditions
Trauma and degenerative pathologies together drive more than half of all device demand, and fracture care alone represented 36.8% of 2025 applications. Vehicle collisions, sports injuries, and workplace accidents fuel high-energy ankle fractures in younger adults, while fragile bones amplify fracture rates in seniors living longer with osteoporosis. Surgeons increasingly favor minimally invasive fixation, locking plates, and revision-friendly nails that permit earlier weight bearing and faster rehabilitation. Registry data from 2025 confirmed that anatomic plating improved alignment and reduced nonunion rates compared with conventional constructs[1]. Launches such as Zimmer Biomet’s Gorilla Pilon Fusion Plating System illustrate how companies refine hardware geometry for comminuted injuries and arthrodesis requirements. The steady rise of joint-preserving options delays end-stage arthrodesis, enlarging the long-term procedure pool.
Technological Advancements in Implant Materials and Digital Surgery
Regulatory clarity for patient-matched implants is accelerating adoption of 3D-printed titanium and cobalt-chromium constructs that mirror a patient’s bone contours[2]. Porous lattices foster osseointegration, while single-use guides shave minutes off operative time. Clearance of Paragon 28’s APEX 3D Total Ankle System in 2024 validated the speed with which smaller firms can translate additive manufacturing into commercial products. Digital platforms overlay navigation cues in surgeons’ field of view; Johnson & Johnson’s VOLT mini plating system pairs with augmented-reality headsets to perfect screw trajectories. Sensor-enabled implants such as Canary Medical’s Canturio TE stream real-time load data to cloud dashboards, supporting tele-rehabilitation and early warning of loosening. Standardization bodies, notably ASTM F3001, now guide non-destructive testing routines that flag micro-porosity and prevent fatigue failure.
Migration of Procedures to Ambulatory Surgery Centers
Payer rule changes moved hip, knee, shoulder, and ankle procedures off inpatient-only lists, channeling cases to high-throughput ambulatory surgery centers. A 2025 Centers for Medicare & Medicaid Services review showed that outpatient joints accounted for more than 85% of total replacements in the United States, a pattern that also holds for elective hindfoot fusions. Lower overhead, tighter scheduling, and infection rates under 0.5% appeal to both surgeons and insurers. Device vendors respond with pre-sterilized implant sets and streamlined single-tray instrumentation that fit the ambulatory workflow. Specialty clinics, many physician-owned, reinvest procedural margins in on-site imaging and therapy, fueling a 10.4% CAGR through 2031 as they pull volume from hospitals.
Rising Global Geriatric and Obese Population
China expects 280 million citizens to be 60 years or older by 2025, and Japan already reports 28% of residents are above 65 years. The metabolic burden is rising in parallel: the International Diabetes Federation projects 783 million adults will live with diabetes by 2045, up from 578 million in 2025, and up to one-third risk chronic foot ulcers. Age and obesity degrade joint cartilage and elevate fracture risk, lifting surgical volumes for arthrodesis, arthroplasty, and complex fixation. Asia-Pacific hospitals investing in digital radiography and navigation under India’s 2025 Health Mission illustrate how emerging systems are scaling capacity. Device makers are tailoring portfolios, introducing lower-cost stainless constructions alongside premium titanium lines to address budget diversity without compromising outcomes.
Restraints Impact Analysis of Foot and Ankle Devices Market*
| Restraint | (~) % Impact on CAGR Forecast | Geographic Relevance | Impact Timeline |
|---|---|---|---|
| High Treatment Cost And Limited Reimbursement In Emerging Markets | -0.9% | APAC, MEA, South America | Medium term (2-4 years) |
| Stringent Global Regulatory And Post-Market Surveillance Requirements | -0.7% | EU leads, worldwide convergence | Long term (≥ 4 years) |
| Clinical Concerns Over Implant Longevity And Revision Risk | -0.8% | North America, Europe registries; global watch | Short term (≤ 2 years) |
| Manufacturing Quality Challenges In Additive And Customized Implants | -0.6% | Global, with focus on U.S. and EU regulators | Long term (≥ 4 years) |
| Source: Mordor Intelligence | |||
High Treatment Cost and Limited Reimbursement in Emerging Markets
Self-payment remains dominant in much of South Asia, Africa, and parts of Latin America, where per capita health outlays are below USD 600. Implant packages for total ankle arthroplasty can exceed USD 8,000 before facility and surgeon fees, pushing procedures out of reach for most households. India’s Ayushman Bharat scheme reimburses catastrophic care but caps implant pricing, compelling many patients to downgrade to basic stainless-steel systems or forgo surgery. Private insurance penetration below 5% across several emerging economies slows the uptake of premium prostheses and digital instrumentation. Tiered product families help vendors address cost pressure, but fragmented pricing complicates forecasting and inventory management.
Stringent Global Regulatory and Post-Market Surveillance Requirements
The European Union’s Medical Device Regulation, fully enforced in 2024, now requires longitudinal clinical evidence and real-time vigilance reporting for Class III implants. Notified-body audits, predicate gaps, and expanded labeling raise compliance expenses, delaying market entry—especially for start-ups. The U.S. FDA is tightening oversight of additive manufacturing, requiring validation of powder reuse and XCT imaging datasets for every 510(k) submission. Registries, such as the British Orthopaedic Foot & Ankle Society’s 2025 report, flagged specific prosthesis models with elevated loosening rates, illustrating how surveillance can prompt recalls. China and Japan are echoing the EU's evidentiary demands, creating multilayered regulatory hurdles that lengthen product cycles.
*Our forecasts treat driver/restraint impacts as directional, not additive. The impact forecasts reflect baseline growth, mix effects, and variable interactions.
Foot and Ankle Devices Market Segment Analysis
By Product Type:
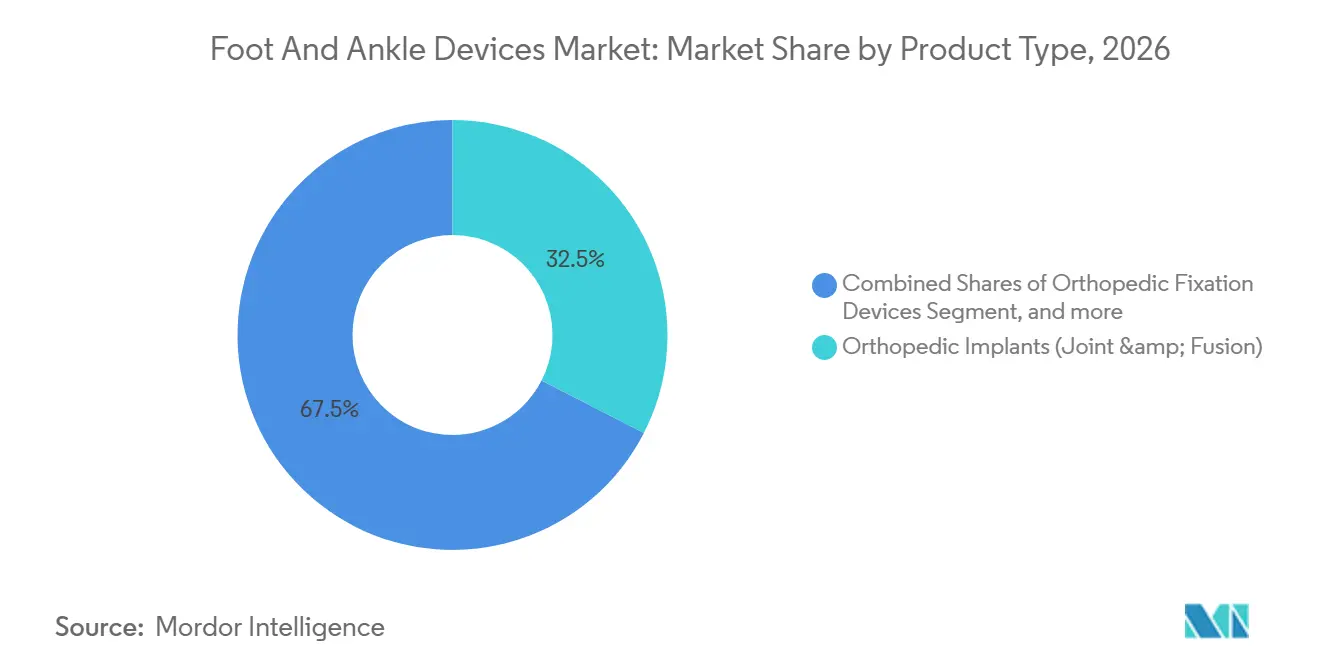
Prostheses Lead Innovation VelocityProstheses opened 2026 with 32.9% revenue and are projected to post a 9.5% CAGR to 2032, making them the strongest contributor to the foot and ankle devices market. High-end microprocessor ankles, such as Össur’s 2024 Proprio Foot, adjust joint angles in real time, lowering metabolic cost by up to 15% and enabling stair ambulation without compensatory hip swing. Orthopedic reconstruction implants secure a 32.5% share, yet their growth moderates as surgeons debate ten-year survivorship, which still trails hip and knee analogs by roughly 80%. Fixation hardware remains essential for complex fractures, with variable-angle plates and percutaneous nails facilitating soft-tissue-gentle techniques that quicken rehabilitation.
A push toward patient-matched constructs is visible across all subcategories. Electron-beam melting and laser-powder bed fusion create porous geometries that are impossible to achieve with machining, enhancing osteointegration and distributing load more evenly across reconstructed joints. Regulatory acceptance is widening: the FDA cleared five patient-matched ankle constructs in 2025 alone, twice as many as in 2023. Vendors now ship single-use cutting guides with QR-coded sterilization logs, aligning with ambulatory center preferences for disposable instrumentation that curbs reprocessing overhead.

By Application:
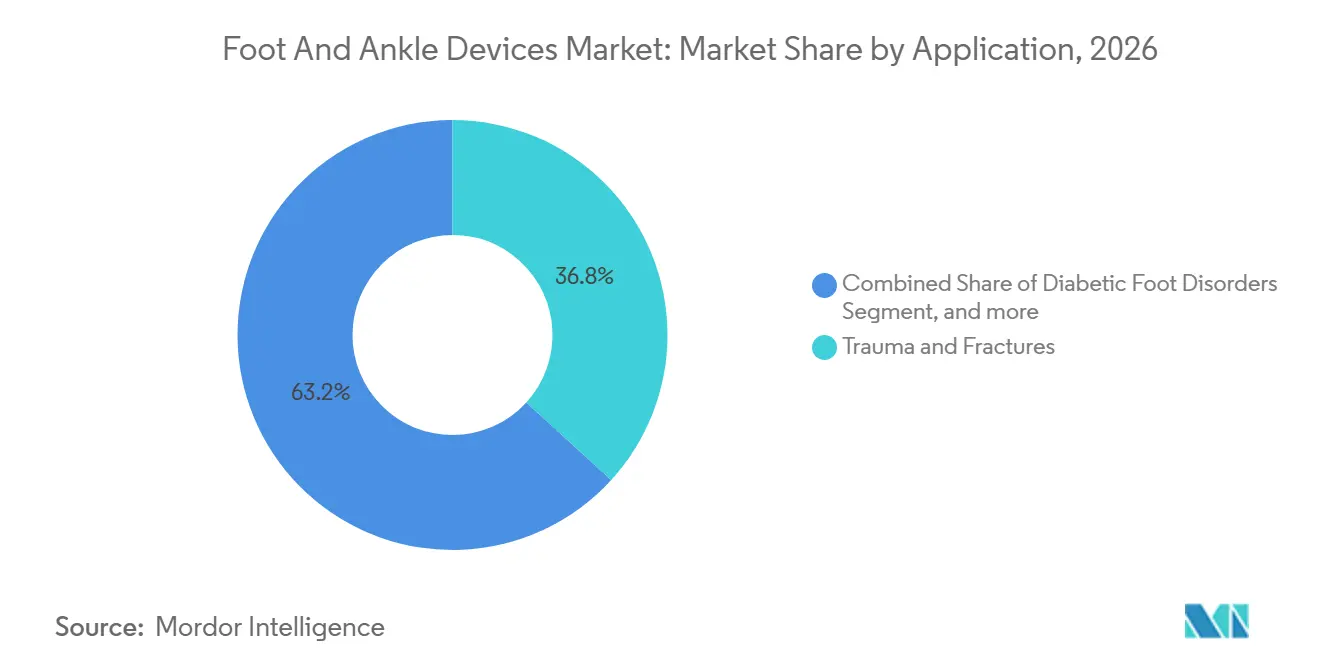
Diabetic Foot Disorders Surge Amid Metabolic EpidemicTrauma and fractures kept their 36.8% lead in 2026, yet diabetic foot disorders are advancing at a 10.2% CAGR, poised to overtake sports-injury and arthritis segments before 2032. Roughly one in two adults with diabetes develops peripheral neuropathy, and up to 30% progress to ulceration without vigilant offloading. The foot and ankle devices market share attached to offloading orthoses, custom carbon insoles, and Charcot reconstruction implants is widening fastest in Asia-Pacific, where diabetes prevalence rose sharply in 2025. Limb-salvage algorithms that integrate multidirectional external frames with antibiotic-impregnated spacers preserve function and limit amputations. Sports and congenital categories maintain mid-single-digit growth, supported by bioresorbable suture anchors and interference screws that return athletes to play sooner.
Regenerative approaches are gaining mindshare in earlier-stage arthritis. Surgeons combine microfracture with particulated juvenile cartilage matrices, such as Arthrex’s BioCartilage, to delay definitive fusion or replacement. Real-world evidence presented at orthopedic congresses in 2025 indicated that biologic augmentation can prolong symptom-free intervals by two to three years for mid-foot chondral lesions. While payers remain cautious, procedure bundling that merges biologics with minimally invasive osteotomies is under evaluation in U.S. centers.
By End-User:
Ambulatory Centers Accelerate ExpansionHospitals still contributed 55.4% of 2026 revenue but ceded growth momentum to physician-owned specialty centers. Such clinics integrate imaging, therapy, and surgery under one roof, improving continuity and compressing overall care episodes. The foot and ankle devices market size in specialty settings is forecast to climb from USD 2.2 billion in 2026 to USD 3.6 billion by 2032. Ambulatory centers suit device kits optimized for single-tray logistics, reinforcing vendor efforts to simplify instrument lines. Hospitals, under payer pressure, negotiate volume rebates that favor established majors, whereas clinics often select premium, patient-specific systems to differentiate offerings.
Rehabilitation facilities form a smaller but strategic channel, absorbing advanced prosthetic fitting and force-plate gait training post-surgery. Collaborations between rehab networks and smart-implant makers generate outcome data that support value-based reimbursement. Device suppliers use these partnerships to refine sensor algorithms and to demonstrate reductions in readmission and revision, building the dossier that payers demand for premium pricing.
Geography Analysis
North America Foot and Ankle Devices Market
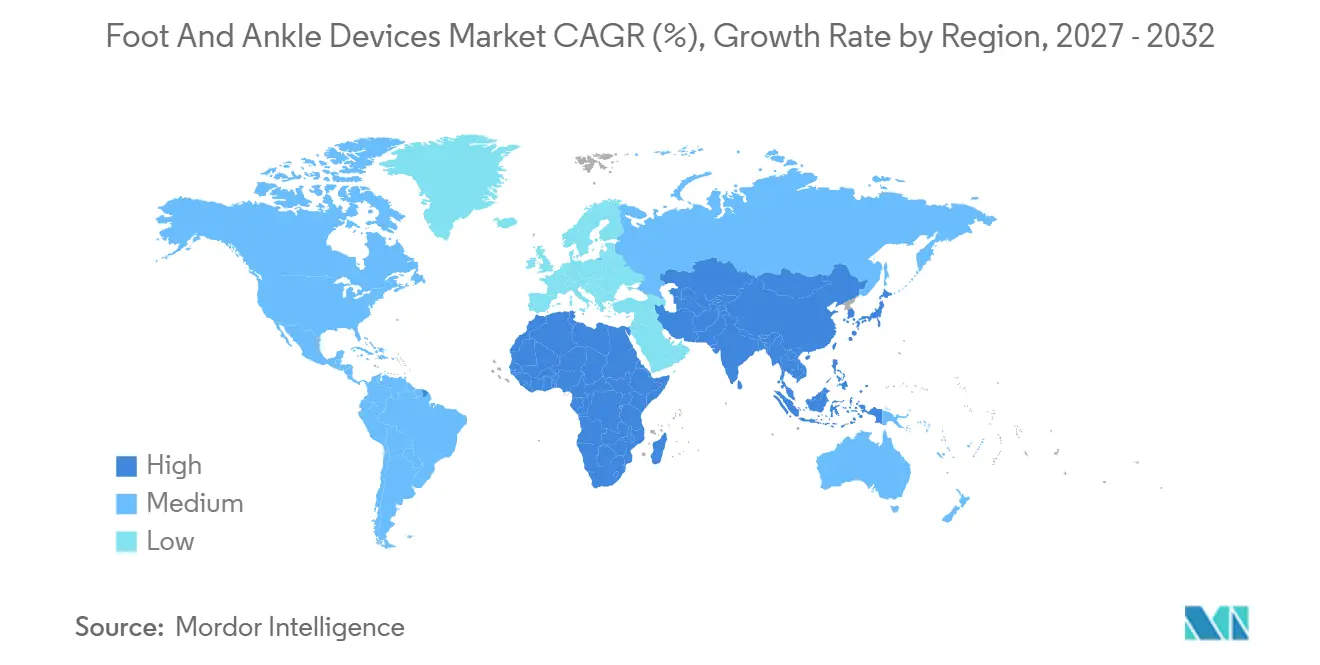
North America accounted for 43.2% of 2026 sales, driven by Medicare-backed outpatient migration and the rapid adoption of patient-matched hardware. FDA guidance issued in 2024 clarified additive manufacturing file requirements, accelerating clearances for complex hindfoot cages that cut operative time by 20%. U.S. private insurers followed CMS's lead, expanding ambulatory surgery center coverage for ankle arthroplasty in their 2026 policies. Canadian provinces pooled procurement for standard trauma plates, slimming system costs, while Mexico’s private hospitals marketed premium reconstructions to inbound medical tourists from Central America.
APAC Foot and Ankle Devices Market
Asia-Pacific is projected to record the fastest regional CAGR at 8.5% through 2032. China’s 14th Five-Year Plan prioritizes community trauma centers, and provincial tenders in 2026 favored vendors offering training packages with navigation units. India’s Health Mission funded digital radiography suites and navigation modules for 150 district hospitals in 2025, opening rural corridors previously underserved[3]. Japan’s super-aged demographic escalated ankle fracture admissions 11% year-on-year in 2025, prompting insurers to raise arthrodesis reimbursement. Australia’s robust private coverage underwrites early adoption of smart implants, while Korean surgeons pioneer mixed-reality navigation in hindfoot fusions supported by government innovation grants.
Europe and South America Foot and Ankle Devices Market
Europe and South America delivered mid-single-digit expansion. EU Medical Device Regulation compliance costs delayed several small-company launches but reinforced patient safety and opened consortium opportunities for real-world registries. Germany and France awarded multi-year bulk tenders in 2025 that bundled trauma and diabetic foot constructs, stabilizing prices but reducing vendor count. In the United Kingdom, National Health Service wait lists for complex reconstructions exceeded 12 months in late 2025, pushing some patients onto private pathways that offer quicker access to high-end implants. Brazil and Argentina led South American demand; fluctuating exchange rates added procurement risk, so hospitals negotiated installment contracts in USD to secure 2026 deliveries.
Regulatory Landscape
Foot and ankle devices operate under increasingly harmonized but demanding orthopedic-device frameworks, with the United States largely regulating these products under 21 CFR 888 (Orthopedic Devices) and many implantable systems cleared via the FDA 510(k) pathway. In June 2026, the FDA codified 21 CFR 888.3041 to classify absorbable metallic bone fixation fasteners as Class II with special controls, tightening expectations around degradation characterization and mechanical performance testing across the degradation timeline, not only at baseline.
In Europe, the Medical Device Regulation (EU) 2017/745 has been fully enforced since 2024, raising the bar for clinical evidence and post-market vigilance for implantable and Class III devices and expanding the role of notified bodies in surveillance. In 2026, the European Commission advanced MDR refinements through a delegated act that amended requirements around clinical investigation exemptions for certain implantable and Class III devices, while maintaining broader clinical evaluation and post-market obligations that affect timelines and documentation planning for fusion, fixation, and replacement implants.
Value Chain Analysis
The value chain covers raw-material and component inputs (titanium, stainless steel, cobalt-chromium, specialty polymers and suture constructs), precision manufacturing (machining, coatings, and additive manufacturing for porous and patient-matched implants), sterilization and packaging, and regulated market access backed by quality systems and submissions. In the United States, repeated 510(k) clearances in 2025 for total ankle systems and plating solutions (for example, APEX 3D total ankle replacement, Incompass total ankle, and newer plating systems) show how regulatory throughput and documentation readiness link directly with commercialization alongside manufacturing capability.
Downstream, distribution and surgeon-support infrastructure shape adoption, particularly as procedures move toward ambulatory and specialty settings that favor streamlined, procedure-specific kits. Regional channel partnerships remain a key lever for reach and inventory placement, illustrated by exclusive distribution appointments in 2025, including Osteotec for Novastep across the UK, Ireland, and Nordic markets and Enovis Foot and Ankle naming Alpha Medical for New Zealand. Digital workflow enablement is also becoming part of the chain; Enhatchs 2025 partnership with 3D Systems to support Smith and Nephews patient-specific ankle solutions via a surgical case portal points to tighter coupling between preoperative planning, manufacturing release, and case fulfillment.
Competitive Landscape
The competitive field is moderately fragmented. Four diversified orthopedics majors—Stryker, Zimmer Biomet, Johnson & Johnson DePuy Synthes, and Smith & Nephew—collectively account for roughly 55% of worldwide revenue. Their strengths lie in multi-line portfolios, surgeon education programs, and global distribution. They defend share by investing in in-house 3D-printing hubs; Stryker’s Facility 8 in Arizona went live in mid-2025 with an annual capacity of 70,000 patient-matched trabecular implants. Meanwhile, agile specialists such as Paragon 28 and Extremity Medical focus on foot-and-ankle-only kits, accelerating iterations that address niche anatomical challenges. Paragon 28 logged 2025 revenue growth of more than 20% after its APEX 3D ankle debut.
Emerging disruptors marry digital and biologic capabilities. Canary Medical works with Zimmer Biomet to integrate load-sensing stems into legacy nails, enriching long-term surveillance datasets. Arthrex advances regenerative matrices that extend the time to replacement in younger, active patients. Manufacturers view post-market registries as competitive assets: companies that contribute validated real-world outcomes data gain faster tender acceptance and greater payer confidence. Quality management remains a litmus test under MDR and evolving FDA expectations; product lines passing radiographic defect analysis per ASTM F3001 gain a reputational advantage as additive manufacturing scales.
Foot and Ankle Devices Industry Leaders
-
Arthrex Inc.
-
Zimmer Biomet
-
Smith & Nephew PLC
-
Stryker Corporation
-
Johnson & Johnson (DePuy Synthes)
- *Disclaimer: Major Players sorted in no particular order
Foot and Ankle Devices Market Companies Covered in this Report
- Acumed
- Advanced Orthopaedic Solutions
- Arthrex
- Conmed
- Enovis (Formerly DJO)
- Extremity Medical LLC
- Integra LifeSciences
- Johnson & Johnson
- Medartis
- MiRus LLC
- Orthofix
- Ottobock
- Paragon 28
- Smiths Group
- Stryker
- Wright Medical Group
- Zimmer Biomet
Market Opportunities and Future Outlook
Opportunity is concentrating around procedure-specific fixation and reconstruction systems that reduce OR friction in ambulatory and specialty settings, where single-tray instrumentation, integrated tensioning tools, and anatomy-matched geometries support faster turnover and standardized workflows. This is reinforced by 2026 commercialization activity across fixation and reconstruction, including Strykers February 2026 launch of Synchfix EVT for flexible syndesmotic fixation and Zimmer Biomet's February 2026 commercial launch of the Phantom curved TTC nail system for hindfoot fusion, both expanding differentiated options in high-volume ankle stabilization and fusion pathways.
A second whitespace centers on advanced materials, modularity, and additive manufacturing that support more individualized alignment management and revision flexibility in total ankle and deformity correction. In February 2026, MiRus received FDA 510(k) clearance for its IO Expandable Wedge Osteotomy System using MoRe Superalloy for intraoperative correction during Evans osteotomies, and in April 2026 restor3d announced full commercial availability of the Aeros Modular Stem System, a 3D-printed stemmed tibial implant for total ankle replacement. On the operating model side, the FDAs February 2026 implementation of the updated Quality Management System Regulation (QMSR) increases the premium on scalable quality systems and supplier controls, favoring companies that can industrialize patient-specific and additive workflows while keeping audit-ready documentation across design changes and manufacturing validation.
Recent Industry Developments in Foot and Ankle Devices Market
- February 2026: Stryker launched Synchfix EVT, expanding its flexible syndesmotic fixation options for adult and adolescent ankle stabilization with integrated suture tensioning handles. The release strengthens procedure-specific fixation offerings that fit ambulatory and sports-medicine workflows, where speed and reproducible tensioning can differentiate device preference.
- April 2025: Zimmer Biomet completed its acquisition of Paragon 28, adding a specialist foot-and-ankle platform to its broader orthopedics portfolio. The combination expanded Zimmer Biomets product depth and surgeon-facing capabilities in extremities, supporting cross-selling through an established global distribution footprint.
- October 2024: Johnson and Johnson MedTech (DePuy Synthes) introduced the VOLT mini plating set with compatibility for augmented-reality navigation headsets. The launch reinforced the shift toward digitally enabled mini-fragment fixation, aligning implant kits with visualization and navigation tools used to standardize screw trajectories and reduce intraoperative variability.
Foot and Ankle Devices Market Report Scope and Research Methodology
Market Definition and Coverage
For this report, the market is defined as the global revenue generated from medical devices used in surgical repair, fusion, and replacement procedures across the foot and ankle area, including implants and related procedure-use systems that support those surgeries.
Scope exclusions: Non-surgical consumer products such as over-the-counter insoles, routine footwear supports, and generic walking aids are excluded from the market totals.
Segments Covered in This Report
- By Product Type
- Orthopedic Fixation Devices
- Orthopedic Implants (Joint & Fusion)
- Bracing & Support Devices
- Prostheses
- Soft-Tissue Orthopedic Devices
- By Application
- Trauma & Fractures
- Osteoarthritis & Rheumatoid Arthritis
- Diabetic Foot Disorders
- Neurological & Congenital Disorders
- Sports-Related Injuries & Others
- By End-User
- Hospitals
- Ambulatory Surgical Centers (ASCs)
- Specialty Orthopedic / Podiatric Clinics
- Rehabilitation Centers
- Geography
- North America
- United States
- Canada
- Mexico
- Europe
- Germany
- United Kingdom
- France
- Italy
- Spain
- Rest of Europe
- Asia-Pacific
- China
- Japan
- India
- Australia
- South Korea
- Rest of Asia-Pacific
- Middle East & Africa
- GCC
- South Africa
- Rest of Middle East & Africa
- South America
- Brazil
- Argentina
- Rest of South America
- North America
Data Sources, Market Sizing, and Validation
Desk Research
Desk research was used to set the outer boundaries of the market, align definitions, and collect consistent demand signals that can be compared across regions. We referenced public sources such as the World Health Organization, OECD health statistics, US FDA device databases (for approvals and safety notices), the US CDC for injury and diabetes burden indicators, and peer-reviewed orthopedic journals for procedure trends and clinical adoption patterns.
Alongside that, we reviewed company filings and investor presentations for portfolio mix cues, as well as reputable press and association websites for guideline and reimbursement direction. Where needed, paid subscriptions for company financial intelligence, patents, and shipment-level trade statistics were used to cross-check totals, especially when product portfolios span multiple orthopedic areas. These examples are not exhaustive, and other public and paid sources were also consulted to collect, validate, and clarify data points.
Primary Interviews and Surveys
Primary work focused on validating procedure growth, pricing behavior, and the line between in-scope foot and ankle device revenue and adjacent orthopedic items. Interviews covered manufacturers, distributors, surgeons, and procurement or operating room stakeholders across APAC, EMEA, and the Americas, which helped close gaps from desk research and confirm assumptions used in the final model.
Distribution of primary research fieldwork respondents
| Company type | Respondent position | Region |
|---|---|---|
| Top tier: 30% | CXOs: 14% | APAC: 40% |
| Mid tier: 56% | Functional/Unit leaders: 37% | EMEA: 36% |
| Smaller Players: 14% | Managers: 49% | Americas: 24% |
Market-Sizing & Forecasting
Sizing was built using top-down and bottom-up methods, with the main structure starting from procedure demand and then converting that demand into revenue using pricing and utilization assumptions. In practice, procedure volumes for key foot and ankle surgeries were reconstructed by region using publicly visible health statistics, injury and chronic disease indicators, and hospital activity signals, and then mapped to device usage rates.
To keep the model tied to observed market behavior, selective bottom-up checks were added using supplier revenue hints, channel feedback, and sampled price bands across common device groups. When the model was finalized, the key drivers were fracture and trauma caseload trends, osteoarthritis and diabetes-related foot complication burden, uptake of ankle replacement and reconstruction techniques, average units used per procedure, and typical ASP movement by geography and setting. For forecasting, scenario analysis was used around procedure recovery, pricing pressure, and adoption pace, and these scenarios were filtered through what interviewees expected for case growth and tender behavior. Where product or country data was thin, assumptions were gap-filled using adjacent orthopedic procedure ratios and then adjusted back using primary feedback before totals were locked.
Data Validation & Update Cycle
Model outputs were checked against independent signals such as procedure indicators, import and export patterns for relevant device categories, and company-level commentary on growth drivers. Outliers were investigated through variance checks, and assumptions were re-tested when a region showed unexpected ASP jumps or when a procedure trend did not align with clinical feedback.
Before sign-off, the work goes through multi-step analyst review so that definitions, calculations, and unit conversions stay consistent across countries. The report is refreshed each year, and interim updates are triggered when material events occur, including regulatory shifts, major pricing changes, or step-changes in procedure adoption. Right before delivery, a final pass is completed so clients receive the most current view available at the time.
Mordor Intelligence's Global Foot and Ankle Devices Market Size Measured Against Other Published Estimates
Published market numbers for foot and ankle devices can look different even when they appear to cover the same topic, since the scope boundary and year timing are not always aligned. Variances also come from how each study treats procedure mix, how pricing is carried forward, and whether values are kept in constant currency or updated using the latest exchange rates.
In this study, the refresh cadence and currency timing were kept consistent across regions, and ASP progression was re-checked using recent tender and distributor feedback before totals were finalized, which helps explain why Mordor Intelligence lands differently versus figures that rely on older price curves or earlier FX snapshots. Gaps also show up when adjacent categories are pulled in, such as broader extremities tools, non-surgical bracing, or wider orthobiologics, which can inflate totals when an inclusion rule is not clear.
Benchmark comparison
| Source | Market Size | Gaps in Research Methodology |
|---|---|---|
| Mordor Intelligence | USD 5.48 B (2026) | |
| Global Consultancy A | USD 5.22 B (2025) | Uses a prior-year base and a different year cut, and its application-led build can shift totals when procedure mix is converted to revenue with earlier pricing assumptions. |
| Industry Publisher B | USD 5.49 B (2026) | Keeps 2026 as the reporting year but may include a wider set of non-implant items (such as broader bracing or procedure-support categories), which changes the in-scope revenue boundary. |
The comparison shows that the spread is mostly explained by timing choices (base year and FX) and what gets counted as in-scope device revenue. By keeping the demand pool tied to procedure activity and then applying transparent price and usage logic, the estimate stays repeatable and easier to reconcile when new data or market events emerge.
Key Questions Answered in the Report
How fast is the foot and ankle devices market expected to grow through 2032?
Revenue is forecast to rise from USD 5.86 billion in 2026 to USD 8.85 billion by 2032, advancing at a 7.09% CAGR.
Which product category shows the strongest future momentum?
Prostheses are projected to expand at a 9.5% CAGR, fueled by microprocessor ankles and patient-matched total ankle systems.
Which application is emerging quickest?
Diabetic foot disorder interventions, including offloading orthoses and Charcot reconstruction hardware, are set to grow at a 10.2% CAGR.
Why are specialty clinics gaining share?
Payers reward lower-cost ambulatory settings, and physician-owned centers integrate imaging, therapy, and surgery, driving a 10.4% CAGR for this channel.
Which region will add the most new revenue?
Asia-Pacific is forecast to post the highest regional CAGR at 8.5% as China, India, and Japan expand orthopedic capacity and coverage.
What technology trends will shape competition?
Patient-matched 3D-printed implants, sensor-enabled hardware, and augmented-reality navigation will differentiate portfolios and support premium pricing.