
Market Overview
| Study Period | 2020 - 2031 |
|---|---|
| Market Size (2026) | USD 467.67 Billion |
| Market Size (2031) | USD 790.01 Billion |
| Growth Rate (2026 - 2031) | 11.07 % |
| Fastest Growing Market | Asia-Pacific |
| Largest Market | Asia-Pacific |
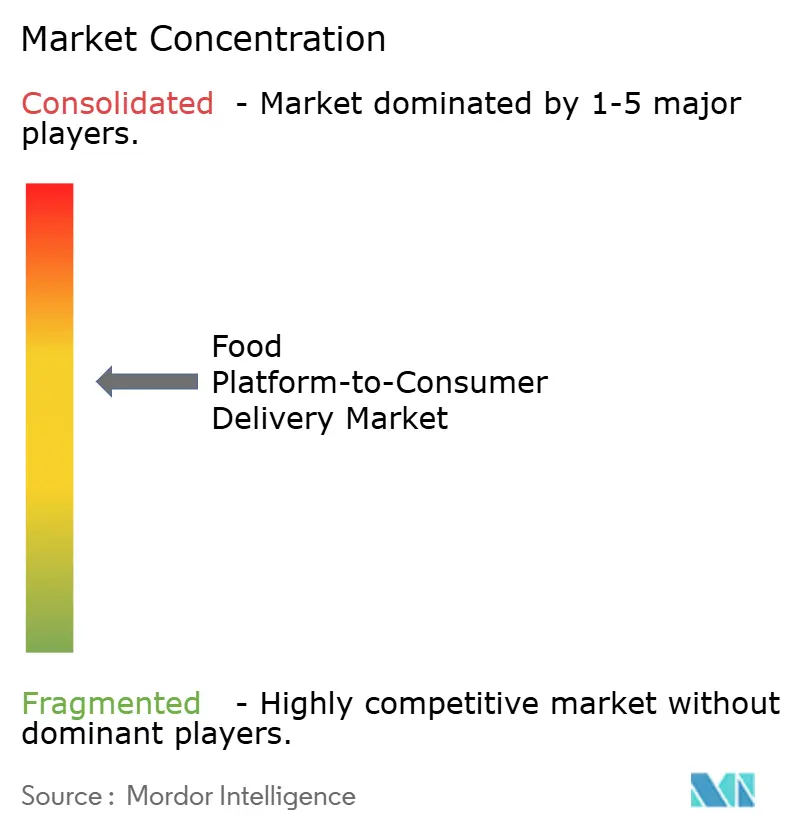
| Market Concentration | Medium |
Major Players *Disclaimer: Major Players sorted in no particular order Image © Mordor Intelligence. Reuse requires attribution under CC BY 4.0. | |
Food Platform-to-Consumer Delivery Market Analysis by Mordor Intelligence
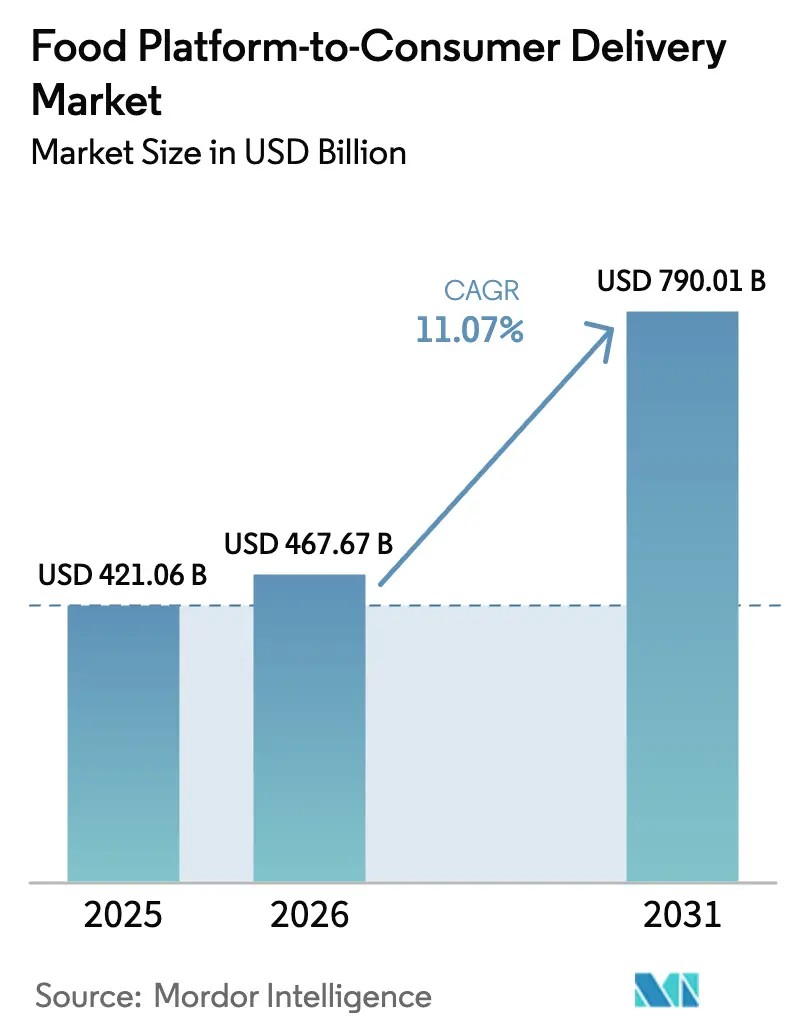
The food platform to consumer delivery market size in 2026 is estimated at USD 467.67 billion, growing from 2025 value of USD 421.06 billion with 2031 projections showing USD 790.01 billion, growing at 11.07% CAGR over 2026-2031. Sustained growth stems from quick-commerce roll-outs that promise sub-10-minute fulfillment in Asian and Middle Eastern capitals, the maturation of subscription-based loyalty programs across North America, and accelerated digital wallet adoption in emerging economies. Full-service platforms are capitalizing on integrated logistics to improve delivery speed and reliability, while hyper-local micro-fulfillment centers raise order density and inventory turns. Autonomous vehicles, AI-driven route optimization, and cloud-kitchen networks are further compressing cycle times and supporting differentiated customer experiences. Regulatory shifts—particularly India’s Open Network for Digital Commerce (ONDC) and European gig-worker directives—are reshaping competitive economics and prompting strategic consolidation among global and regional leaders.
Key Report Takeaways
- By business model, aggregator platforms led with 60.95% of food platform to consumer delivery market share in 2025, whereas full-service platforms are forecast to grow at 14.39% CAGR through 2031.
- By device, mobile applications accounted for 85.60% of 2025 revenue; desktop-web interfaces expect a comparatively modest 6.82% CAGR through 2031.
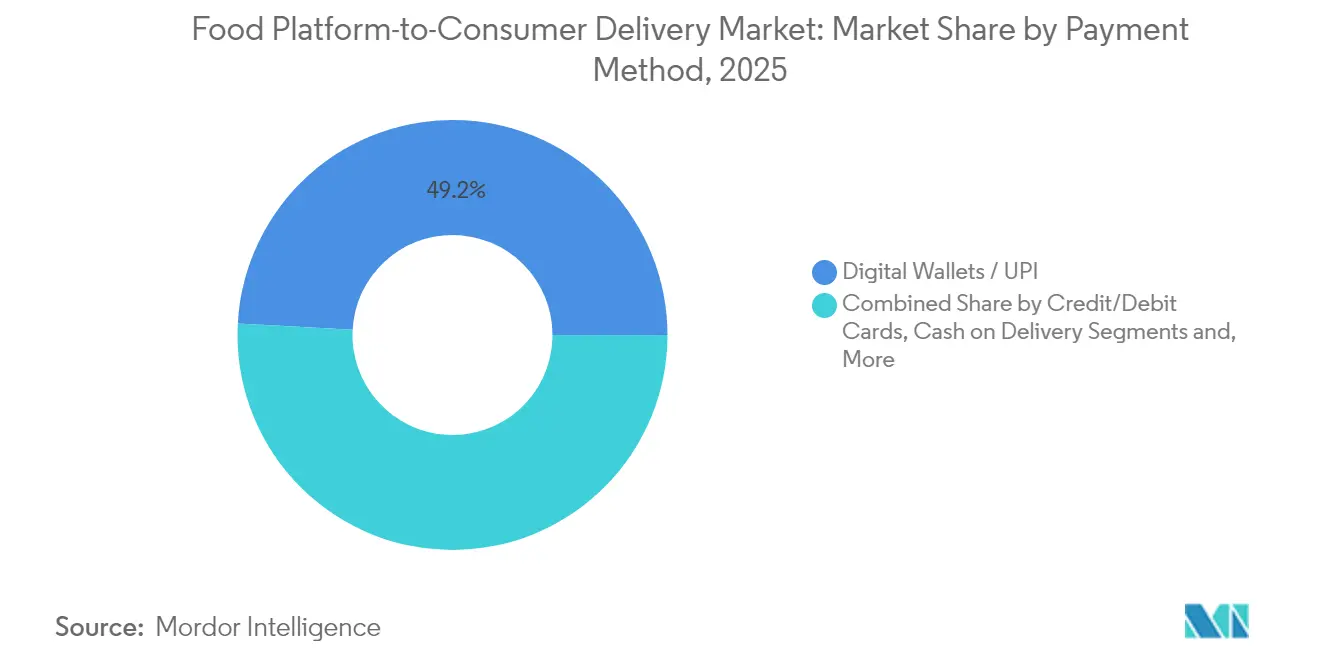
- By payment method, digital wallets and UPI systems captured 49.15% share of the food platform to consumer delivery market size in 2025 and are advancing at a 13.02% CAGR.
- By type of food delivery, grocery and convenience orders represented 28.60% of revenue in 2025 and are expanding at 14.18% CAGR, the fastest of all service lines.
- By geography, Asia-Pacific commanded 42.40% of food platform to consumer delivery market share in 2025 and remains the quickest-growing region with a 13.88% CAGR through 2031.
Note: Market size and forecast figures in this report are generated using Mordor Intelligence’s proprietary estimation framework, updated with the latest available data and insights as of 2026.
Market Trends and Insights
Drivers Impact Analysis of Food Platform-to-Consumer Delivery Market*
| Driver | (~) % Impact on CAGR Forecast | Geographic Relevance | Impact Timeline |
|---|---|---|---|
| Proliferation of Quick-Commerce "10-minute" models in Tier-1 Asian & MENA cities | +2.1% | Asia-Pacific, Middle East | Medium term (2-4 years) |
| Bundled Loyalty & Subscription Programs Boosting Repeat Orders in North America | +1.8% | North America | Short term (≤ 2 years) |
| Rapid Cloud-Kitchen Expansion in Europe Backed by Private Equity | +1.5% | Europe | Medium term (2-4 years) |
| Rising Demand for Healthy & Specialty Diet Platforms among Gen-Z Consumers | +1.3% | Global | Long term (≥ 4 years) |
| Government-led Open-Network for Digital Commerce (ONDC) rollout in India | +1.7% | India, spillover to APAC | Medium term (2-4 years) |
| Restaurant Workforce Shortages Pushing Operators toward Aggregators in OECD markets | +1.9% | North America, Europe | Short term (≤ 2 years) |
| Source: Mordor Intelligence | |||
Proliferation of Quick-Commerce “10-minute” Models in Tier-1 Asian & MENA Cities
Instant-delivery operators now position dark-stores within two-kilometer radii of key population nodes, raising monthly inventory turns above 15 and enabling sub-10-minute fulfillment. Meituan’s Q1 2025 revenue rose to USD 12.1 billion, with 60% of non-food growth sourced from instant-delivery orders. High smartphone penetration, dense traffic corridors, and consumers’ willingness to pay for convenience underpin the model. Order-density economics remain critical, as distributed micro-fulfillment footprints carry elevated fixed costs. Advanced demand-forecasting engines and real-time inventory synchronization are essential to sustain profitability at scale.
Bundled Loyalty & Subscription Programs Boosting Repeat Orders in North America
DoorDash’s DashPass surpassed prior subscriber benchmarks in Q1 2025, contributing to USD 3 billion in revenue and raising purchase frequency by 40-60% among members. Monthly plans that bundle fee reductions with exclusive restaurant access have become a reliable retention lever as customer-acquisition costs escalate. Uber’s membership tiers yield more than triple the spending of single-product users, underscoring the cross-sell potential within multi-service ecosystems. Subscriber data further improves segmentation accuracy, elevating customer lifetime value and informing targeted promotions.
Rapid Cloud-Kitchen Expansion in Europe Backed by Private Equity
Private-equity firms are underwriting distributed cooking hubs that lower entry costs for virtual brands by 60-80%. Rebel Foods’ European rollout, backed by KKR, leverages predictive analytics to locate kitchens in high-conversion catchments and to refine digital menus dynamically. Cloud kitchens typically realize 25-30% higher margin than traditional storefronts through reduced overheads and high order throughput. Success, though, hinges on consistent product quality, stringent food-safety controls, and efficient multi-kitchen logistics coordination.
Rising Demand for Healthy & Specialty Diet Platforms among Gen-Z Consumers
Sweetgreen’s Infinite Kitchens employ robotics to sustain 31.1% store-level margin while generating USD 2.8 million sales per unit. Gen-Z’s preference for clean-label, ethically sourced meals pushes average basket values 25-30% above standard fast-food orders. Platforms that publish granular nutritional data, use biodegradable packaging, and offer carbon-neutral delivery are building lasting brand equity. These operators face complex sourcing and inventory issues, yet their loyal customer bases support premium pricing.
Restraints Impact Analysis of Food Platform-to-Consumer Delivery Market*
| Restraint | (~) % Impact on CAGR Forecast | Geographic Relevance | Impact Timeline |
|---|---|---|---|
| Escalating Last-Mile Rider Insurance & Compliance Costs in EU | -1.4% | Europe | Short term (≤ 2 years) |
| City-level Commission Caps Compressing Margins Hinders the Market | -2.2% | North America, select European cities | Medium term (2-4 years) |
| Heightened Data-Privacy Litigation Risk under CPRA/GDPR | -0.8% | North America, Europe | Long term (≥ 4 years) |
| Volatile Rider Supply due to Gig-Worker Reclassification Drives Cost Spikes | -1.6% | Global, concentrated in developed markets | Medium term (2-4 years) |
| Source: Mordor Intelligence | |||
Escalating Last-Mile Rider Insurance & Compliance Costs in EU
New EU directives oblige platforms to provide accident insurance and minimum-wage guarantees, elevating compliance outlays by 35-45% across primary markets. Insurance premiums alone have climbed 40-60% in Paris, Berlin, and Madrid, challenging smaller regional players that lack the scale to absorb incremental per-delivery costs. Administrative complexity grows as member states apply divergent rules, raising overheads for cross-border operators and prompting further consolidation.
City-level Commission Caps Compressing Margins
Permanent 15% delivery-fee limits in New York, Los Angeles, and Chicago reduce average commission revenue and have driven a 7% decline in order volume in otherwise stable metros. Platforms now levy consumer-facing fees to offset lost restaurant commissions, though higher total ticket prices can dampen frequency and satisfaction. Lower margins restrict discretionary spend on marketing and technology R&D, constraining longer-term innovation.
*Our forecasts treat driver/restraint impacts as directional, not additive. The impact forecasts reflect baseline growth, mix effects, and variable interactions.
Food Platform-to-Consumer Delivery Market Segment Analysis
By Business Model:
Consolidation Favours Integrated LogisticsThe segment with aggregator operators controlling 60.95% of food platform to consumer delivery market share. Full-service rivals, however, are expanding at 14.39% CAGR and are set to narrow the gap by 2031. Integrated fleets allow direct control over courier quality, dynamic batching, and drop-density optimization, resulting in 15-20% shorter delivery times and superior Net Promoter Scores. DoorDash’s Q1 2025 adjusted EBITDA reached USD 590 million after augmenting its autonomous van pilot in Arizona. Investors prefer the higher contribution margins and data moats tied to full-service logistics ecosystems.
Full-service models generate incremental earnings through layered fees, advertising services, and white-label logistics for grocers. Aggregators remain relevant for rapid geographic launches due to low upfront capital yet face mounting churn as restaurants demand fulfilment support and analytics dashboards. As margin pressure intensifies, leading aggregators are pivoting toward hybrid operations, acquiring courier assets, and co-locating ghost kitchens to emulate end-to-end control.


By Device:
Mobile Application Experience Sets Competitive BarMobile channels accounted for 85.60% of 2025 GMV. App-centric design capitalizes on GPS, biometrics, and real-time messaging, while 5G roll-out facilitates richer imagery and AR menu previews. AI-powered reorder prompts and voice-activated checkout streamline the path to purchase, raising conversion. Desktop portals now focus on large basket corporate orders, catering software, and partner analytics.
Mobile supremacy is reinforcing data advantages. Continuous telemetry on user movement, dwell time, and tap patterns enriches recommender systems, boosting average ticket by 8-10%. Nearly every major platform files patents for adaptive UI and automated dispatch orchestration, signifying an arms race in experiential differentiation. Cross-device experiences remain necessary for restaurants that manage menus on larger screens, yet mobile-first thinking guides feature roadmaps.
By Payment Method:
Digital Wallets Support Embedded FinanceDigital wallets and UPI processed 49.15% of 2025 order value and are rising at 13.02% CAGR. Embedded checkout flows remove card-entry friction, while instant bank rails cut settlement costs for merchants. In India, ONDC leverages UPI interoperability, allowing any wallet user to transact with any seller at near-zero fees. Platforms are layering credit lines, cash-back rewards, and small business loans onto transaction data, forging new revenue streams beyond delivery.
Card networks still claim a notable share in North America and Europe, especially for higher-value catering baskets. Cash usage recedes in emerging markets as central banks back real-time payment schemes and smartphone penetration expands. Fraud-detection algorithms that combine device fingerprinting with payment tokenization have reduced chargeback rates by 50% for leading operators.
By Type of Food Delivery:
Grocery Spurs Micro-Fulfilment InnovationCooked meals continue to dominate daily order counts; however, grocery and convenience shipments posted 14.18% CAGR and surpassed USD 120.42 billion in 2025 revenue. Sub-15-minute grocery promises reshape consumer routines as households replace weekly stores with perpetual top-ups. Micro-fulfillment centers stock 2,000 high-velocity SKUs and apply machine-learning restock logic, lifting inventory accuracy above 98%. Cold-chain compliance and batch consolidation mitigate spoilage and mile costs.
Restaurant operators increasingly cross-list packaged goods, allowing blended baskets that raise order value. Ready-to-eat meals gain traction in enterprise catering and late-night segments, aided by temperature-controlled totes that maintain quality over longer radii. Alcohol and pharmacy delivery leverage existing courier networks but require additional compliance workflows, including ID verification and secure storage modules.
Geography Analysis
APAC Food Platform-to-Consumer Delivery Market
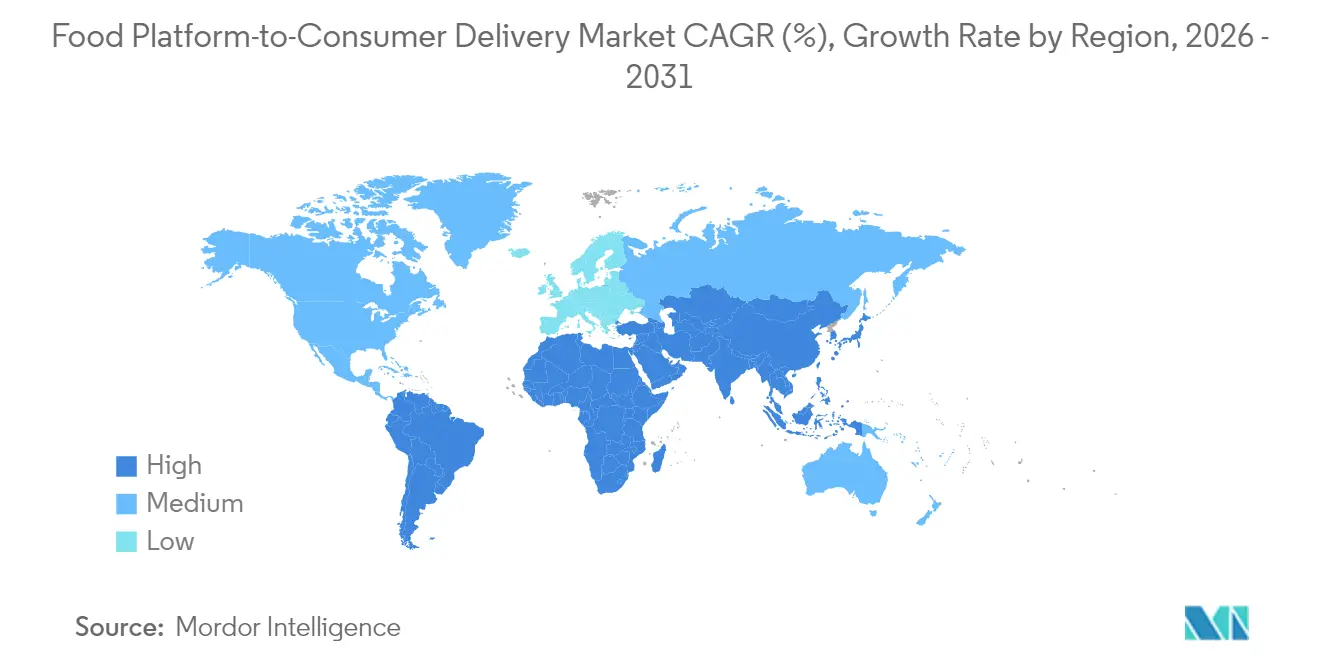
Asia-Pacific produced USD 178.53 billion in 2025 revenue and 42.40% of food platform to consumer delivery market share, expanding at 13.88% CAGR to 2031. China’s super-app leaders bundle dining, grocery, ride-hailing, and payments, generating unrivaled cross-sell synergies. Meituan’s net profit almost doubled year-over-year as the firm piloted international entries in Saudi Arabia and Brazil. India’s ONDC processed a cumulative 7.1 million transactions by December 2024, 32.5% of which were food deliveries, validating the low-commission open-network thesis.
North America, EMEA and LATAM Food Platform-to-Consumer Delivery Market
North America delivered USD 123.79 billion in 2025 sales and reflects a maturing arena distinguished by premium loyalty programs and early autonomy pilots. DoorDash achieved USD 193 million GAAP net income in Q1 2025, its second successive profitable quarter. Citywide fee caps and impending minimum-wage ordinances continue to compress contribution margins. Canadian provinces exhibit accelerated suburban penetration as drone pilots begin servicing low-density corridors. Europe realized USD 67.79 billion (EUR 61 billion; USD 67 billion) in 2025 turnover, yet growth remains uneven due to disparate regulatory frameworks. Delivery Hero recorded 16% revenue growth despite mandatory rider insurance in several markets. DoorDash’s acquisition of Deliveroo introduces scaled synergies in the UK, France, and Italy while raising antitrust scrutiny. Latin America, led by Brazil, produced USD 32.42 billion in GMV, with iFood holding 80% share and facing potential disruption from Meituan’s 2025 entry. Middle East and Africa combined for USD 18.53 billion, aided by rising smartphone use and improving digital-payment infrastructure, though last-mile logistics remain challenging outside capitals.
Regulatory Landscape
Regulatory scrutiny is tightening around platform pricing transparency, food safety compliance, and the classification and protection of gig workers. In the United States, the Federal Trade Commission opened public comment on April 16, 2026 on potential unfair or deceptive fee practices in online food and grocery delivery, raising pressure to standardize how service fees, delivery fees, and surcharges are presented at checkout.
In Asia, China has tightened platform service-management and food-safety enforcement, with GB/T 46862-2025 implemented on December 2, 2025 to define baseline requirements for food delivery platform service management. Enforcement actions increased in April 2026, when the market regulator fined seven e-commerce platforms, including Meituan and Taobao Shangou, a combined 3.6 billion yuan for food safety violations. Further inspections from June 2026 targeted verification of physical locations for listed restaurants as part of a crackdown on ghost kitchens. In India, labor-related compliance is also rising, with the Karnataka Platform-Based Gig Workers (Social Security and Welfare) Act, 2025 introducing welfare fee obligations for aggregators. The Ministry of Labour set a June 21, 2026 deadline for platform gig-worker registration on the e-Shram portal under the Code on Social Security.
Value Chain Analysis
The value chain covers (i) supply-side onboarding and compliance (restaurants, cloud kitchens, grocers, and convenience stores), (ii) demand generation and ordering (mobile apps and web interfaces), (iii) payment processing and settlement (cards, digital wallets, and real-time rails such as UPI), (iv) fulfillment orchestration (dispatch, batching, routing, and customer support), and (v) last-mile delivery execution (courier fleets, temperature-controlled handling for grocery, and proof of delivery). In this market, the platform layer captures value through marketplace access, advertising, delivery and service fees, and increasingly through loyalty and subscription programs, plus embedded finance tied to transaction data.
Food safety and traceability requirements are moving more process controls into the chain, particularly for grocery and convenience orders where cold-chain adherence is critical. Standards and compliance programs such as IFS Logistics Standard v3, Singapore SS 687:2022 for food e-commerce, and China’s GB/T 46862-2025 support best practices around seller onboarding, order management, temperature monitoring, and recall readiness. As regulators scrutinize ghost kitchens and physical-location verification, platforms and merchant partners are increasingly relying on tighter data-sharing, auditable records, and temperature evidence capture across handoffs from preparation to last-mile delivery.
Competitive Landscape
Global leadership is consolidating as platforms acquire regional peers to secure density and technology assets. DoorDash’s USD 3.86 billion purchase of Deliveroo creates a 40-country network and grants immediate scale in Europe. [1] Wonder’s USD 650 million take-over of Grubhub fuses an owned-kitchen model with a high-frequency marketplace, signaling strategic movement toward full-stack meal-time ecosystems. [2] Uber’s 85% stake in Trendyol GO strengthens its Middle East footprint and introduces a high-growth frontier asset. [3]
Competitive differentiation now centers on proprietary algorithms, automation, and embedded fintech. Autonomous vans in Phoenix cut DoorDash’s unit-cost by up to 30% on suitable routes, while Waymo’s perception stack lowers incident risk versus human riders. AI routing produces double-digit productivity lifts by dynamically matching courier capacity to order clusters. Advertising marketplaces within the apps drive high-margin revenue for platforms and elevate restaurant visibility.
Barriers to entry are rising as regulation tightens and scale economics become decisive. Platforms with multi-modal fleets can reassign couriers between food, grocery, and parcel verticals, maximizing asset utilization. Niche players focused on dietary specialisms or campus markets still attract venture backing, yet most will need white-label logistics alliances or shared-kitchen partnerships to sustain growth. Strategic collaborations with grocers, CPG firms, and mobility providers offer incremental volume and shared data insights, broadening monetization levers.
Food Platform-to-Consumer Delivery Industry Leaders
-
UberEats (Uber Technologies Inc.)
-
DoorDash, Inc.
-
Grubhub Inc.
-
Meituan Dianping
-
Deliveroo plc
- *Disclaimer: Major Players sorted in no particular order
Food Platform-to-Consumer Delivery Market Companies Covered in this Report
- Uber Technologies Inc. (Uber Eats)
- DoorDash Inc.
- Meituan Dianping
- Delivery Hero SE
- Just Eat Takeaway.com N.V.
- Zomato Ltd.
- Bundl Technologies Pvt Ltd. (Swiggy)
- Grab Holdings Ltd.
- Rappi Inc.
- iFood com Agencia de Restaurantes Online S.A.
- Ele.me (Alibaba Group Holding Ltd.)
- Postmates LLC
- Foodpanda (Growthpond SE)
- Deliveroo plc
- ChowNow Inc.
- Gojek Tech (GoFood)
- Talabat Middle East LLC
- Menulog Pty Ltd.
- Bolt Restaurant Platform
- Wolt Enterprises Oy
Read Analysis of Food Platform-to-Consumer Delivery Companies
Market Opportunities and Future Outlook
Regulatory and consumer pressure around transparency and food safety is creating room for platforms that can operationalize verifiable compliance at scale, especially in grocery and convenience where temperature control and traceability shape repeat usage. Building temperature recorders with cloud monitoring, strengthening recall protocols, and using auditable evidence storage (including blockchain-style verification approaches where appropriate) supports fresh-food e-commerce service specifications and logistics standards such as IFS Logistics v3, while aligning with China’s tighter platform service-management requirements under GB/T 46862-2025.
There is also an operational opportunity in formalizing the delivery workforce through system-level integrations that reduce compliance friction and improve rider retention economics. India’s push to register gig workers on the e-Shram portal by June 21, 2026, alongside state-level welfare fee regimes such as Karnataka’s Platform-Based Gig Workers (Social Security and Welfare) Act, 2025, increases the value of compliant onboarding, identity, and benefits administration workflows embedded into dispatch and payroll operations. On the demand side, the market keeps shifting toward multi-vertical ecosystems where food, grocery, and convenience baskets share last-mile capacity, supported by retail onboarding integrations such as direct e-commerce platform connectivity (for example, DoorDash’s Shopify integration announced in 2026). These partnerships expand available assortment without requiring platforms to build all inventory infrastructure themselves.
Recent Industry Developments in Food Platform-to-Consumer Delivery Market
- July 2026: Uber Technologies, Inc. entered into a business combination agreement to acquire Delivery Hero SE through a voluntary public takeover offer, with combined pro-forma gross bookings of $236 billion in 2025. The transaction supports platform consolidation and cross-border expansion, strengthening the scale of Uber’s food delivery network.
- July 2026: Uber Technologies, Inc. partnered with GameStop to provide on-demand delivery of video games, collectibles, and electronics via Uber Eats. The collaboration extends delivery into media and merchandise categories and increases high-frequency order options for the app.
- July 2026: DoorDash, Inc. integrated directly with Shopify to allow US brick-and-mortar retailers to add their product catalogs to the DoorDash marketplace. The integration supports faster retailer catalog onboarding, expands live inventory, and strengthens retail partnerships.
Food Platform-to-Consumer Delivery Market Report Scope and Research Methodology
Market Definition and Coverage
For this report, the market covers the value of food ordered through digital platforms and delivered to consumers, where the platform plays the key role in discovery, ordering, payment enablement, and handoff to a delivery process.
Scope exclusions: We exclude offline phone orders, in-restaurant dine-in sales, and grocery-only baskets that do not include prepared food delivery.
Segments Covered in This Report
- By Business Model
- Aggregator
- Full Service
- By Device
- Mobile Applications
- Desktop / Web
- By Payment Method
- Digital Wallets and UPI
- Credit/Debit Cards
- Cash on Delivery (COD)
- By Type of Food Delivery
- Ready-to-Eat Meals
- Cooked-to-Order Meals
- Groceries
- Other Type of Food Deliveries
- By Geography
- North America
- United States
- Canada
- Mexico
- Europe
- Germany
- United Kingdom
- France
- Nordics
- Rest of Europe
- Asia-Pacific
- China
- India
- Japan
- Rest of Asia-Pacific
- South America
- Brazil
- Argentina
- Rest of South America
- Middle East
- Saudi Arabia
- United Arab Emirates
- Rest of Middle East
- Africa
- South Africa
- Rest of Africa
- North America
Data Sources, Market Sizing, and Validation
Desk Research
Desk research was used to set the market structure and to anchor demand signals that can be checked over time. We used public, non-paywalled sources such as World Bank and IMF macro indicators, ITU connectivity statistics, OECD household spend series, national statistics offices for CPI and food services data, and trade and labor departments for services and workforce context.
To turn these signals into a practical sizing model, we also reviewed platform disclosures and filings where available, investor presentations, earnings call transcripts, app and web traffic commentary in reputed press, and regional association publications covering restaurants and delivery operations. Alongside this, we referenced paid subscriptions for company financials and intelligence, news and financials screening, and selective import-export shipment-level checks for packaging and last-mile equipment indicators when they helped explain quarter-to-quarter swings. The sources listed are illustrative, and we reviewed other documents to compile data, validate assumptions, and clarify open questions.
Primary Interviews and Surveys
Primary interviews and surveys were used to pressure-test how platform revenue is recognized, how commissions and delivery fees trend by market, and how consumer order frequency shifts through the year. We spoke with executives, functional leaders, and managers across platform operations, restaurant partners, and last-mile ecosystems, and we balanced inputs across APAC, EMEA, and the Americas so regional mixes did not get skewed by one high-growth corridor.
Distribution of primary research fieldwork respondents
| Company type | Respondent position | Region |
|---|---|---|
| Top tier: 25% | CXOs: 12% | APAC: 43% |
| Mid tier: 60% | Functional/Unit leaders: 38% | EMEA: 31% |
| Smaller Players: 15% | Managers: 50% | Americas: 26% |
Market-Sizing & Forecasting
Sizing starts with a top-down demand pool build, where digital ordering penetration and food-away-from-home spending are used to reconstruct the value of platform-mediated delivery by region. We then corroborate totals with selective bottom-up approximations such as sampled average order value times orders per active user, commission take rate channel checks, and roll-ups of publicly discussed delivery fee ranges. Where these checks disagree, we adjust the model so the outcome aligns to both platform fee behavior and observed order economics.
Key model inputs include smartphone and broadband reach, digital payment mix, urbanization and addressability of delivery zones, average order value movement (including inflation pass-through), order frequency per user, and commission plus delivery fee ranges that differ by market maturity. Forecasting is run using scenario analysis supported by simple multivariate relationships, where adoption, pricing, and order density are flexed within ranges validated by interviews. When bottom-up inputs are missing for smaller countries, we use proxy markets with similar income and connectivity profiles, then sanity check the outcome against regional totals.
Data Validation & Update Cycle
Model outputs are cross-checked against independent signals such as consumer spend series, platform-reported regional growth commentary, and shifts in delivery fee and promotional intensity discussed by operators. If a region shows an unusual jump, the assumptions are re-opened, and respondents are re-contacted to confirm whether the change came from pricing, frequency, or mix.
Before sign-off, the work goes through multi-step analyst reviews that include variance checks across regions and year-to-year consistency tests on core inputs. Reports are refreshed annually, and interim updates are made when material events occur, such as regulatory changes on gig work, major pricing moves, or visible demand shocks. Right before delivery, we do a final pass so the numbers reflect the latest available public data and validated assumptions.
Mordor Intelligence's Global Food Platform to Consumer Delivery Market Sizing Compared With Other Published Estimates
Published estimates for platform-to-consumer delivery often diverge because the revenue line is not the same across studies, and because some models treat promotions, taxes, and delivery charges differently. Differences also come from how hybrid models are treated, and whether the study uses a single global assumption or allows key inputs to vary by region.
Key gap drivers in this market usually include whether the estimate counts gross order value versus platform net revenue, whether grocery-adjacent orders are blended in, and whether average order value is adjusted using a single CPI series rather than market-level pricing checks. Currency conversion timing and update cadence also matter, since faster-moving regions can shift the global total quickly when pricing or subsidies change.
Benchmark comparison
| Source | Market Size | Gaps in Research Methodology |
|---|---|---|
| Mordor Intelligence | USD 467.67 B (2026) | |
| Industry Blog A | USD 173.57 B (2025) | This figure is presented as a broad online food delivery value and appears to mix categories while relying on a single headline growth rate, which can undercount markets where platform commission and fee structures vary sharply. |
| Payments Industry Report B | USD 468.90 B (2025) | The estimate reads closer to a restaurant delivery revenue pool and may reflect gross transaction value with limited adjustment for promotions and platform take rates, which shifts the number relative to net platform-mediated delivery value. |
The table shows a wide spread that mostly traces back to what revenue layer is being counted and how adjacent order types are handled. In the Mordor Intelligence approach, the total is tied to platform-mediated delivery value and is checked against region-level adoption, order economics, and pricing signals, which helps keep the estimate repeatable when inputs shift year to year.
Key Questions Answered in the Report
What is the current value of the food platform to consumer delivery market?
The food platform to consumer delivery market size reached USD 467.67 billion in 2026 and is on track to hit USD 790.01 billion by 2031.
Which region leads growth in this sector?
Asia-Pacific tops both volume and momentum, holding 42.40% share in 2025 and expanding at 13.88% CAGR through 2031.
How fast is the grocery delivery segment growing?
Online grocery and convenience delivery is the fastest-expanding category, advancing at 14.18% CAGR between 2026 and 2031.
Why are platforms investing in subscription models?
Subscription programs such as DashPass increase repeat-purchase frequency by up to 60% and provide predictable recurring revenue that offsets rising customer-acquisition costs.
How are regulations affecting platform profitability?
Commission caps in major US cities and EU insurance mandates are compressing margins, prompting operators to introduce consumer fees and accelerate automation initiatives to control costs.