
Market Overview
| Study Period | 2021 - 2031 |
|---|---|
| Market Size (2026) | USD 11.60 Billion |
| Market Size (2031) | USD 15.44 Billion |
| Growth Rate (2026 - 2031) | 6.01 % |
| Fastest Growing Market | Asia Pacific |
| Largest Market | North America |
| Market Concentration | Medium |
Major Players *Disclaimer: Major Players sorted in no particular order Image © Mordor Intelligence. Reuse requires attribution under CC BY 4.0. | |
Food Hydrocolloids Market Analysis by Mordor Intelligence
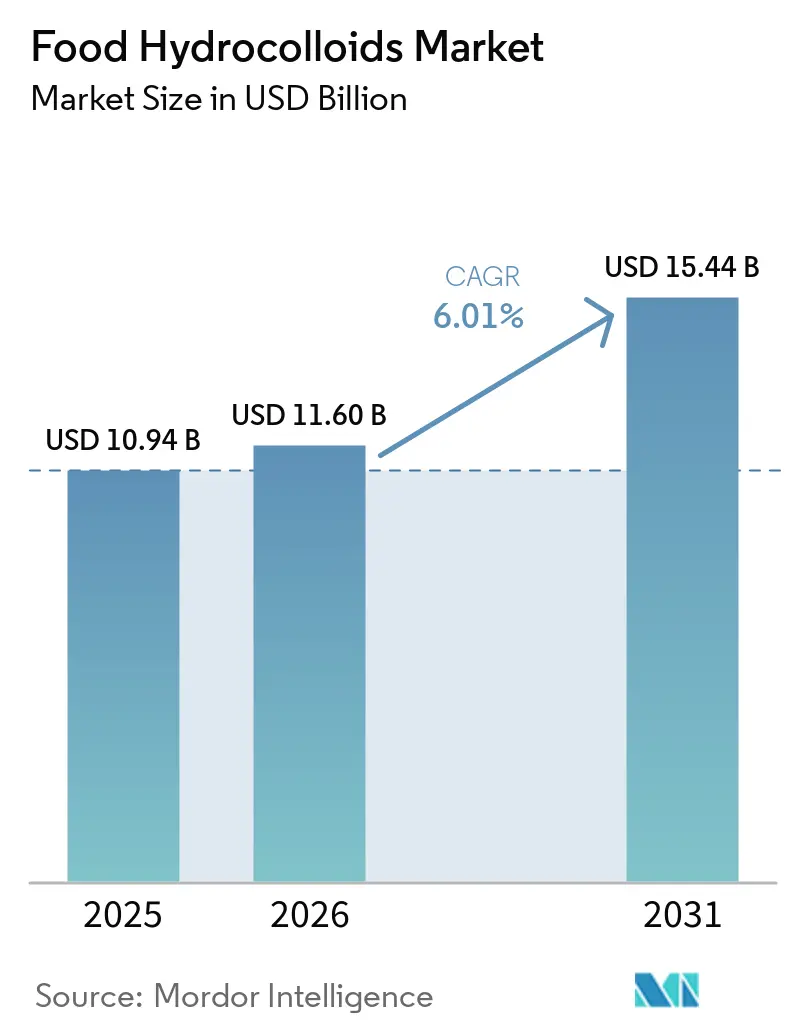
The food hydrocolloids market size was valued at USD 10.94 billion in 2025 and estimated to grow from USD 11.60 billion in 2026 to reach USD 15.44 billion by 2031, at a CAGR of 6.01% during the forecast period (2026-2031). The market is evolving beyond traditional commodity cycles, with a heightened emphasis on functional food ingredients that seamlessly deliver texture, stability, and clean-label compliance in various food products. This growth momentum is bolstered by precision fermentation, which mitigates agricultural risks, and seaweed biorefineries, broadening the spectrum of raw material options. Furthermore, additive manufacturing is carving out premium niches in the market, enabling manufacturers to cater to specialized consumer demands. Key competitive focal points include securing botanical and microbial feedstocks, navigating regulatory challenges, and aligning with consumer preferences that favor recognizable plant sources. The increasing demand for clean-label products and sustainable sourcing practices is driving innovation and reshaping product development strategies. As the landscape evolves, strategic investments in capacity, traceable sourcing, and technical services are becoming pivotal in defining competitive trajectories. Companies are also focusing on enhancing their R&D capabilities to develop innovative solutions that meet the dynamic needs of the food and beverage industry.
Key Report Takeaways
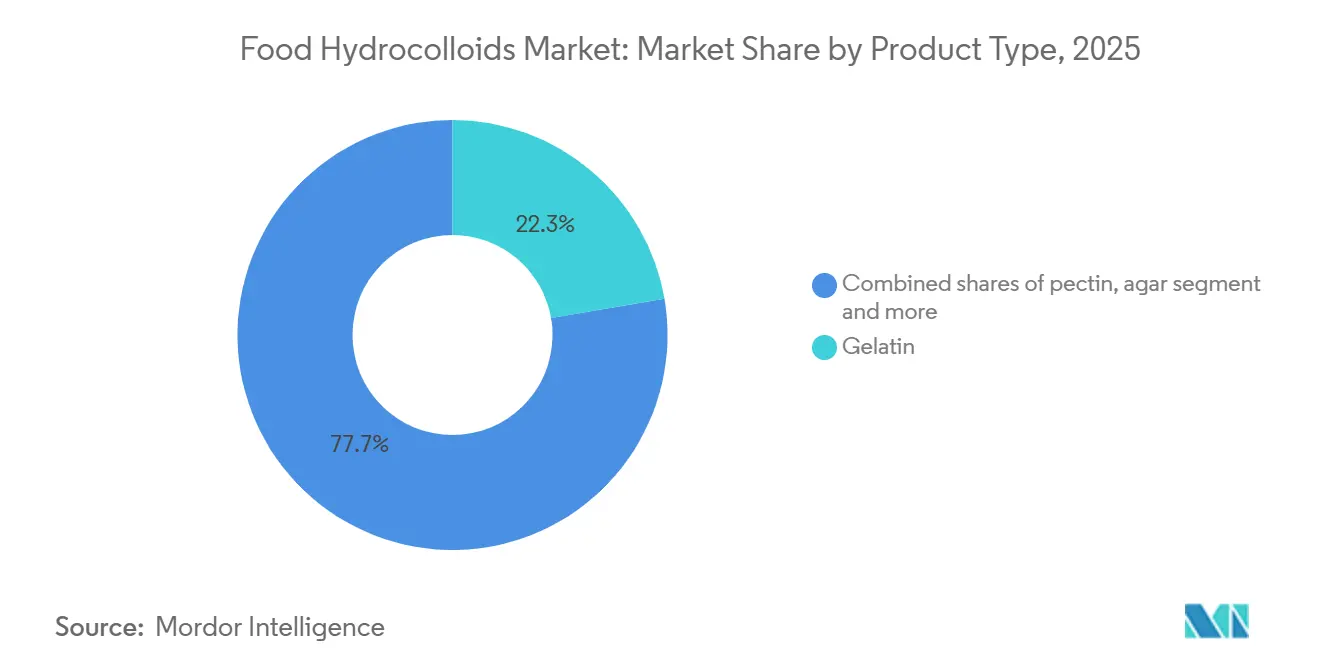
- By type, gelatin led the type segment with 22.30% food hydrocolloids market share in 2025, while pectin recorded the fastest 7.79% CAGR through 2031.
- By form, powder forms controlled 71.44% of the food hydrocolloids market size in 2025; liquid concentrates posted a 6.54% CAGR for 2026-2031.
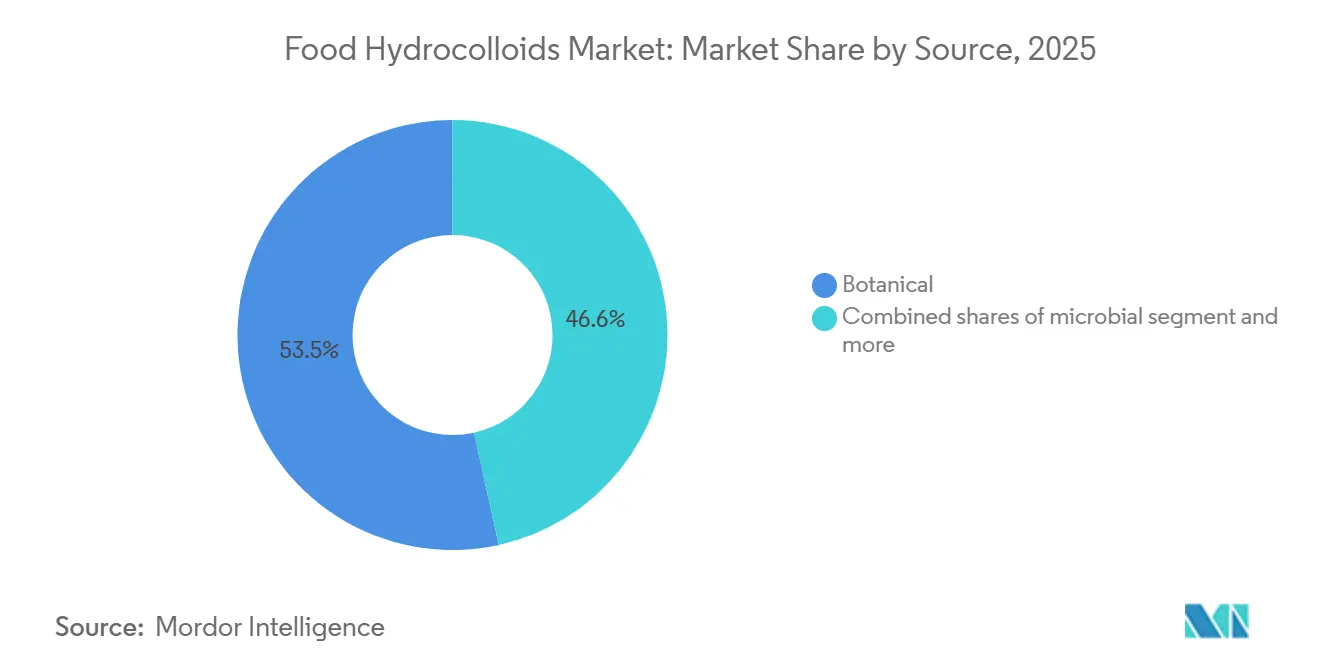
- By source, botanical sources commanded 53.45% value share in 2025; microbial fermentation grew at a 5.95% CAGR through 2031.
- By application, bakery and confectionery generated 28.77% of the 2025 demand, whereas dairy and desserts advanced at a 6.77% CAGR to 2031.
- By geography, North America captured 33.45% revenue in 2025; Asia-Pacific is on track for a 7.25% CAGR through 2031.
Note: Market size and forecast figures in this report are generated using Mordor Intelligence’s proprietary estimation framework, updated with the latest available data and insights as of January 2026.
Global Food Hydrocolloids Market Trends and Insights
Drivers Impact Analysis*
| Drivers | (~) % Impact on CAGR Forecast | Geographic Relevance | Impact Analysis |
|---|---|---|---|
| Hydrocolloids Gain Traction in Processed Foods | +1.2% | Global, with concentration in North America and Europe | Medium term (2-4 years) |
| Clean-label and plant-based ingredient preference | +1.5% | North America, Europe, APAC (Asia-Pacific) urban centers | Long term (≥ 4 years) |
| Functional role in gluten-free and low-fat products | +0.8% | North America and Europe core, spillover to APAC | Medium term (2-4 years) |
| Biorefinery-grade seaweed valorization boosts supply security | +0.6% | APAC core (China, Indonesia, Philippines), spillover to Europe | Long term (≥ 4 years) |
| 3D food printing needs precision rheology ingredients | +0.4% | North America and Europe innovation hubs | Long term (≥ 4 years) |
| Edible and biodegradable packaging films adoption | +0.5% | Europe regulatory push, APAC manufacturing scale | Medium term (2-4 years) |
| Source: Mordor Intelligence | |||
Expanding use of hydrocolloids as thickening and gelling agents in processed and convenience foods
Ready-to-eat meal manufacturers are embedding hydrocolloid systems to extend ambient shelf life without refrigeration, a capability that matters less for food safety in developed markets than for enabling e-commerce fulfillment models where last-mile cold chain remains prohibitively expensive. Xanthan gum and guar gum blends now stabilize plant-based meat analogs by binding water released during freeze-thaw cycles, preventing the syneresis that plagued early-generation products. Carrageenan maintains suspension in high-protein beverages, addressing a formulation challenge where whey and pea protein isolates precipitate under acidic pH conditions common in fruit-flavored drinks. The shift toward smaller household sizes in urban Asia is driving single-serve packaging formats that require hydrocolloids to maintain viscosity across wider temperature ranges during distribution. Locust bean gum is gaining traction in ambient dessert cups where it delivers creamy mouthfeel without the refrigeration infrastructure that limits distribution in tier-2 and tier-3 cities across India and Southeast Asia.
Clean-label and plant-based ingredient preference
Pectin's accelerated adoption reflects a strategic calculation by food manufacturers: replacing modified starches with fruit-derived hydrocolloids enables "no artificial ingredients" claims across retail channels. According to data from CBI, the Ministry of Foreign Affairs, clean-label products are expected to account for over 70% of product portfolios by 2025-2026, up from 52% in 2021[1]. Agar, traditionally used in Asian desserts, is now appearing in European plant-based cheese formulations, where it replicates the melt-and-stretch properties of casein without triggering allergen declarations. The European Food Safety Authority's 2024 re-evaluation of carrageenan, which reaffirmed its safety profile while tightening specifications for degraded forms, has paradoxically strengthened demand for traceable seaweed supply chains that can document molecular weight distributions. Beyond formulation, clean label positioning supports premium pricing models, enabling companies to justify higher input costs. As a result, hydrocolloids are now viewed as strategic tools for brand differentiation, favoring suppliers that offer verified natural sourcing, transparent production practices, and consistent technical reliability.
Functional role in gluten-free and low-fat products
Xanthan gum has emerged as the go-to structure-builder in gluten-free baking, stepping in for the viscoelastic network typically offered by wheat gluten. However, formulators have found that blending xanthan gum with guar gum in a 60:40 ratio effectively diminishes the gummy texture often linked to subpar gluten-free products. Also, the EFSA's re-evaluation of xanthan gum confirms its safety profile even for infant applications, providing regulatory confidence for expanded use across sensitive consumer segments. In the realm of low-fat dairy, manufacturers are turning to microparticulated whey protein and carrageenan systems as substitutes for milkfat. This shift is crucial, as these alternatives replicate the cream's lubricity, and fat reduction is known to compromise mouthfeel perception more than flavor intensity. Methylcellulose, though a modified cellulose and not a conventional hydrocolloid, is playing a pivotal role in plant-based burger patties. It's helping them release moisture and shrink during cooking, mimicking ground beef behavior. This addresses a sensory gap that previously hindered repeat purchases of meat alternatives. As the gluten-free market matures, the criteria for selecting hydrocolloids are evolving. It's no longer just about "functional adequacy" but rather achieving a standard that's "indistinguishable from wheat-based counterparts." Meeting this benchmark often necessitates multi-component systems over single-ingredient solutions.
Biorefinery-grade seaweed valorization boosts supply security
In China and Indonesia, integrated seaweed processing facilities are extracting carrageenan, alginate, and agar from the same biomass feedstock. They then route the lower-grade fractions to produce animal feed and biostimulants. This cascading value model not only boosts processor margins but also stabilizes the hydrocolloid supply. Norway is leveraging its offshore aquaculture infrastructure, initially set up for salmon farming, to cultivate sugar kelp for alginate production. This infrastructure offers sheltered growing sites and established permitting frameworks, significantly cutting down regulatory lead times. In the Philippines, the carrageenan industry is shifting to contract farming models. Here, processors supply seedlings and offer technical assistance to coastal communities. This approach not only secures the supply but also ensures traceability, meeting the EU's due diligence standards for deforestation-free commodities. Thanks to evolving biorefinery economics, previously overlooked seaweed species are now commercially viable. For instance, Sargassum, once deemed a nuisance bloom in the Caribbean, is now being harvested for alginate extraction, turning an environmental challenge into a valuable feedstock. As climate adaptation pushes seaweed cultivation into deeper offshore zones where temperature and nutrient variability are more stable, it is necessitating capital-intensive mooring systems. However, this shift promises a more consistent quality of carrageenan compared to traditional intertidal farming.
Restraints Impact Analysis*
| Restraint | (~) % Impact on CAGR Forecast | Geographic Relevance | Impact Timeline |
|---|---|---|---|
| Raw material price and supply chain volatility | -0.7% | Global, acute in APAC and Middle East | Short term (≤ 2 years) |
| Stringent additive regulations and ingredient perception issues | -0.5% | Europe and North America regulatory cores | Medium term (2-4 years) |
| Seaweed biomass diversion to biostimulant and methane-reduction uses | -0.3% | APAC production zones, Europe demand centers | Long term (≥ 4 years) |
| Anti-dumping tariffs on Chinese xanthan gum | -0.2% | North America and Europe import markets | Short term (≤ 2 years) |
| Source: Mordor Intelligence | |||
Raw-material price and supply chain volatility
Hydrocolloid processing complexity creates supply chain vulnerabilities and cost pressures that particularly impact smaller manufacturers and emerging market applications. Indonesia's seaweed industry exemplifies these challenges, where limited processing capabilities and unoptimized supply chains prevent capture of higher value-added opportunities in carrageenan and agar production[2]. In early 2025, monsoon failures in Rajasthan, India's primary production hub, also led to a surge in guar gum prices. This incident underscored the concentration risk tied to botanicals reliant on single-origin geographies. Buyers of carrageenan, facing this climate-related supply shock, opted for inventory drawdowns over reformulation. This choice highlighted that the costs of switching often surpass short-term price premiums. Production costs for corn-derived xanthan gum closely follow glucose syrup prices, which are, in turn, influenced by global maize markets. This creates a transmission mechanism where mandates for biofuels and demand for livestock feed have indirect repercussions on hydrocolloid economics. Forward contracting is becoming standard practice for high-volume buyers, yet this risk management tool is unavailable to small and medium food manufacturers who lack the balance sheet capacity to commit to annual volumes, creating a bifurcated market where large players secure preferential pricing and supply assurance
Stringent additive regulations and ingredient perception issues
In 2025, the European Food Safety Authority tightened purity standards for food additives[3]. This move compelled hydrocolloid suppliers to enhance their filtration and purification methods. While larger players adapted, many smaller processors found the necessary capital investments daunting, leading some to exit the market and further consolidating supply among the industry's giants. Carrageenan, a widely used hydrocolloid, came under fire after social media campaigns linked it to digestive problems. Although peer-reviewed studies haven't substantiated these claims, the controversy swayed retailers to adjust their private-label specifications, leaning towards alternative stabilizers for their organic product lines. In 2024, the U.S. Food and Drug Administration issued guidance on "natural" claims, ruling that chemically modified hydrocolloids are ineligible for the "natural" label. This decision favored gum arabic and guar gum but sidelined carboxymethylcellulose and hydroxypropyl methylcellulose. Studies on consumer perceptions reveal a linguistic bias: hydrocolloid names derived from Greek or Latin roots, like carrageenan and xanthan, evoke more negative reactions than their common-language counterparts, such as guar gum and locust bean gum. This bias is swaying ingredient choices, regardless of functional performance. Furthermore, regulatory inconsistencies across markets compel multinational manufacturers to tailor their formulations to specific regions. This challenge intensifies with hydrocolloid specifications; for instance, food-grade carrageenan in Asia might need extra testing to align with European standards, potentially extending supply chain lead times by 8-12 weeks.
*Our forecasts treat driver/restraint impacts as directional, not additive. The impact forecasts reflect baseline growth, mix effects, and variable interactions.
Segment Analysis
By Type: Gelatin Dominance and Pectin Clean-Label Surge
Gelatin commanded a 22.30% market share in the year 2025, bolstered by its unique properties in gummy confections and dairy products. Its thermoreversible gelling and melt-in-mouth characteristics stand unrivaled by plant-based substitutes. Furthermore, gelatin's collagen-derived structure offers textural qualities that are hard for formulators to achieve with botanical hydrocolloids. Gelatin's animal-derived nature gives it an edge in markets prioritizing protein fortification over plant-based alternatives. This is especially true in sports and clinical nutrition, where amino acid profiles dictate product choices. Yet, as manufacturers pivot to cater to flexitarian and vegan consumers, gelatin's growth lags behind the broader market.
Pectin is set to expand at a 7.79% CAGR through 2031. Its growth is driven by its plant-based origin, allowing for "no artificial ingredients" claims that fetch a price premium in North American retail. Once limited to jams and jellies, pectin is now making inroads into dairy alternatives and confectionery applications. Health-conscious consumers, who meticulously examine ingredient lists, are the primary audience for pectin's clean-label advantage. This demographic closely aligns with organic and non-GMO buyers, often willing to pay a premium for perceived naturalness. Innovations in pectin extraction and modification are producing grades with enhanced heat stability and calcium reactivity. These advancements are overcoming previous formulation constraints tied to specific pH and temperature ranges.

By Form: Powder Economics and Liquid Efficiency Gains
In 2025, powder formulations captured a dominant 71.44% of the market share, thanks to their lower shipping costs, extended shelf life, and compatibility with existing dry-blending infrastructures in food plants. The flexibility of powder formulations, allowing for batch-to-batch adjustments, further cements their dominance. Unlike liquid systems, which require maintaining multiple SKU inventories, powder blending offers greater adaptability. Powder hydrocolloids seamlessly integrate into standardized quality control protocols, such as moisture content testing and microbial screening. Powder forms shine in applications needing long-term storage or seasonal formulation variations. Dry ingredients boast stability for 18-24 months, outpacing the 6-9 month stability of liquid concentrates, even under refrigeration.
Liquid concentrates are on the rise, growing at a 6.54% CAGR. Manufacturers are prioritizing labor savings and dust control, even if it means overlooking raw material costs. This trade-off proves economically sound when production volumes are high enough to amortize the costs of hydration equipment and floor space. Dairy plants are increasingly turning to liquid carrageenan and pectin. These liquid forms sidestep the sanitation challenge of powder residues in mixing tanks, a hurdle for clean-in-place systems. Moreover, they consume less water in cleaning cycles. Adoption of liquid forms is notably among multinational manufacturers, especially those near hydrocolloid production sites.
By Source: Botanical Leadership and Microbial Innovation
Botanical sources commanded a 53.45% market share for the year 2025, driven by ingredients like guar gum, locust bean gum, pectin, and gum arabic. These plant-derived ingredients resonate with clean-label positioning but tether supply to agricultural cycles. Consumer preference leans towards recognizable ingredient origins. Marketing research consistently highlights that messaging "derived from plants" boosts purchase intent more than "produced through fermentation," even if the latter boasts superior sustainability metrics. This connection, influenced by climate variability, introduces price volatility that manufacturers find challenging to hedge. Guar gum, predominantly sourced from Rajasthan, India, faces geographic risks. Yet, alternative regions in Pakistan and Africa struggle to match the yield consistency of Indian production. Civil conflicts and climate-induced desertification threaten its production continuity, prompting some manufacturers to consider synthetic emulsifiers as backup options, despite the clean-label trade-offs.
Forecasted to grow at a 5.95% CAGR through 2031, microbial fermentation offers unmatched production consistency and potential for genetic optimization. These advantages, unattainable through botanical extraction, are crucial for food manufacturers aiming to minimize formulation variability. Xanthan gum and gellan gum, both derived from fermentation, are reaping benefits from strain engineering advancements. The regulatory landscape for fermentation-derived ingredients is solidifying. FDA and EFSA (European Food Safety Authority) approvals for precision fermentation proteins set a precedent that hydrocolloid producers can leverage for their own GRAS (Generally Recognized As Safe) notifications and novel food applications.
By Application: Bakery Dominance and Dairy Innovation
In 2025, bakery and confectionery applications accounted for 28.77% of hydrocolloid demand. This leading position stems from hydrocolloids' pivotal roles in extending shelf life, enhancing moisture retention, and crafting indulgent textures in cakes, cookies, and candies. Such attributes drive repeat purchases in impulse-driven categories. Bakery manufacturers are increasingly leveraging hydrocolloids to cut sugar and fat content while preserving sensory qualities. This reformulation push aligns with government-mandated nutritional labeling and industry commitments to bolster public health. Meanwhile, confectionery innovations are targeting texture-modified products for both the elderly and children. Here, hydrocolloids play a crucial role in crafting softer, chew-friendly formats, broadening the demographic appeal beyond traditional segments.
Dairy and dessert applications are projected to grow at a 6.77% CAGR through 2031. This growth is fueled by the rise of plant-based yogurt and ice cream formulations. These alternatives rely on stabilizer systems to mimic the structure and mouthfeel typically provided by milk proteins and fats in conventional dairy. Manufacturers are reformulating dairy desserts, swapping out gelatin for carrageenan and pectin. Such positioning not only commands premium pricing but also broadens market reach. Ice cream producers are turning to combinations of locust bean gum and guar gum to manage ice crystal growth during freeze-thaw cycles. This control is especially crucial for home storage, where temperature fluctuations exceed those in commercial cold chains.
Geography Analysis
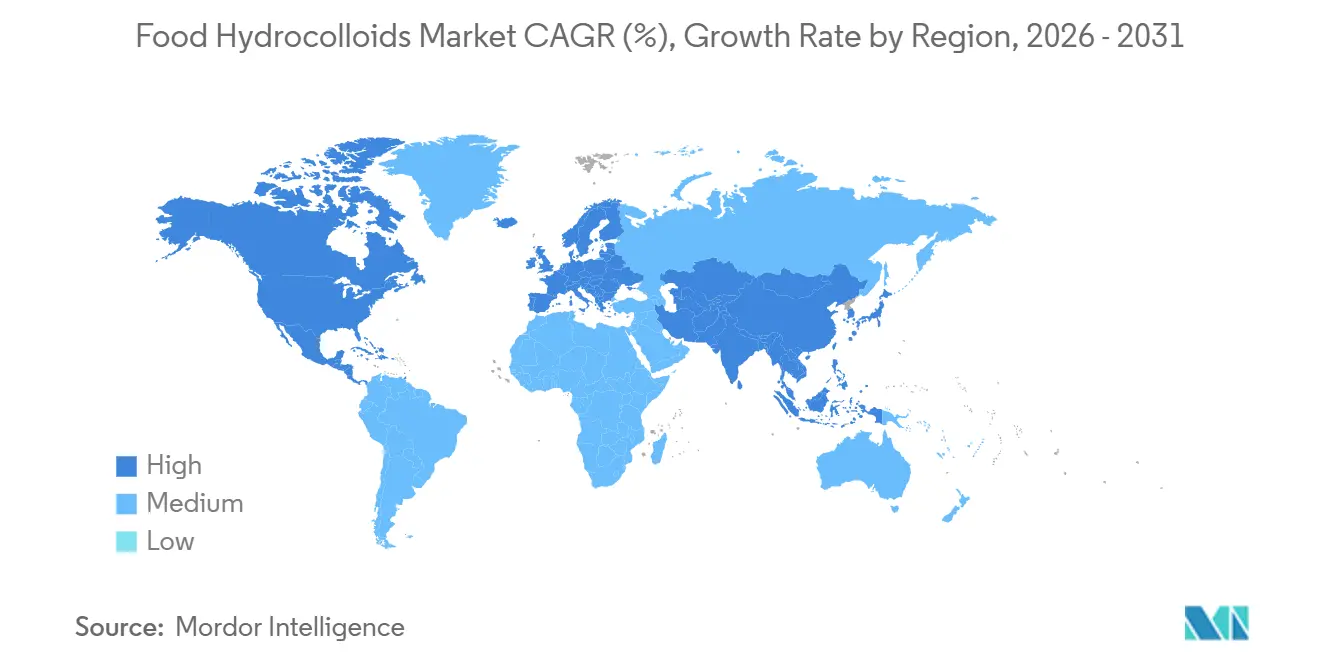
In 2025, North America commanded a dominant 33.45% share of the market revenue. This leadership can be attributed to the region's hub of food ingredient innovation, expedited FDA GRAS approval processes, and consumers' readiness to pay a premium for functional benefits in packaged foods. The United States has taken the lead with its advanced clean-label movement, driving demand for hydrocolloids. Meanwhile, Canada's plant-based food sector is outpacing the United States fueled by government dietary guidelines advocating a reduction in animal protein consumption. In Mexico, as rising incomes and urbanization tilt consumption towards packaged goods, the processed food industry is expanding. However, the market's price sensitivity leans towards more affordable hydrocolloids, such as modified starches, rather than premium choices like gum arabic and agar.
Asia-Pacific is set to lead with a projected CAGR of 7.25% through 2031, driven by China's modernization of food safety standards, the growth of organized retail in India, and the youthful demographics coupled with increasing disposable incomes in Southeast Asia. China's 2025 revisions to its food additive standards aligned more closely with international hydrocolloid specifications. This move alleviated the regulatory challenges that once compelled multinationals to create unique formulations for the Chinese market. Major seaweed producers, Indonesia and the Philippines, are enhancing their domestic capabilities by processing carrageenan and agar. This vertical integration not only amplifies regional value capture but also diminishes reliance on exports.
Europe's stringent regulations, highlighted by EFSA's thorough evaluations of additives, set high entry barriers. Clean-label innovation is spearheaded by Germany and France. Post-Brexit, the UK has charted a regulatory course distinct from EU norms. This divergence presents challenges for hydrocolloid suppliers, who now face dual approval processes. In South America, Brazil and Argentina dominate the hydrocolloid landscape, primarily driven by their meat processing sectors' need for water and fat binding. The Middle East and Africa, while smaller markets, showcase significant growth potential. This is especially evident in halal-certified products, where alternatives to gelatin, such as agar and carrageenan, are carving out a larger market share. This trend is bolstered as Muslim-majority nations refine and elevate their food processing industries.
Regulatory Landscape
Food hydrocolloids are governed mainly under food additive frameworks that set identity, purity, and conditions of use, with the EU E-number system and the US FDA framework, including GRAS pathways and food additive petitions, serving as key references for multinational formulations. In the EU, the European Food Safety Authority (EFSA) re-evaluation program continues to tighten technical specifications and documentation requirements for additives used as thickeners, gelling agents, and stabilizers, with greater emphasis on contaminants, microbiological criteria, and traceability for seaweed- and botanical-derived gums.
A central anchor is Commission Regulation (EU) 2026/196, adopted in January 2026 and entering into force in February 2026. It amends specifications and usage provisions for core hydrocolloids, including carrageenan (E 407), locust bean gum (E 410), guar gum (E 412), gum arabic (E 414), xanthan gum (E 415), and pectins (E 440). The regulation also introduces heightened requirements for products for vulnerable populations and sets an August 2026 compliance milestone, pushing suppliers toward upgraded purification, test methods, and tighter ingredient documentation for EU-facing volumes.
Value Chain Analysis
The value chain runs from upstream biomass and carbohydrate inputs through extraction or fermentation, purification, blending, distribution, and application support. Upstream supply is split across (i) seaweed cultivation and primary processing for carrageenan, alginate, and agar, (ii) agricultural botanicals and tree exudates for guar gum, pectin, and gum arabic, and (iii) microbial fermentation for xanthan and gellan gums that depends on sugar substrates, often corn-derived. Midstream players include integrated producers and specialist processors that carry out extraction or fermentation, filtration, drying, which is predominantly geared to powder formats, and standardization. Downstream, compounders and ingredient solution houses blend hydrocolloids with complementary texturants to hit application-specific targets in bakery, dairy, beverages, and confectionery.
Quality and regulatory compliance influence both flows and margins across the chain. Suppliers align with GFSI-recognized schemes such as ISO 22000 and FSSC 22000, while meeting market-specific additive rules, including FDA provisions such as 21 CFR 172.695 for xanthan gum, alongside EU additive and contaminant limits. Recent portfolio moves also reinforce the importance of technical-grade blending and application support for differentiation, rather than commodity supply alone. For example, Jungbunzlauer expanded its texturants portfolio with low-acyl gellan gum (TayaGel LA) showcased in July 2025, reflecting continued value capture in customized systems.
Competitive Landscape
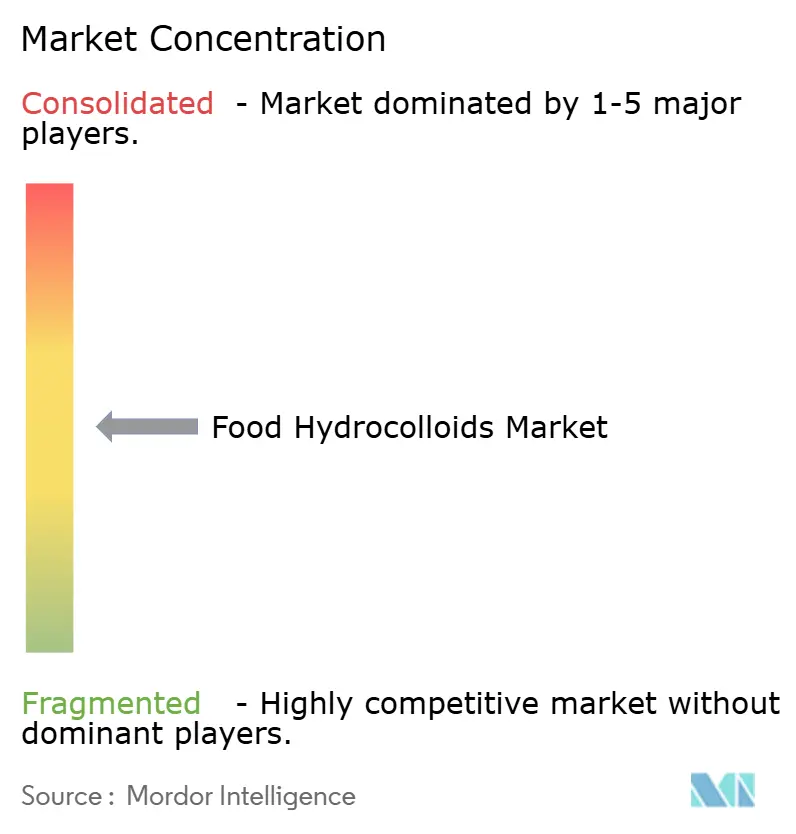
The food hydrocolloids market is characterized by a moderate concentration. Global ingredient conglomerates dominate high-volume commodity segments, while specialized processors carve out niches in technical grades and application-specific formulations. Cargill, Incorporated, Tate & Lyle PLC (CP Kelco), and Archer Daniels Midland, through vertical integration in livestock rendering and corn wet milling, have secured a dominant position in the supply of hydrocolloids. This strategy affords them cost advantages that smaller players, lacking comparable scale in upstream raw materials, find hard to match. Meanwhile, Kerry Group and DSM-Firmenich are adopting a distinct approach.
They bundle hydrocolloids with complementary ingredients such as flavors, proteins, and vitamins, crafting integrated solutions. This strategy not only elevates customer switching costs but also pivots competition from mere pricing to enhanced technical service capabilities. Suppliers offering pilot plant testing, regulatory documentation, and sensory optimization are reaping higher margins compared to those merely distributing undifferentiated ingredients. Emerging white-space opportunities lie in precision fermentation-derived hydrocolloids. Startups are harnessing engineered microorganisms to produce traditionally plant-sourced gums, boasting superior purity and consistency. If these production costs achieve commercial viability through scaling, they could disrupt existing botanical supply chains.
Patent analyses indicate a trend: innovation is gravitating towards hydrocolloid blends and advanced delivery systems, rather than entirely new molecules. Given that most traditional hydrocolloids are off-patent, the competitive focus has shifted. It's now more about application expertise than the molecular composition. This evolution benefits companies with robust technical service divisions, overshadowing those that prioritize manufacturing efficiency. The most intense competition is observed in xanthan gum. An expansion of fermentation capacity in China has led to a global oversupply, squeezing margins. In response, Western producers are prioritizing quality certifications, like ISO 22000, and ensuring supply reliability. This strategy resonates with risk-averse food manufacturers, especially those who've faced past supply disruptions.
Food Hydrocolloids Industry Leaders
-
Archer Daniels Midland Company
-
Kerry Group plc
-
International Flavors and Fragrances Inc.
-
Cargill, Incorporated.
-
Tate & Lyle
- *Disclaimer: Major Players sorted in no particular order
Market Opportunities and Future Outlook
Clean-label reformulation and premiumization are pushing purchases toward traceable, application-specific hydrocolloid systems. EU regulatory tightening for foods for vulnerable populations, including infant and special medical uses, raises the bar for high-purity grades and documentation-ready supply chains. This favors producers with purification capability and validated test methods for the gums and pectins covered under the latest EU specification updates.
Supply security and cost-to-serve improvements are also being pursued through upstream control and manufacturing efficiency upgrades. In April 2026, Cargill completed a EUR 25 million upgrade at its Baupte, France, hydrocolloids site using Mechanical Vapor Recompression technology to improve efficiency and reduce emissions, reinforcing continued investment in EU-based production resilience for carrageenan and xanthan gum. In July 2026, Nexira acquired Moroccan carob producer Keragum, which strengthens access, traceability, and processing control for locust bean gum and supports cleaner label positioning, while reducing exposure to raw material qualification lead times and volatility for food manufacturers.
Recent Industry Developments
- July 2026: Nexira completed the acquisition of Moroccan carob producer Keragum, expanding access to locust bean gum and strengthening processing control across the carob supply. The deal enhances supply chain visibility and supports cleaner-label positioning for customers relying on carob-based gums.
- June 2026: International Flavors and Fragrances Inc. launched Danisco Grindsted DuoGel, a pectin-carrageenan stabilizer system for Europe, Middle East and Africa. The engineered system targets texture and stability challenges in plant-based gummies, signaling a shift toward multi-hydrocolloid solutions over single gums.
- May 2026: Archer Daniels Midland Company announced a USD 26 million investment to expand its Erlanger facility in Kentucky and increase product development capabilities by 40 percent. The investment strengthens local formulation and technical service capacity for North American food manufacturers.
Research Methodology Framework and Report Scope
Market Definition and Coverage
For this study, the food hydrocolloids market covers food-grade hydrocolloid ingredients used in food and beverage formulations for functions like thickening, gelling, stabilizing, and texture control. Values are counted at the first point of commercial sale of the ingredient into the food supply chain.
Scope exclusions: Pharmaceutical, cosmetic, and industrial-grade hydrocolloids are excluded from this sizing.
Segmentation Overview
- By Type
- Alginate
- Agar
- Pectin
- Guar Gum
- Locust Bean Gum
- Gum Arabic
- Gelatin
- Carrageenan
- Xanthan Gum
- Other Hydrocolloids
- By Form
- Powder
- Liquid
- By Source
- Botanical
- Microbial
- Animal
- Synthetic
- By Application
- Bakery and Confectionery
- Dairy and Desserts
- Beverages
- Meat and Meat Products
- Soups, Sauces and Dressings
- Other Applications
- By Geography
- North America
- United States
- Canada
- Mexico
- Rest of North America
- Europe
- Germany
- United Kingdom
- Italy
- France
- Spain
- Netherlands
- Poland
- Belgium
- Sweden
- Rest of Europe
- Asia-Pacific
- China
- India
- Japan
- Australia
- Indonesia
- South Korea
- Thailand
- Singapore
- Rest of Asia-Pacific
- South America
- Brazil
- Argentina
- Colombia
- Chile
- Peru
- Rest of South America
- Middle East and Africa
- South Africa
- Saudi Arabia
- United Arab Emirates
- Nigeria
- Egypt
- Morocco
- Turkey
- Rest of Middle East and Africa
- North America
Data Sources, Market Sizing, and Validation
Desk Research
Desk research starts with building a clear map of which food-grade hydrocolloids are traded and produced, and where demand is concentrated by food processing activity. We typically rely on public sources such as FAO food processing indicators, UN Comtrade trade statistics for relevant ingredient codes, national agriculture and food safety agencies, and customs and tariff schedules that help interpret cross-border flows.
To keep assumptions realistic, we also review sources such as peer-reviewed food science journals on usage rates in key applications, hydrocolloid and seaweed trade associations for supply-side context, and company annual reports or investor decks for business mix signals. In parallel, we use paid subscriptions for company financials and intelligence, patent databases, and an import and export shipment-level database to cross-check shipping lanes and ingredient movements. The desk sources referenced above are illustrative and not exhaustive, and many other public and paid references were used for data collection, validation, and clarification.
Primary Interviews and Surveys
Primary work is used to pressure-test the demand pool and pricing logic with people who sit close to purchasing and formulation decisions, as well as distributors and ingredient suppliers active across major regions. We also use these discussions to confirm typical inclusion boundaries (food-grade only, ingredient revenue only), and to fill gaps where trade data or public disclosures do not separate hydrocolloids cleanly from adjacent food additives.
Distribution of primary research fieldwork respondents
| Company type | Respondent position | Region |
|---|---|---|
| Top tier: 36% | CXOs: 18% | APAC: 39% |
| Mid tier: 46% | Functional/Unit leaders: 37% | EMEA: 36% |
| Smaller Players: 18% | Managers: 45% | Americas: 25% |
Market-Sizing & Forecasting
Sizing is built using a top-down approach where food processing output, trade flows of key hydrocolloid inputs, and application-level usage patterns are combined to reconstruct an addressable ingredient demand pool by region. Once that demand pool is established, it is translated into value using observed price ranges, typical product mix, and the most common purchase unit for hydrocolloids (generally sold as food-grade powders and blends).
Selective bottom-up checks are then used to keep totals grounded, including sampled supplier revenue splits, channel checks on distributor throughput, and sanity checks using price per kg ranges against implied volumes. Key inputs that are tracked in the model include processed food production growth, clean-label reformulation intensity, relative pricing of seaweed and fermentation-based gums, application mix shifts in dairy, bakery, and beverages, and import dependence for regions with limited local production. When a country-level split is not directly available, gaps are handled through proxy indicators such as food manufacturing value add and trade intensity, followed by validation through primary feedback.
For forecasting, scenario analysis is used so that upside and downside cases can be expressed around raw material availability, price volatility, and substitution between hydrocolloid types. The final forecast path is anchored to the base case that most interviewed stakeholders considered practical for procurement and product planning.
Data Validation & Update Cycle
Model outputs are checked against independent signals, like whether implied consumption trends align with processed food growth and whether price assumptions match what buyers report for recent contracts. Large jumps are flagged, then reviewed across regions and hydrocolloid categories so that outliers from one data series do not drive the total on their own.
Before sign-off, the work is reviewed in steps so that definitions, conversions, and year mapping are consistent across the full dataset. Reports are refreshed annually, and interim updates are made when material events occur, such as sharp raw material price movements or major regulatory changes affecting food additive usage. Right before delivery, we perform a final pass to incorporate the latest public updates and any late primary clarifications.
Mordor Intelligence's Global Food Hydrocolloids Market Market Size Measured Against Other Published Estimates
Published market sizes for food hydrocolloids often do not line up because the market boundary is not always treated the same way, and because pricing and mix assumptions vary by region and by hydrocolloid type. Differences also come from the timing of currency conversion, whether blended stabilizer systems are counted, and how strictly non-food grades are filtered out.
By tracking food processing output, trade-linked availability, and application-level usage rates, Mordor Intelligence keeps the 2026 total aligned to food-grade ingredient revenue at first commercial sale, which helps avoid mixing in finished food value or non-food applications.
Benchmark comparison
| Source | Market Size | Gaps in Research Methodology |
|---|---|---|
| Mordor Intelligence | USD 11.60 B (2026) | |
| Global Consultancy A | USD 7.90 B (2026) | Uses a narrower included basket and tends to separate out parts of blended stabilizer systems, which reduces counted ingredient revenue even when functional hydrocolloids are present in the blend. |
| Regional Consultancy B | USD 11.73 B (2024) | Anchors on an earlier base year and applies a different pricing and mix curve, which can shift the implied 2026 level depending on how fast seaweed and fermentation-based gums are assumed to reprice. |
Taken together, the spread is mainly explained by scope boundaries and the way price and mix are carried forward across years. Our checks stay traceable because each step connects back to observable demand indicators and straightforward value conversion, and then gets confirmed through interviews before totals are finalized.
Key Questions Answered in the Report
What is the current size of the hydrocolloids market and how fast is it growing?
The hydrocolloids market is valued at USD 11.60 billion in 2026 and is projected to reach USD 15.44 billion by 2031, reflecting a 6.01% CAGR.
Which hydrocolloid type leads the market today?
Gelatin holds the largest share, accounting for 22.30% of global revenue in 2025 due to its wide use in pharmaceuticals, confectionery, and traditional food applications.
Which hydrocolloid segment is expanding the fastest?
Pectin’s plant origin, circular economy sourcing from citrus and apple side streams, and suitability for low-sugar and plant-based products support a 7.79% CAGR to 2031.
Which region offers the highest growth potential for hydrocolloid suppliers?
Regulatory modernization in China, retail expansion in India, and seaweed investment in Southeast Asia combine for a 7.25% regional CAGR through 2031 for Asia Pacific.