
Market Overview
| Study Period | 2023 - 2031 |
|---|---|
| Market Size (2026) | USD 9.7 Billion |
| Market Size (2031) | USD 12.07 Billion |
| Growth Rate (2026 - 2031) | 4.49 % |
| Fastest Growing Market | Asia-Pacific |
| Largest Market | North America |
| Market Concentration | Medium |
Major Players *Disclaimer: Major Players sorted in no particular order Image © Mordor Intelligence. Reuse requires attribution under CC BY 4.0. | |
Fluoroscopy Market Analysis by Mordor Intelligence
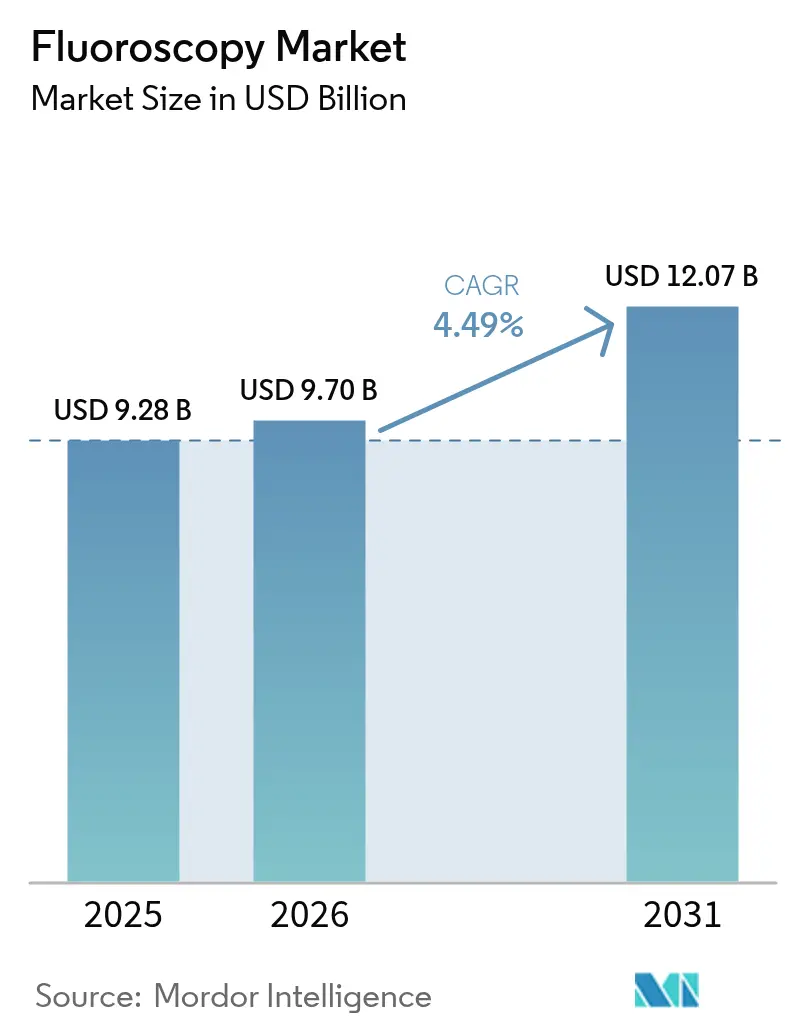
The fluoroscopy market size is expected to grow from USD 9.28 billion in 2025 to USD 9.70 billion in 2026 and is forecast to reach USD 12.07 billion by 2031 at 4.49% CAGR over 2026-2031. Real-time X-ray guidance remains core to interventional cardiology, orthopedic surgery, and pain management, while dose-reduction pressure is accelerating flat-panel detector adoption with advanced noise suppression. Vendors are emphasizing image quality at lower exposures, tighter integration with hospital IT, and workflow tools that shorten setup time in hybrid operating rooms and ambulatory environments. Hardware continues to anchor revenue, but expanded use of single-use consumables in infection-sensitive settings is shifting wallet share within the fluoroscopy market. Interoperability across PACS, dose-management, and visualization platforms is now a purchase requirement in multi-vendor imaging departments, which supports software and services growth within the fluoroscopy market. Regulatory standards and reimbursement dynamics remain significant, shaping product roadmaps and care-setting migration in 2025.
Key Report Takeaways
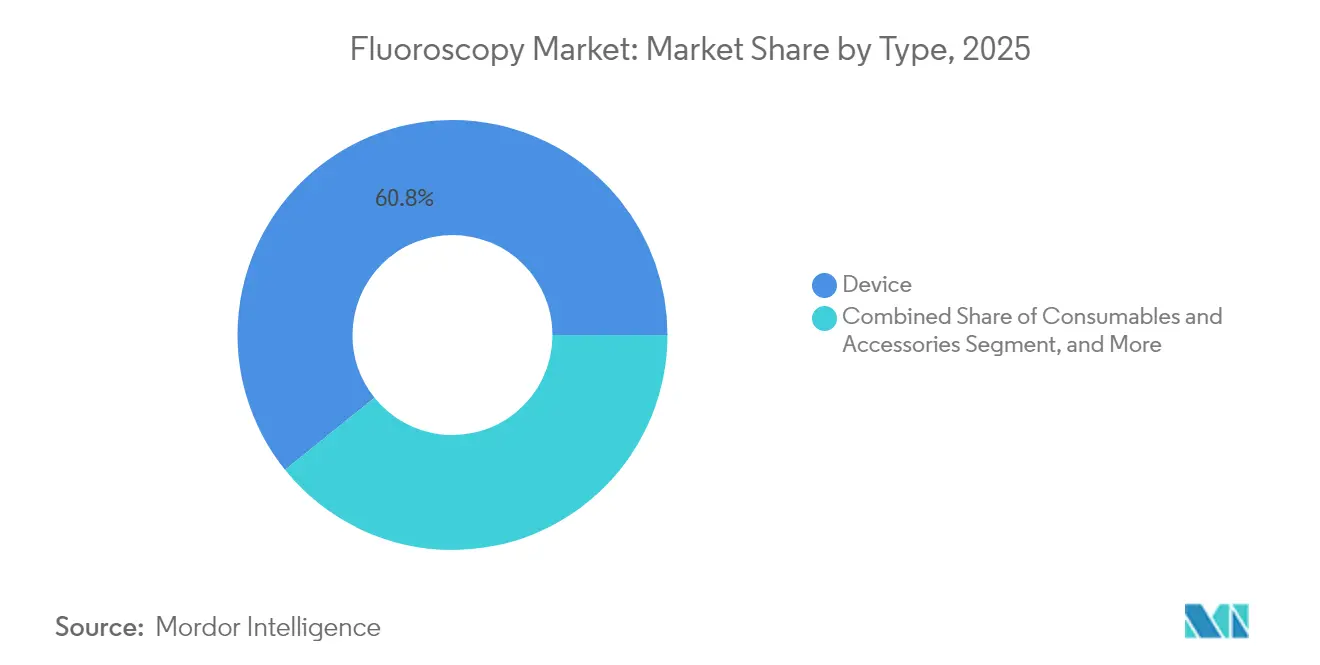
- By type, device hardware held a 60.78% fluoroscopy market share in 2025. Consumables and accessories are forecast to expand at a 6.43% CAGR to 2031.
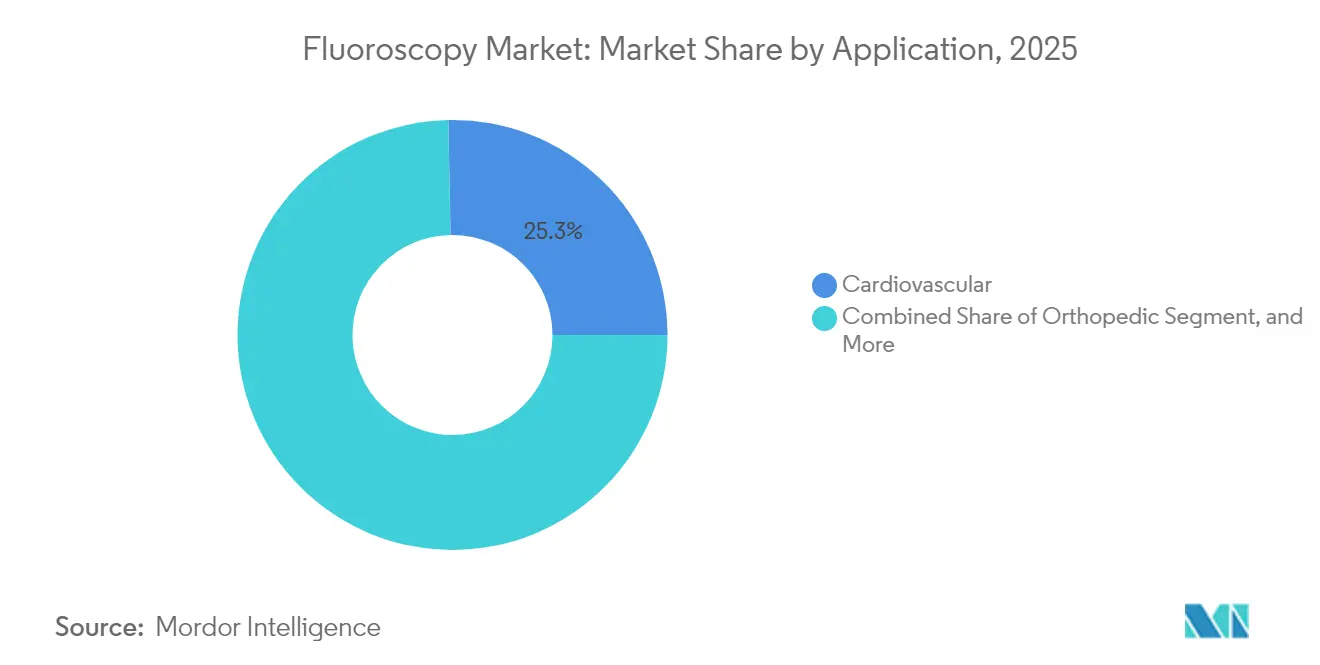
- By application, cardiovascular applications accounted for a 25.31% share of the fluoroscopy market size in 2025. Pain management and trauma imaging record the highest projected growth at a 6.75% CAGR through 2031.
- By end user, hospitals retained a 60.02% revenue share in 2025. Ambulatory surgical centers are projected to grow at a 7.18% CAGR through 2031.
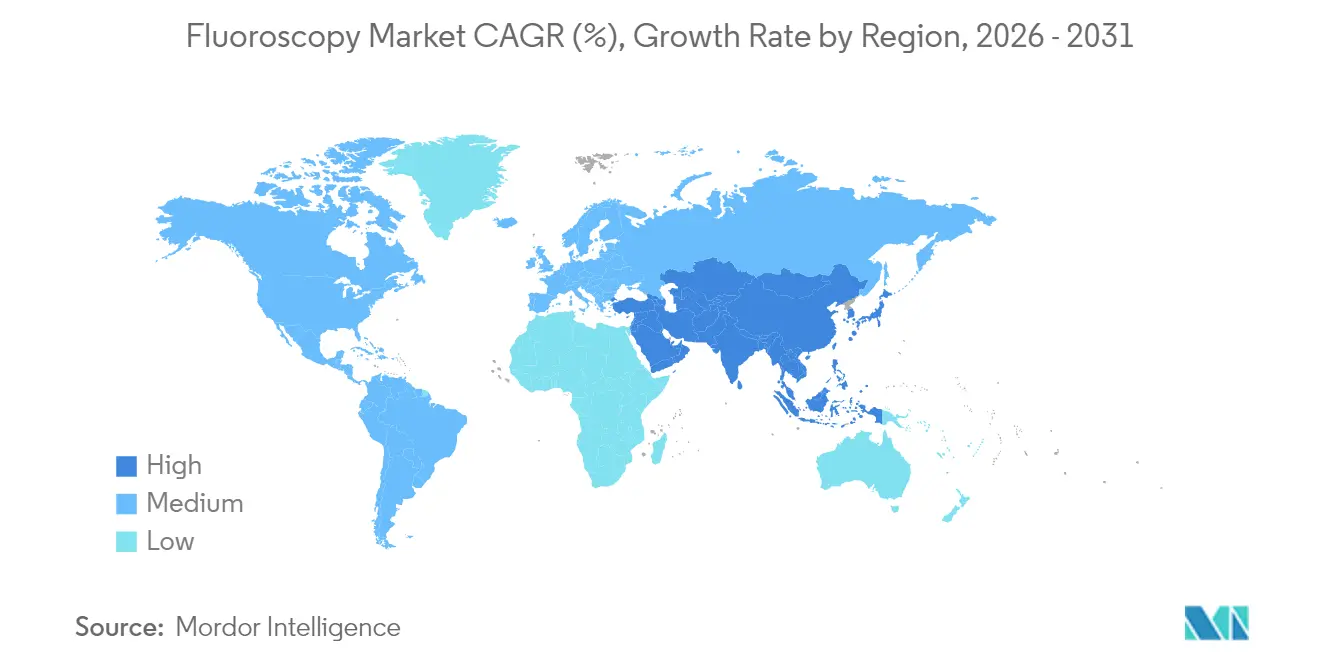
- By geography, North America led with a 43.90% share of the fluoroscopy market size in 2025. Asia-Pacific is projected to grow at a 5.34% CAGR through 2031.
Note: Market size and forecast figures in this report are generated using Mordor Intelligence’s proprietary estimation framework, updated with the latest available data and insights as of 2026.
Market Trends and Insights
Drivers Impact Analysis of Fluoroscopy Market*
| Driver | % Impact on CAGR Forecast | Geographic Relevance | Impact Timeline |
|---|---|---|---|
| Rising prevalence of chronic diseases | + 1.2% | Global, concentrated in North America & Europe | Long term (≥ 4 years) |
| Growing demand for minimally invasive and image-guided surgeries | + 1.4% | Global, with early gains in North America, Western Europe, urban China | Medium term (2-4 years) |
| Advancements in fluoroscopy technology and dose-reduction methods | + 0.9% | North America, Europe, Japan, South Korea | Medium term (2-4 years) |
| Increasing aging population requiring procedures | + 1.1% | Global, peak impact in Japan, Europe, North America | Long term (≥ 4 years) |
| Expansion of healthcare infrastructure in emerging economies | + 0.8% | APAC, MEA, Latin America | Medium term (2-4 years) |
| Integration with other imaging modalities and visualization | + 0.6% | North America, Western Europe, advanced APAC markets | Short term (≤ 2 years) |
| Source: Mordor Intelligence | |||
Rising Prevalence of Chronic Diseases Such as Cardiovascular and Orthopedic Conditions
Ischemic heart disease and osteoarthritis together affect a very large global population, sustaining steady demand for catheter-based cardiovascular interventions and fluoroscopy-guided joint injections within hospitals and ambulatory surgical centers[1]. Percutaneous coronary intervention volumes in the United States remain high, and case complexity continues to increase as physicians address chronic total occlusions and bifurcation lesions that require biplane fluoroscopy and rotational angiography in advanced labs. Orthopedic trauma procedures for older patients, including hip fracture fixation, depend on intraoperative C-arm imaging for guide-wire placement and fracture alignment checks, which sustains high utilization across Level I trauma centers. Rising diabetes prevalence, at more than 500 million adults globally, accelerates peripheral artery disease caseloads, increasing the frequency of below-the-knee angioplasty under fluoroscopic guidance. Regulatory frameworks such as the FDA 510(k) pathway and EU MDR certification establish dose-output and image-quality thresholds, which push manufacturers toward cesium-iodide flat-panel detectors and improved image processing in the fluoroscopy market.
Growing Demand for Minimally Invasive and Image-Guided Surgeries
Surgeons performing endovascular aneurysm repair, kyphoplasty, and transforaminal epidural steroid injections rely on real-time fluoroscopic visualization to navigate devices through vascular or spinal anatomy, which keeps the fluoroscopy market central to interventional workflows. Reimbursement models in the United States and parts of Europe encourage outpatient settings when clinically appropriate, which supports ambulatory surgical centers as they acquire mobile C-arms with motorized positioning and touchless controls that reduce setup time and room turnover. Cone-beam CT on advanced C-arms now enables intraoperative cross-sectional confirmation for spine and orthopedic procedures, which reduces transfers to CT suites and supports same-day discharge pathways. Interventional radiologists optimize dose with pulsed fluoroscopy at lower frame rates, which maintains procedural success and helps meet departmental dose-management goals[2]. Hybrid operating rooms increasingly adopt ceiling-mounted fluoroscopy systems that coordinate with anesthesia and echocardiography equipment through robotic articulation to manage complex structural heart procedures in a compact footprint.
Advancements in Fluoroscopy Technology Including Digital Flat-Panel Systems and Dose-Reduction Methods
Digital flat-panel detectors based on amorphous silicon and CMOS arrays have largely replaced image intensifiers in new installations, reducing distortion and improving spatial resolution that supports detailed vascular and orthopedic imaging in the fluoroscopy market. Dose-reduction features, including copper filtration, automatic exposure control, and real-time kV modulation, deliver substantial entrance-dose reductions relative to legacy systems, aligning with IEC 60601-2-43 requirements that emphasize safety for interventional X-ray equipment. Vendors are embedding AI-based denoising to maintain image clarity at low dose, which keeps fluoroscopy time short while preserving vascular edge definition in everyday procedures. Spectral or material-specific visualization modes are emerging on premium fixed platforms, enabling clinicians to selectively enhance contrast-agent signal in complex cases that benefit from better device and anatomy differentiation. Voice controls and wireless foot pedals reduce contact points and streamline sterile workflow, which aligns with infection prevention priorities in operating rooms.
Increasing Aging Population Requiring Diagnostic and Interventional Procedures
Adults aged 65 and older account for a disproportionate share of fluoroscopy-guided procedures because of the elevated incidence of atrial fibrillation, spinal stenosis, and peripheral vascular disease, which raises long-term demand across care settings. Japan anticipates that citizens over 75 will constitute near 20% of the population by 2030, which supports sustained utilization of vertebroplasty and other minimally invasive orthopedic interventions under fluoroscopy[3]. Hip fracture repair remains a standard indication for intraoperative C-arm use to confirm alignment and length during intramedullary nailing, supporting stable procedure volumes in trauma hospitals. Medicare coding supports fluoroscopy-guided pain procedures performed in outpatient settings, which sustains ASC adoption of mobile C-arms for spinal nerve blocks and sacroiliac joint injections. Coronary disease risk rises sharply with age, keeping diagnostic angiography and interventional stenting volumes steady in older populations as labs prefer biplane systems to limit contrast for patients with impaired renal function.
Restraints Impact Analysis of Fluoroscopy Market*
| Restraint | % Impact on CAGR Forecast | Geographic Relevance | Impact Timeline |
|---|---|---|---|
| Radiation-exposure & safety concerns | -0.8% | Global; stricter enforcement in developed markets | Short term (≤ 2 years) |
| High capital & lifecycle costs | -0.6% | Global; acute in emerging regions | Medium term (2–4 years) |
| Shortage of fluoroscopy-trained technologists | -0.5% | Developing regions | Medium term (2–4 years) |
| Modality substitution by ultrasound & intra-op CT | -0.3% | Global | Medium term (2–4 years) |
| Source: Mordor Intelligence | |||
High Cost of Fluoroscopy Equipment and Maintenance
Premium fixed systems with advanced features such as cone-beam CT, flat-panel detectors, and robotic positioning carry high list prices that exceed capital budgets in many public hospitals across resource-constrained regions, which complicates tender cycles and slows replacements in the fluoroscopy market. Maintenance contracts that include detector calibration, X-ray tube coverage, and software updates add recurring costs that some facilities defer, which contributes to unplanned downtime and delays in interventional schedules. Mobile C-arms vary widely in capability and price, which affects adoption among ambulatory surgical centers that operate on thin margins and must prioritize rapid return on investment. Refurbished systems lower acquisition costs, but limited warranties and fewer dose-optimization features can complicate compliance with updated safety standards that many regulators and hospital accreditors now reference. Leasing and pay-per-use models improve access but depend on reliable power, PACS connectivity, and trained service teams, which remain uneven in rural regions and can lower utilization for the fluoroscopy market in emerging economies.
Radiation Exposure Risks for Patients and Clinicians
Interventional cardiologists and radiologists accrue measurable occupational dose over large case volumes, with thyroid and lens exposure monitored closely against limits recommended by the International Commission on Radiological Protection, which drives adoption of protective barriers and personal shielding. Patient skin injuries are a recognized risk in prolonged or complex interventions, which reinforces dose-tracking practices and alerts that prompt technique adjustments when approaching reference levels during extended cases. Pediatric cases receive special attention as departments implement low frame-rate pulsed fluoroscopy, dose collimation, and filtration to limit exposure while maintaining clinical objectives. U.S. regulations such as 21 CFR 1020.32 require features like automatic brightness control and exposure timing for diagnostic X-ray systems, which reinforce consistent safety practices in U.S. labs using fluoroscopy. The European Basic Safety Standards Directive requires justification and optimization of every examination, so hospitals formalize protocols, record-keeping, and dose audits to demonstrate compliance for the fluoroscopy market.
*Our forecasts treat driver/restraint impacts as directional, not additive. The impact forecasts reflect baseline growth, mix effects, and variable interactions.
Fluoroscopy Market Segment Analysis
By Type:
Consumables Gaining Share Amid Single-Use Infection ControlDevice hardware held a 60.78% share of the fluoroscopy market in 2025, led by fixed fluoroscopy suites and mobile C-arms installed in interventional radiology, cardiology, and operating rooms. Fixed systems dominate complex procedures where biplane imaging and large flat-panel detectors are preferred, while mobile systems support orthopedic trauma and pain management where portability and smaller footprint matter in the fluoroscopy market. Mini C-arms priced well below full-size units continue to find traction in ambulatory centers for extremity imaging, supporting the outpatient migration. Consumables and accessories are projected to expand at 6.43% as facilities standardize single-use sterile drapes, radiation-shielding curtains, and contrast injectors to meet infection control and accreditation requirements. Dose-management platforms and advanced visualization software often launch as subscriptions, which expands the revenue pool beyond replacement cycles and strengthens service-led differentiation for the fluoroscopy market.
Consumables and accessories are expanding at a 6.43% CAGR through 2031, and the fluoroscopy market size for this category benefits from infection-prevention policies and standardized kits aligned to ASC workflows. Procurement teams evaluate ISO 13485-certified suppliers for disposable kits and device accessories, which reduces supply risk and aligns with hospital quality systems. On the device side, networked platforms must address cybersecurity guidance from the FDA, and many buyers now include cybersecurity questionnaires and software bill of materials in tenders for the fluoroscopy industry. As providers integrate more third-party analytics and navigation tools, interoperability and vendor-neutral service models are becoming differentiators in the fluoroscopy market.

By Application:
Pain Management Procedures Accelerating Faster Than CardiovascularCardiovascular applications accounted for 25.31% of demand in 2025, reflecting the central role of fluoroscopy in diagnostic angiography, percutaneous coronary intervention, and structural heart procedures performed in hybrid rooms. Pain management and trauma imaging are projected to grow at 6.75% CAGR, supported by ASC-centric workflows for epidural steroid injections, facet-joint denervation, and sacroiliac joint interventions that emphasize short setup times and efficient turnover in the fluoroscopy market. Orthopedic use cases, including intramedullary nailing and arthroscopy under X-ray guidance, remain steady as trauma volumes track urbanization and mobility patterns. Neurology relies on high-resolution flat panels for cerebral angiography and aneurysm coiling, while gastrointestinal fluoroscopy retains functional roles for barium studies even as cross-sectional imaging expands. Urology maintains niche utilization in nephrostomy and stenting procedures that remain concentrated in high-volume centers.
Cardiovascular applications commanded a 25.31% share of the fluoroscopy market size in 2025, while pain management and trauma procedures are on track to outpace cardiovascular through 2031 as ASCs scale image-guided care pathways. Elective cases continue to rebound in 2025, and hybrid operating rooms reinforce adoption of ceiling-mounted systems with 3D capabilities for complex structural interventions in the fluoroscopy market. ACR Appropriateness Criteria guide imaging modality selection and help clinicians justify fluoroscopy when dynamic imaging or device visualization is required, which supports consistent utilization across applications. As device navigation and dose-tracking tools improve, interventional teams gain confidence in maintaining low exposure without sacrificing accuracy, which supports broader adoption within the fluoroscopy industry.
By End User:
Ambulatory Surgical Centers Capturing Outpatient Volume ShiftHospitals retained a 60.02% end-user share in 2025 as they operate fixed fluoroscopy in interventional radiology suites, cardiac cath labs, and hybrid operating rooms for high-acuity cases needing intensive care backup. Ambulatory surgical centers are projected at a 7.18% growth rate as reimbursement parity expands for outpatient spine, pain, and peripheral vascular procedures under OPPS-linked schedules, which encourages procurement of advanced mobile C-arms and streamlined accessories in the fluoroscopy market. Diagnostic imaging centers capture consistent gastrointestinal and musculoskeletal volumes with lower overhead and faster reads, and they benefit from standardization of single-use supplies and dose-tracking software. Other end users include veterinary hospitals and mobile imaging providers that leverage mini C-arms and trailer-mounted units to extend access in rural areas, sustaining diversified demand for the fluoroscopy market.
Hospitals still anchor complex cases, but ASCs capture a rising share as case-mix shifts toward shorter, image-guided interventions in 2025. Certificate-of-Need rules in many U.S. states shape ASC expansion, and accreditation through the Joint Commission or AAAHC is a prerequisite for participation in Medicare networks. As compliance requirements deepen around radiation safety, dose management, and cybersecurity, procurement teams are prioritizing platforms with integrated reporting and secure connectivity. The resulting feature baselines enhance near-term growth for software and services at both hospitals and ASCs and sustain momentum for the fluoroscopy market. These dynamics continue to reinforce the outpatient migration trend within the fluoroscopy industry.
Geography Analysis
North America Fluoroscopy Market
North America held a 43.90% share of the fluoroscopy market in 2025, reflecting Medicare coverage for image-guided spinal procedures, a large installed base of fixed systems, and sustained procedure volumes in interventional cardiology and pain management. The United States drives most regional demand as hospital capital budgets normalize and hybrid OR construction picks up across cardiovascular and neuro service lines, which favors premium platforms and integrated software within the fluoroscopy market. Canada continues to upgrade analog systems installed before 2015 to meet dose-reduction guidance under Safety Code 35, and Mexico’s private sector expands capacity with refurbished mobile C-arms to support orthopedic trauma and medical tourism. FDA 510(k) clearances shape time-to-market for new models, and providers maintain consistent reliance on dose reporting and ACR-specified safety practices.
Europe Fluoroscopy Market
Europe is the second-largest region, supported by replacement cycles at the 10-year mark and heightened regulatory requirements under EU MDR that push vendors to refresh technical documentation and clinical evaluation for legacy systems in the fluoroscopy market. Germany, the United Kingdom, France, Italy, and Spain account for the majority of demand, with Germany’s hospital landscape procuring premium systems featuring cone-beam CT and robotic positioning for high-volume interventional suites. The United Kingdom’s NHS consolidates interventional radiology into regional hubs, which increases throughput in centers equipped with 3D navigation and advanced dose management. Rest of Europe adopts mobile C-arms in outpatient settings where orthopedics and pain procedures continue to grow, while the EU Basic Safety Standards directive drives standardized dose audits and formal optimization protocols across providers.
APAC, MEA and South America Fluoroscopy Market
Asia-Pacific is the fastest-growing region at a 5.34% CAGR through 2031, propelled by public investment programs that emphasize hospital capacity and equipment localization, which increases both entry-level and premium demand in the fluoroscopy market. China’s domestic manufacturers expand share in mobile C-arms through cost positioning, while multinationals maintain a lead in high-end fixed systems for tier-1 hospitals. Japan’s aging demographics sustain vertebroplasty and interventional cardiology volumes despite lengthening replacement cycles, and India’s private hospital chains expand cath labs in tier-2 cities with vendor financing that supports deferred payments. Australia upgrades platforms to align with national dose reference levels and South Korea reimburses image-guided spine procedures, which secures ASC adoption of mini C-arms. In the Middle East and Africa, the Gulf states build specialty hospitals with hybrid rooms and 3D navigation, while South Africa’s private sector replaces older analog units to align with radiation safety rules. In South America, Brazil’s public system deploys mobile C-arms to trauma centers, Argentina’s private clinics import systems under duty exemptions, and regional public hospitals procure entry-level platforms under PAHO guidance, which supports steady fluoroscopy market activity as workforce and supply-chain constraints improve.
Regulatory Landscape
Regulation in the fluoroscopy market is anchored on radiation-emitting performance and medical-device market-access rules that increasingly require auditable dose control. In the United States, fluoroscopic X-ray systems fall under FDA oversight (including 21 CFR 892.1650 for classification and performance standards for diagnostic X-ray systems under 21 CFR 1020.30-1020.33), which drives requirements for controls such as automatic brightness control and exposure timing features in clinical configurations.
In Europe, market access is governed by Regulation (EU) 2017/745 (EU MDR), while patient radiation protection is framed by the European Basic Safety Standards Directive 2013/59/Euratom. This framework pushes formal justification, optimization, and record-keeping around exposures. In March 2025, the European Commission (Directorate-General for Energy) published updated guidance supporting implementation of Directive 2013/59/Euratom, reinforcing the operational focus on monitoring and controlling patient radiation exposures in medical equipment such as fluoroscopy. Manufacturers also align design and test documentation to IEC standards (notably IEC 60601-2-43 for interventional X-ray equipment) and quality-system expectations such as ISO 13485 to reduce duplication across submissions and support multi-market deployments.
Value Chain Analysis
The fluoroscopy value chain begins with upstream components and subassemblies such as X-ray tubes and generators, flat-panel detectors (a-Si or CMOS), collimation and filtration hardware, mechanical gantries (C-arm, ceiling-mounted, or table-based), and embedded software for image processing and dose management. OEMs (including Siemens Healthineers, GE HealthCare, Philips, Canon Medical Systems, and Shimadzu) integrate these into fixed suites, mobile C-arms, and RF table systems. They then validate performance and safety against applicable standards and regulatory pathways, with software, cybersecurity documentation, and interoperability (PACS, dose reporting, and visualization tools) increasingly treated as part of core product release readiness.
Downstream, distribution and commercialization run through direct sales to hospital groups and IDNs, tender-based public procurement, and dealer networks serving ambulatory surgical centers and diagnostic imaging centers. Installation, applications training, and service contracts shape lifecycle economics, while the aftermarket includes tube and detector service, calibration, software updates, and accessories and single-use consumables (sterile drapes, shielding, injector-related items). As infection-control and accreditation requirements standardize kits, aftermarket categories are gaining more purchase visibility. Recent OEM activity also points to ongoing portfolio refreshes across the chain, including Shimadzu product releases in 2026 spanning mobile C-arms and conventional RF table systems and FDA-cleared ceiling-mounted fluoroscopy platforms, which highlights how OEM engineering and regulatory readiness keep channel inventory current.
Competitive Landscape
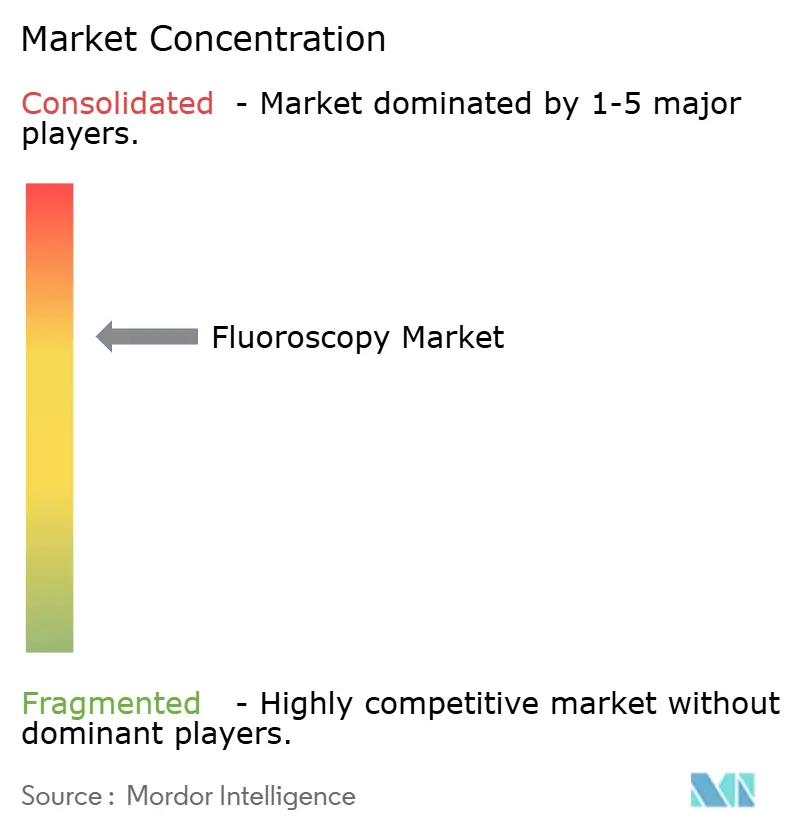
The fluoroscopy market shows moderate to high concentration as Siemens Healthineers, GE HealthCare, and Koninklijke Philips N.V. collectively hold around 55% of global device revenue based on extensive installed bases, multivendor service coverage, and integrated software subscriptions. These leaders emphasize dose-management integration with PACS and enterprise dashboards so hospitals track exposure and standardize protocols across interventional service lines, which reinforces lock-in within the fluoroscopy market. Canon Medical Systems and FUJIFILM Healthcare scale compact and rapid-setup mobile C-arms for space-constrained ASCs, and Hologic leverages women’s health channels to extend mini C-arm reach for orthopedic and pain procedures. Chinese vendors, including United Imaging Healthcare and Lepu Medical, drive price-sensitive tenders in Southeast Asia and Latin America with flat-panel mobile systems that expand access among public hospitals.
Product roadmaps feature integration with navigation and visualization partners so surgeons can overlay trajectory guidance, landmarks, and prior imaging during fluoroscopic procedures. In 2024 and 2025, several OEMs refreshed mobile C-arms with AI-based image enhancement, motorized positioning, and faster wireless workflows that compress setup times for orthopedic trauma and pain clinics in the fluoroscopy market. Strategic partnerships with academic medical centers focus on hybrid operating rooms that combine cone-beam CT and ceiling-mounted angiography to validate minimally invasive spine and neuro procedures under real-time 3D imaging.
Smaller players target niches to avoid direct head-to-head competition in high-volume cardiology and neurovascular segments. Orthoscan and other compact-system specialists serve extremity orthopedics, and select European mid-market brands grow in private clinics through distribution alliances and service differentiation inside the fluoroscopy market. As regulatory expectations rise for clinical evaluation, dose management, and cybersecurity, vendors highlight 510(k) clearances and CE certifications as key buying signals during tender evaluations.
Fluoroscopy Industry Leaders
-
Canon Medical Systems Corporation
-
Hitachi Medical Systems
-
Siemens Healthineers
-
Koninklijke Philips NV
-
GE Healthcare
- *Disclaimer: Major Players sorted in no particular order
Fluoroscopy Market Companies Covered in this Report
- Allengers Medical Systems
- Canon
- Carestream Health
- Eurocolumbus (Stephanix Group)
- FUJIFILM
- Fujifilm Healthcare (Mobile C-arms & RF)
- GE Healthcare
- Genoray Co. Ltd.
- Hologic
- Koninklijke Philips
- Lepu Medical
- Nanjing Perlove Medical
- Omega Medical Imaging
- Orthoscan
- Siemens Healthineers
- Shimadzu
- Skanray Technologies
- SternMed
- Trivitron Healthcare
- United Imaging Healthcare
Market Opportunities and Future Outlook
White-space is widening where providers need to increase procedure throughput while meeting stricter dose-monitoring expectations, which supports demand for dose-optimized imaging pipelines and integrated reporting that can be deployed consistently across hybrid ORs, cath labs, and outpatient rooms. Vendor releases and clearances show investment in this direction: Siemens Healthineers received FDA 510(k) clearance for Luminos Q.namix R and Luminos Q.namix T radiography and fluoroscopy systems (May 2026), Canon Medical Systems USA brought Adora DRFi to the US market after FDA 510(k) clearance (December 2024) with a March 2025 launch, and Shimadzu announced multiple 2026 introductions spanning mobile C-arms and a ceiling-mounted fluoroscopy system cleared via FDA 510(k). These launches align with procurement pathways that emphasize room utilization and standardized workflows rather than stand-alone, single-purpose fluoroscopy rooms.
Software-led opportunities are expanding as fluoroscopy purchasing criteria increasingly include interventional guidance, dose analytics, and workflow tools that reduce setup time and variability across staff skill levels. Philips activity in 2026 illustrates that direction: FDA 510(k) clearance for EchoNavigator R5.0 with DeviceGuide, plus launch of the IntraSight Plus interventional guidance platform, and the May 2026 introduction of SmartIQ (CE-marked for Europe and select markets) targeting the image-quality versus dose trade-off in coronary procedures. Equipment reliability and service responsiveness also remain a commercial differentiator, reinforced by April 2026 Class 2 recalls initiated for certain Philips Azurion, Allura, and Integris-Allura systems tied to degradation in CU3101 X-ray tube-cooling unit deaeration hoses (4,990 units), which raises buyer scrutiny around component quality, preventive maintenance programs, and uptime-focused service models.
Recent Industry Developments in Fluoroscopy Market
- May 2026: Philips introduced SmartIQ for coronary procedures at EuroPCR 2026, targeting improved image quality at lower radiation dose, with CE-marking for Europe and select markets. The staged regional availability underscores how CE-mark timing can accelerate feature adoption in Europe ahead of US clearance, shaping global launch sequencing for advanced fluoroscopy image-processing capabilities.
- July 2025: Siemens Healthineers received FDA clearance for the Luminos Q.namix R and Luminos Q.namix T multifunctional radiography and fluoroscopy platforms. The clearance strengthens Siemens positioning in hybrid rooms and multi-use imaging suites where providers prioritize utilization and workflow standardization over single-purpose installations.
- March 2025: Canon Medical Systems USA announced the US market launch of Adora DRFi, a hybrid radiography and fluoroscopy system, following December 2024 FDA 510(k) clearance. The move supports a room-consolidation purchasing model in which facilities combine static and dynamic imaging in one footprint to improve scheduling flexibility and capital efficiency.
Fluoroscopy Market Report Scope and Research Methodology
Market Definition and Coverage
This market covers revenues generated from fluoroscopy solutions used to create real-time X-ray imaging during diagnosis and procedures, including both fixed and mobile systems. It also includes related accessories, consumables, software, and services, measured on a global basis.
Scope exclusions: This sizing does not count broader diagnostic imaging modalities that do not use fluoroscopy, and it also excludes non-medical industrial fluoroscopy use cases.
Segments Covered in This Report
- By Type
- Device
- Fixed Fluoroscopes
- Mobile Fluoroscopes (Full-size, Mini C-arms)
- Consumables & Accessories
- Software & Services
- Device
- By Application
- Orthopedic
- Cardiovascular
- Pain Management & Trauma
- Neurology
- Gastrointestinal
- Urology
- Other Applications
- By End User
- Hospitals
- Ambulatory Surgical Centers
- Diagnostic Imaging Centers
- Others
- Geography
- North America
- United States
- Canada
- Mexico
- Europe
- Germany
- United Kingdom
- France
- Italy
- Spain
- Rest of Europe
- Asia-Pacific
- China
- Japan
- India
- Australia
- South Korea
- Rest of Asia-Pacific
- Middle East & Africa
- GCC
- South Africa
- Rest of Middle East & Africa
- South America
- Brazil
- Argentina
- Rest of South America
- North America
Data Sources, Market Sizing, and Validation
Desk Research
Desk research was used to build the basic demand and supply context before we finalized assumptions. Public sources such as the World Health Organization, the World Bank, the OECD, and national health ministries were reviewed to understand procedure intensity signals, care access, and hospital capacity trends that influence imaging utilization.
We also referred to sources such as the US FDA device databases, the European Commission medical device guidance, and peer-reviewed radiology and interventional journals to understand product approvals, safety standards, and adoption patterns, including dose reduction features and workflow integration. This was then supported by company annual reports, investor presentations, and credible press coverage to map product focus areas, regional exposure, and service mix, plus selective paid subscriptions for company financials, patent landscaping, and shipment-level trade checks where relevant. These desk sources are illustrative and not exhaustive, and many other public materials were also consulted for data collection, validation, and clarification.
Primary Interviews and Surveys
Primary work was used to pressure-test the model inputs that are usually not fully visible in public data, including typical replacement cycles, the configuration mix between fixed rooms and mobile systems, and the attach rate of software, services, and consumables. We spoke with a mix of manufacturers and channel participants, clinical users, hospital procurement teams, and imaging center administrators across major regions, so regional procedure patterns and purchasing constraints could be reflected in the final numbers.
Distribution of primary research fieldwork respondents
| Company type | Respondent position | Region |
|---|---|---|
| Top tier: 31% | CXOs: 16% | APAC: 41% |
| Mid tier: 52% | Functional/Unit leaders: 40% | EMEA: 35% |
| Smaller Players: 17% | Managers: 44% | Americas: 24% |
Market-Sizing & Forecasting
Market sizing started with a top-down build where procedure-linked imaging demand and healthcare delivery capacity were reconstructed by region, then translated into equipment and related revenue pools. To keep the model practical, we used inputs such as estimated fluoroscopy-guided procedure volumes by major application area, installed base replacement timing, average system pricing by fixed versus mobile setups, and the typical share of service contracts and software add-ons tied to new and existing systems.
After the first cut, selective bottom-up checks were used to corroborate totals, including sampled supplier revenue disclosures, channel feedback on unit movement, and ASP by configuration, which were then used to adjust outliers. Forecasting relied on scenario analysis supported by expert views on hospital capital spending, outpatient shift, and technology refresh drivers such as dose management and interoperability, which helps explain how growth differs across regions and end users. Where country data was thin, gaps were handled by proxy indicators such as hospital bed counts, imaging room density, and healthcare expenditure trends, followed by re-checks with primary respondents.
Data Validation & Update Cycle
Validation is done through multiple checks so the final figures stay consistent with real-world signals. We compare outputs against independent markers such as regional healthcare spending direction, imaging equipment procurement cycles, and reported capital budgets, then investigate any sharp variances before internal sign-off.
If an assumption shifts materially, such as a reimbursement change, a regulatory update, or a sudden supply constraint, analysts re-contact relevant experts and rerun the sensitivity ranges. Reports are refreshed annually, with interim updates when major events occur, and a final pre-delivery review is completed so clients receive the latest updated view.
Mordor Intelligence's Global Fluoroscopy Market Sizing Compared With Other Published Estimates
Published market values for fluoroscopy can differ quite a lot, even when they appear to cover the same topic. The main drivers are what each publisher counts inside the market, the base year used, and how pricing and service revenues are carried through the forecast.
Some estimates focus only on capital equipment sales, while others bundle adjacent imaging categories or apply a faster price growth curve without rechecking it against procurement reality. Differences also come from currency conversion timing, how fixed versus mobile configurations are weighted, and whether software, services, and consumables are treated as part of the market or left out.
Benchmark comparison
| Source | Market Size | Gaps in Research Methodology |
|---|---|---|
| Mordor Intelligence | USD 9.70 B (2026) | |
| Global Consultancy A | USD 2.20 B (2025) | Narrower scope that concentrates on fluoroscopy systems revenue, which typically excludes recurring streams like consumables, accessories, software, and service contracts that can be attached to installed equipment. |
| Industry Publisher B | USD 8.50 B (2025) | Different base year and equipment-centric framing, with limited clarity on whether services and software are consistently included across regions and whether ASP changes are validated against replacement-led purchasing. |
The table shows a wide spread, and in Mordor Intelligence's model the market includes fixed and mobile fluoroscopes plus consumables and accessories, software, and services, which pushes the total above system-only definitions. This keeps the assumptions tied to procedure use and replacement cycles, and when the scope and pricing logic are made explicit, it is easier to reconcile why one figure is smaller and another is closer, even before forecasting choices are considered.
Key Questions Answered in the Report
What is the current size and growth outlook for the fluoroscopy market?
The fluoroscopy market is valued at USD 9.70 billion in 2026 and is projected to reach USD 12.07 billion by 2031 at a 4.49% CAGR.
Which applications will grow the fastest within fluoroscopy through 2031?
Pain management and trauma imaging are projected to grow at a 6.75% CAGR, outpacing cardiovascular, supported by ASC adoption and workflow-friendly mobile C-arms.
Which region leads and which grows fastest in fluoroscopy?
North America led with a 43.90% share in 2025, while Asia-Pacific is projected to grow at a 5.34% CAGR through 2031.
How is the end-user mix shifting within fluoroscopy?
Hospitals held 60.02% in 2025, while ambulatory surgical centers are projected to grow at a 7.18% CAGR as outpatient reimbursement expands.
What technology trends are shaping new fluoroscopy systems?
Flat-panel detectors with AI-based denoising, dose-reduction features, CBCT integration, and tighter PACS and dose-management integration are shaping adoption and replacement decisions.
Who are the leading companies in the fluoroscopy market?
Siemens Healthineers, GE HealthCare, and Philips together held around 55% of global device revenue, supported by service contracts and software subscriptions.