
Fluid Power Equipment Market Size and Share
Market Overview
| Study Period | 2020 - 2031 |
|---|---|
| Market Size (2026) | USD 73.07 Billion |
| Market Size (2031) | USD 90.72 Billion |
| Growth Rate (2026 - 2031) | 4.42% CAGR |
| Fastest Growing Market | Asia Pacific |
| Largest Market | Middle East |
| Market Concentration | Medium |
Major Players *Disclaimer: Major Players sorted in no particular order Image © Mordor Intelligence. Reuse requires attribution under CC BY 4.0. | |
Fluid Power Equipment Market Analysis by Mordor Intelligence
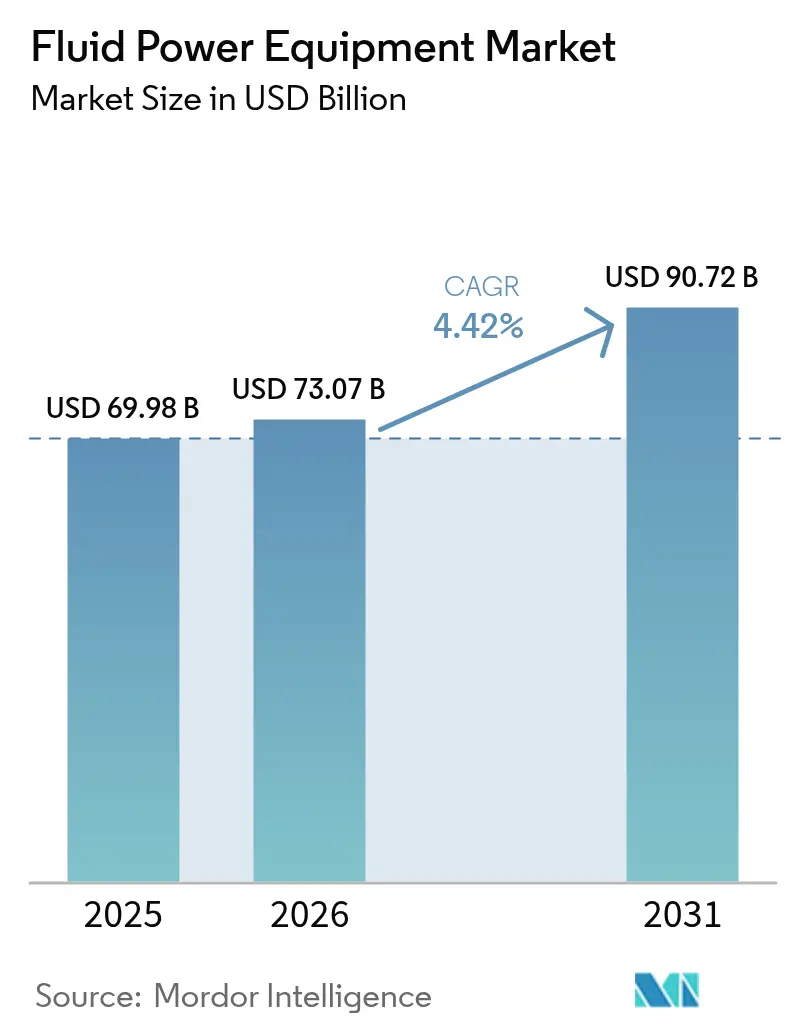
The fluid power equipment market size is expected to grow from USD 69.98 billion in 2025 to USD 73.07 billion in 2026 and is forecast to reach USD 90.72 billion by 2031 at 4.42% CAGR over 2026-2031. This outlook reflects resilient demand from construction, agriculture and smart manufacturing, alongside steady replacement cycles in mature industrial bases. Rising automation, tighter energy‐efficiency norms and broader electrification in off-highway machinery are sustaining component sales. Large vendors are protecting margins through cost discipline, higher value-added digital offerings and selective acquisitions. Meanwhile, aftermarket services are growing faster than original-equipment shipments as users extend asset lifetimes and adopt predictive maintenance.
Key Report Takeaways
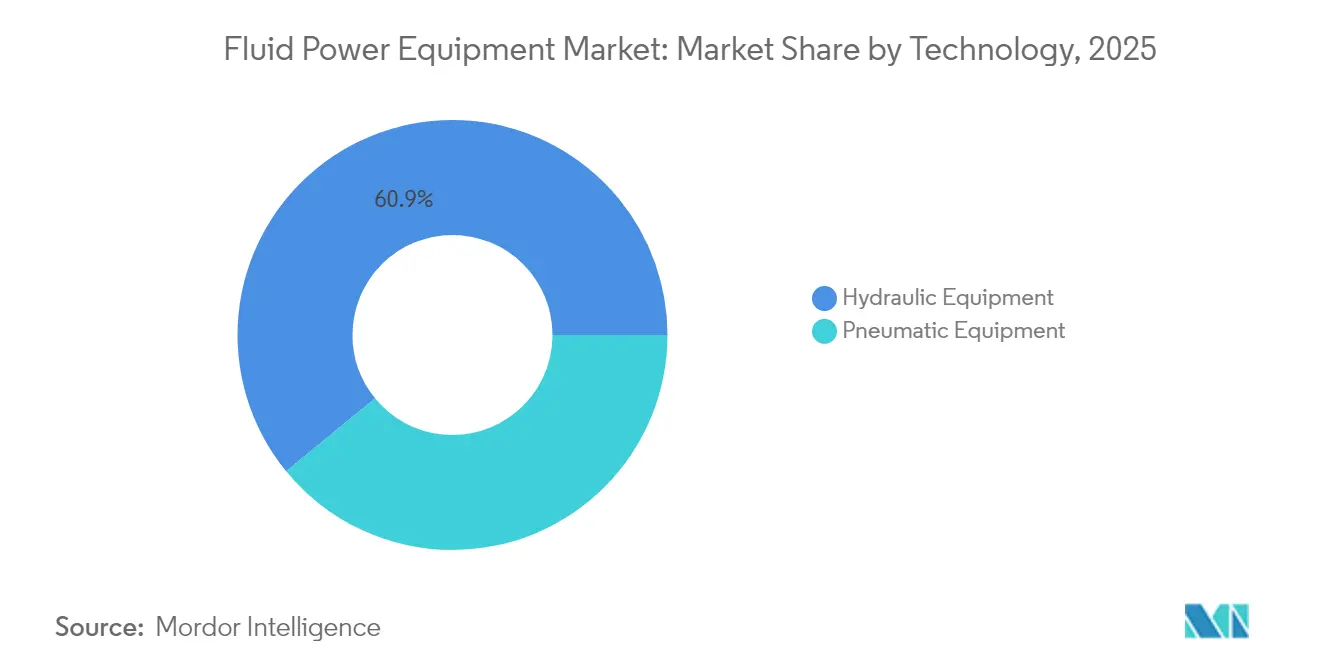
- By technology, hydraulic equipment accounted for 60.92% of 2025 revenue, while pneumatic equipment is projected to post the highest 4.69% CAGR to 2031.
- By product type, pumps led with 27.12% 2025 revenue, whereas accumulators and filters are expected to log a 5.52% CAGR through 2031.
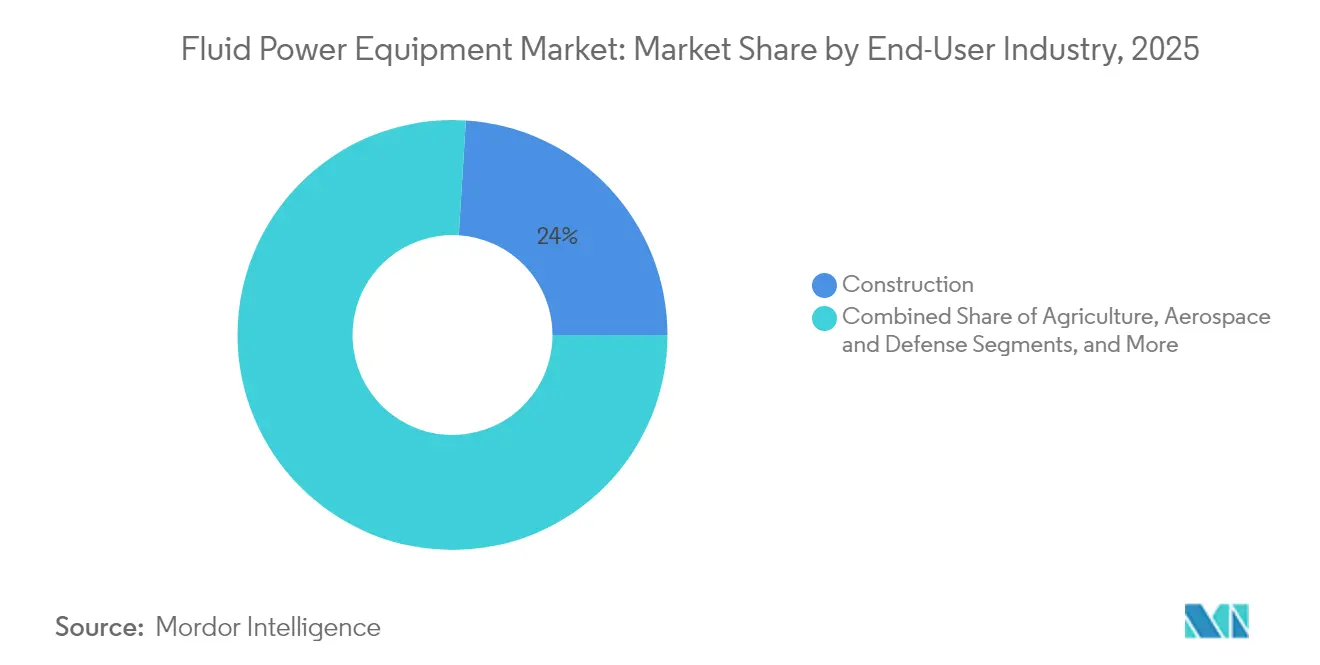
- By end-user industry, construction held 24.01% share in 2025, but agriculture is on track for the fastest 5.31% CAGR to 2031.
- By distribution channel, OEM routes retained 65.05% 2025 share, while the aftermarket is forecast to expand at a 5.58% CAGR.
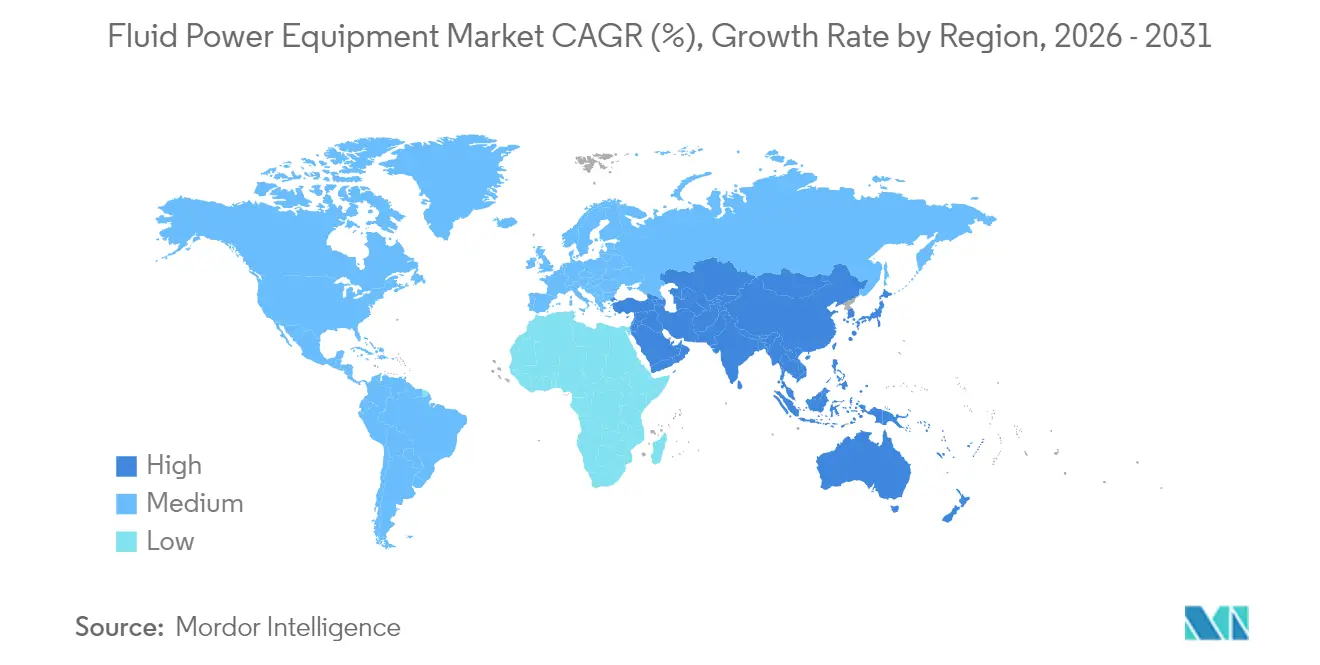
- By geography, Asia Pacific represented 34.10% 2025 revenue, and the Middle East is anticipated to grow at a 5.44% CAGR to 2031.
Note: Market size and forecast figures in this report are generated using Mordor Intelligence’s proprietary estimation framework, updated with the latest available data and insights as of 2026.
Global Fluid Power Equipment Market Trends and Insights
Drivers Impact Analysis*
| Driver | (~) % Impact on CAGR Forecast | Geographic Relevance | Impact Timeline |
|---|---|---|---|
| Energy efficiency and environmental considerations | +1.2% | Global – early gains in Europe and North America | Medium term (2-4 years) |
| Advances in industrial automation | +1.5% | Asia Pacific core, spill-over to North America and Europe | Short term (≤ 2 years) |
| Technical improvements in sealing and material science | +0.8% | Global | Long term (≥ 4 years) |
| Growing investments in off-highway electrification | +1.0% | North America and EU, expanding to Asia Pacific | Medium term (2-4 years) |
| Rising demand from smart manufacturing facilities | +1.3% | Asia Pacific and North America | Short term (≤ 2 years) |
| Hydrogen-ready pneumatics for clean-room operations | +0.4% | Europe and North America | Long term (≥ 4 years) |
| Source: Mordor Intelligence | |||
Energy Efficiency and Environmental Considerations
Regulations such as CARB Tier 5 and forthcoming EPA 2027 rules are accelerating the adoption of high-efficiency pumps, motors and valves in mobile and stationary equipment.[1]Association of Equipment Manufacturers, “Regulatory Issues,” aem.org Variable-speed drives paired with IE5 synchronous reluctance motors are cutting pump electricity use by up to 60 % in municipal water utilities. Digital hydraulic valves managed through pulse-width modulation are eliminating throttling losses, raising hydrostatic transmission efficiency by 15-36 %. Parker Hannifin aims to lower its operational carbon footprint 50 % by 2030, a target that underpins demand for its energy-optimized components. Combined, these forces lift the fluid power equipment market by driving retrofit and replacement activity across core applications.
Advances in Industrial Automation
Industry 4.0 architectures allow fluid power components to communicate operating parameters in real time, facilitating adaptive control and remote diagnostics. SMC Corporation’s OPC UA-enabled pneumatics cut unscheduled downtime 20-30 % in electronics assembly lines.[2]Qingkai Fan et al., “Review of Research on Hydrostatic Transmission Systems and Control Strategies,” MDPI, pmc.ncbi.nlm.nih.gov Machine-learning algorithms now adjust pump displacement and working pressures dynamically, improving energy utilization by 36 % in hydrostatic transmissions. Hybrid electro-hydraulic actuation is gaining traction in collaborative robots and automated guided vehicles, enlarging addressable demand for the fluid power equipment market.
Technical Improvements in Sealing and Material Science
Ceramic matrix composites and silicon-carbide inserts enable cylinders, pumps and valves to withstand higher pressures and temperatures in renewable energy installations). Thermoplastic composite pipe is lowering total-cost-of-ownership for subsea hydrogen and carbon-capture networks by eliminating corrosion and permitting longer continuous runs). New elastomer compounds paired with micro-textured surfaces slash leakage, a primary cause of energy loss in hydraulic systems, thereby further expanding the fluid power equipment market.
Growing Investments in Off-Highway Electrification
Construction and agricultural OEMs are integrating hybrid hydraulics with onboard battery packs to meet zero-emission job-site mandates. Demonstrations at Bauma 2025 confirmed that energy-recovery circuits using accumulators cut fuel or electricity consumption 15.8 % on slewing motions. Constant-pressure networks replace classic throttle control, trimming total system energy losses up to 60 % on telehandlers. These upgrades translate into escalating demand for advanced pumps, motors and smart valves, lending positive momentum to the fluid power equipment market.
Restraints Impact Analysis*
| Restraint | (~) % Impact on CAGR Forecast | Geographic Relevance | Impact Timeline |
|---|---|---|---|
| Cyclical capital expenditure in heavy industries | -1.8% | Global, pronounced in North America and Europe | Short term (≤ 2 years) |
| Price volatility of raw materials | -0.9% | Global | Medium term (2-4 years) |
| Leakage-driven energy losses in hydraulic systems | -0.6% | Global | Long term (≥ 4 years) |
| Supply chain fragmentation for precision components | -0.7% | Global, acute in Asia Pacific | Short term (≤ 2 years) |
| Source: Mordor Intelligence | |||
Cyclical Capital Expenditure in Heavy Industries
North American diversified industrial revenue at Parker Hannifin fell 5.8 % organically in Q2 2025 as transportation and off-highway customers delayed new hydraulic equipment orders. Construction machinery OEMs are stretching rebuild cycles amid higher interest rates and uncertain infrastructure outlays, dampening near-term fluid power component uptake. Similar caution is visible in mining and primary metal segments, both large consumers of high-pressure pumps and motors. These swings limit consistent growth for the fluid power equipment market until macro-investment sentiment stabilizes.
Price Volatility of Raw Materials
Steel, copper and specialty alloy prices hold at elevated levels, pushing material inputs to as much as 50 % of finished-component cost in precision manifolds and fittings. Air-Way Manufacturing reports longer lead times and freight surcharges, requiring greater buffer inventories that strain working capital. While large vendors pass on surcharges through index-linked contracts, smaller suppliers struggle to maintain margins, prompting selective price increases and redesigns to reduce metal weight. Material cost uncertainty therefore tempers capacity additions within the fluid power equipment market.
*Our forecasts treat driver/restraint impacts as directional, not additive. The impact forecasts reflect baseline growth, mix effects, and variable interactions.
Segment Analysis
By Technology: Hydraulic Equipment Sustains Scale While Pneumatics Outpaces on Growth
Hydraulic solutions accounted for 60.92% of 2025 revenue, underpinning the largest slice of the fluid power equipment market share thanks to unmatched power density in excavators, presses and drilling rigs. Vendors are pairing variable-displacement pumps with digital controllers, improving metering accuracy and lowering fuel burn. Pneumatics, although smaller, is set to register a 4.69% CAGR to 2031 on the strength of lightweight end-effectors in electronics assembly and life-science packaging. The fluid power equipment market size expansion in pneumatics is further supported by smart sensors that transmit cycle counts and leak-rate alerts to edge gateways. Hybrid architectures are also emerging: low-flow pneumatics handles positioning, while hydraulics delivers peak force, creating incremental revenue opportunities across both lines.
Continuous R&D in high-switch-frequency digital valves is narrowing performance gaps between the two technologies. Field tests show discrete-flow hydraulic circuits trimming energy losses 20 % relative to proportional control, an upgrade gaining favor in material-handling forklifts. On the pneumatic side, vacuum-ejector designs with integrated pressure feedback now reduce compressed-air consumption up to 50 %, cutting factory operating costs. Together these advances keep the fluid power equipment market on a modernization trajectory that balances traditional strengths with digital agility.


By Product Type: Pumps Dominate, Accumulators and Filters Advance Fastest
Pumps represented 27.12% of 2025 sales, affirming their role as the heart of every circuit and a cornerstone of the broader fluid power equipment market. Demand spans utility water management, steel mills and forestry harvesters. Electronic pressure compensation, bi-directional telematics and condition-monitoring probes all raise pump bill-of-materials content, enlarging supplier value capture. In contrast, accumulators and filters, while smaller today, are forecast to grow 5.52% annually to 2031. Their surge stems from energy-recovery mandates and stricter contamination codes in semiconductor fabs and food plants, respectively.
Filters are shifting toward high-separation microglass media that deliver lower differential pressure, prolonging element life and reducing motor load. Accumulator designs now incorporate bladder materials rated for 20,000 charge cycles, meeting duty profiles of hybrid cranes and agricultural sprayers. Margins in these categories trend above corporate averages, reinforcing why vendors allocate R&D aimed at total-system optimization and lifecycle monitoring. The mix shift positions the fluid power equipment market size for better profitability even as headline growth remains moderate.
By End-User Industry: Construction Retains Scale, Agriculture Leads Growth Curve
Construction captured 24.01% of 2025 revenue, buoyed by residential high-rise activity in India and highway network upgrades in the United States. Excavators require high-flow pumps and swing motors that generate reliable volume for original-equipment suppliers. Conversely, agriculture is projected to expand 5.31% annually as precision farming proliferates in Brazil, China and Europe. Variable-rate seeders, autonomous tractors and smart irrigation units rely on low-leak hydraulic manifolds and compact pneumatic dosing valves.
Material-handling and logistics continue to adopt automated guided vehicles powered by electro-hydraulic steering actuators, reinforcing demand diversity within the fluid power equipment market. Oil and gas remains material, but decarbonization policies are redirecting capital toward hydrogen, carbon-capture and offshore wind, where specialized fluid power modules manage blade pitch and subsea actuation. Such cross-vertical opportunities cushion the market against cyclical dips in any one sector.
By Distribution Channel: OEM Networks Command Volume, Aftermarket Accelerates on Services
OEM routes controlled 65.05% of 2025 shipments, underpinned by tight integration between component specifications and machine design. Long-running partnerships help minimize warranty risk and streamline assembly. The aftermarket, though smaller, is on course for a 5.58% CAGR through 2031 as plant operators pursue uptime via predictive maintenance. Cloud ordering portals and AI-driven stocking algorithms enable distributors to ship repair kits within 24 hours, shrinking downtime costs.
Applied Industrial Technologies’ USD 260 million purchase of Hydradyne underscores how service-centric portfolios can capture high-margin retrofit and remanufacturing demand. OEMs are responding by bundling subscription-based monitoring dashboards that alert users to filter clogging or pump cavitation, blurring boundaries between first-fit and replacement sales. These shifts underpin sustained throughput for the fluid power equipment market while lifting average revenue per installed unit.
Geography Analysis
Asia Pacific accounted for a leading 34.10% of 2025 turnover, anchored by China’s electronics clusters, India’s highway build-out and Southeast Asia’s packaging export hubs. Regional governments continue to promote industrial automation grants that favor both hydraulic presses and pneumatic pick-and-place systems, supporting consistent growth in the fluid power equipment market. China’s accelerated shift to electric vehicles is stimulating demand for battery manufacturing conveyors and cooling pumps. India’s Production-Linked Incentive schemes for mobile phone assembly call for dozens of new clean-room facilities, each equipped with hydrogen-tolerant pneumatic valves, further lifting volumes.
The Middle East is the fastest-growing territory, projected at a 5.44% CAGR through 2031. Saudi Arabia’s Vision 2030 and the UAE’s Operation 300 Bn strategies funnel investment into solar desalination, green hydrogen electrolysers and advanced logistics, all reliant on robust fluid power control. Harsh ambient temperatures demand specialty seals and high-thermal-stability fluids, creating premium niches for global component vendors. Turkey, acting as a bridge to European supply chains, is expanding automotive stamping capacity that employs high-tonnage hydraulic presses, propelling incremental orders.
North America and Europe display slower near-term momentum due to softer capital expenditure, yet they remain vital innovation hubs for the fluid power equipment market. Parker Hannifin’s North American industrial sales slipped, but aerospace aftermarket demand and medical equipment orders offset part of the decline. The European transition to Tier 5 off-road standards is sparking retrofits of hydraulic excavators and agricultural sprayers with low-emission pumps, counterbalancing weaker new-machine builds. These mature regions will likely regain traction once macro uncertainty eases, aided by legislated energy-efficiency upgrades across brownfield factories.

Regulatory Landscape
Regulation is tightening around machine safety, emissions, and cyber-risk management in automation-heavy equipment that embeds hydraulics and pneumatics. In the European Union, Regulation (EU) 2023/1230 on machinery replaces Directive 2006/42/EC, with provisions for notified bodies already in effect and full application starting January 20, 2027. This is raising conformity and documentation requirements for machinery integrating fluid power components and controls.
Standards and conformity pathways continue to shape market access across regions, with ANSI-aligned standards and U.S. market access directories used to navigate applicable requirements, and NFPA participation in ISO/TC 131 influencing fluid power system standards. Separately, operational-technology cybersecurity is moving from best practice toward compliance expectations, with IEC 62443 increasingly referenced for industrial systems in environments affected by frameworks such as NIS2 and the EU Cyber Resilience Act. This is pushing suppliers to harden connected valves, drives, and diagnostic gateways used in smart manufacturing.
Value Chain Analysis
Upstream inputs include steel and specialty alloys for manifolds and cylinders, copper and electronics for sensors and drives, elastomers and seal materials, and base oils and additives that influence hydraulic fluids and maintenance cycles. Manufacturing includes precision machining and surface treatments, cartridge valve and pump assembly, filtration media conversion, and test and validation for pressure, leakage, and duty-cycle performance, before products move into OEM integration (construction, agriculture, machine tools) and multi-tier distribution serving MRO and retrofit demand.
Downstream, value capture is shifting toward system integration and service-enabled distribution, where distributors provide kitting, embedded inventory, diagnostics, and field service alongside components. This trend is reinforced by consolidation and capability expansion in the channel, including the July 2026 merger of Value Added Distributors and Exotic Automation and Supply into a larger fluid power and automation platform, and Airline Hydraulics Corp. acquiring Industrial Automation Supply in June 2026 to broaden technical controls coverage. Supplier-to-integrator partnerships also show up in initiatives like PMC Hydraulics working with Bosch Rexroth for Nordic hydraulic and automation solutions (May 2026), while supply continuity risks remain tied to fragmented precision-component supply and fluid availability constraints, increasing lead-time and inventory planning pressure across the chain.
Competitive Landscape
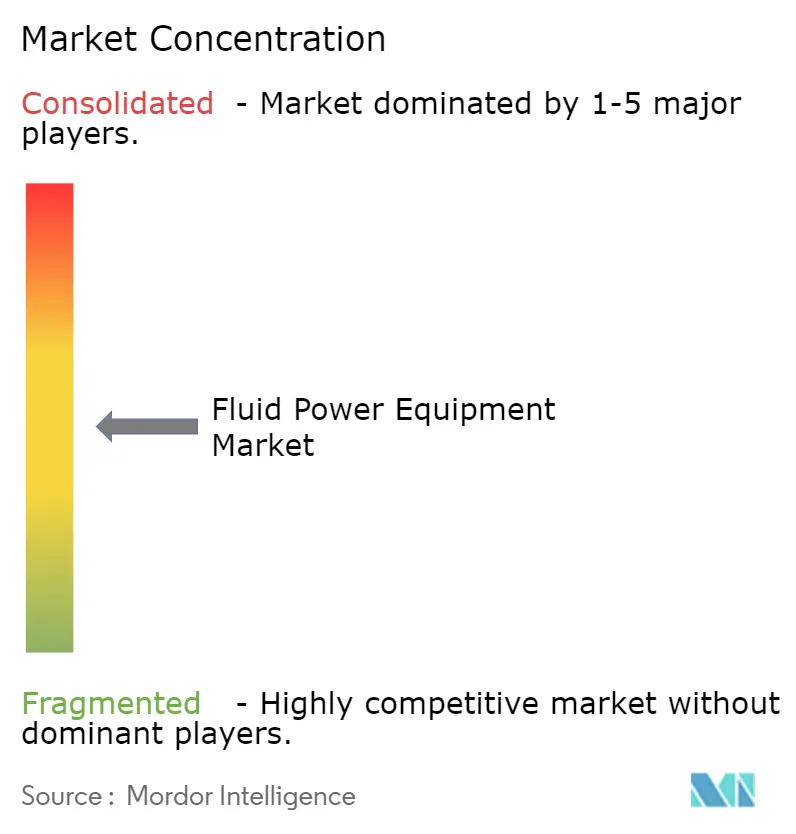
The fluid power equipment market exhibits moderate concentration, with the top five suppliers controlling roughly 45 % of global revenue. Parker Hannifin, Bosch Rexroth and Danfoss leverage vertical integration, global service footprints and digital control platforms to retain share. Bosch Rexroth’s January 2025 purchase of HydraForce adds cartridge valve depth and broadens mobile hydraulics coverage.[4]Bosch Rexroth, “HydraForce Acquisition,” boschrexroth.com Parker improved segment operating margins to 25.6 % in fiscal Q2 2025 through continuous-improvement programs and cost synergies from past acquisitions.
Secondary consolidators focus on value-added distribution and niche technology. Applied Industrial Technologies expanded its hydraulics MRO footprint via Hydradyne, positioning for subscription-based condition monitoring. Ingersoll Rand spent USD 47 million on Lead Fluid and Termomeccanica Industrial Compressor to secure life-science and renewable-gas opportunities. Such bolt-ons provide access to fast-growing adjacencies and cross-sell potential without major integration risk.
White-space competition is mounting from startups offering machine-learning-driven digital valves and compact hydraulic transformers that reclaim braking energy in mobile machinery. Established players respond with open-protocol software, cloud diagnostic portals and service-as-a-subscription programs. The resulting technology race should push overall performance benchmarks higher, supporting replacement demand and enlarging total addressable value for the fluid power equipment market.
Fluid Power Equipment Industry Leaders
Bosch Rexroth AG
Parker-Hannifin Corporation
Danfoss A/S
SMC Corporation
Eaton Corporation plc
- *Disclaimer: Major Players sorted in no particular order

Market Opportunities and Future Outlook
Near-term white space centers on energy-optimized and software-enabled fluid power packages that help OEMs and end users reduce operating losses and simplify commissioning. The NFPA 2025 Industrial Technology Roadmap highlights integrated sensing, data analytics, and system-oriented architectures, which creates room for suppliers that bundle pumps, valves, sensors, and edge connectivity rather than selling standalone components. That direction also lines up with buyer behavior in smart manufacturing, where condition monitoring and interoperability reduce downtime and favor components built for digital diagnostics.
A second opportunity is deeper system integration in mobile equipment electrification and advanced motion control. Variable-speed drives, digital hydraulics, and hybrid electro-hydraulic actuation expand bill-of-materials content and lift aftersales attach. Recent supplier actions reinforce this path, including Danfoss launching a variable-speed drive portfolio for industrial hydraulic applications and releasing PC-PRO propel software for hydrostatic transmissions in 2026, both of which move the offer toward control software and efficiency improvements. At the channel level, consolidation and service expansion also create space for higher-margin retrofit and lifecycle services, as larger multi-location distributors scale repair, filtration management, and predictive maintenance programs that add recurring aftermarket revenue.
Recent Industry Developments
- July 2026: Eaton expanded the Walterscheid tube fitting portfolio with the WALRINGplus Soft Seal Cutting Ring system. The update targets leak-tightness and assembly robustness in hydraulic line connections, supporting OEM and aftermarket demand for higher reliability under harsh duty cycles. It strengthens Eaton's fluid conveyance offering alongside broader mobile hydraulic system integration.
- May 2026: Parker Hannifin entered a definitive agreement to acquire CIRCOR International's Commercial and Defense Aerospace business for USD 2.55 billion. The transaction expands Parker's aerospace portfolio and enlarges its installed base that consumes hydraulic and related fluid power technologies in high-reliability applications. It also adds scale for engineering and aftermarket service capabilities tied to flight-critical fluid power systems.
- March 2026: Bosch Rexroth signed a memorandum of understanding with Kawasaki Heavy Industries to collaborate on next-generation off-highway machinery and hydrogen solutions. The collaboration highlights OEM-driven development of cleaner, more efficient mobile platforms where advanced hydraulics and controls remain central. It reinforces supplier focus on integrated systems for electrification-adjacent and alternative-fuel equipment programs.


Research Methodology Framework and Report Scope
Market Definition and Coverage
For this report, we size the global fluid power equipment market as the revenue generated from fluid power equipment sold for industrial and mobile applications, covering hydraulic and pneumatic equipment used to transmit power and control motion.
Scope exclusions: We exclude the value of finished end products that use fluid power systems, and we also exclude unrelated electric drives and controls that do not form part of fluid power equipment revenue.
Segmentation Overview
- By Technology
- Hydraulic Equipment
- Pneumatic Equipment
- By Product Type
- Pumps
- Motors
- Valves
- Cylinders
- Accumulators and Filters
- By End-User Industry
- Construction
- Agriculture
- Material Handling and Logistics
- Oil and Gas
- Aerospace and Defense
- Machine Tools
- Food Processing and Packaging
- Other End-User Industries
- By Distribution Channel
- OEM
- Aftermarket
- By Geography
- North America
- United States
- Canada
- Mexico
- South America
- Brazil
- Argentina
- Rest of South America
- Europe
- Germany
- France
- United Kingdom
- Italy
- Spain
- Russia
- Rest of Europe
- Asia Pacific
- China
- Japan
- India
- South Korea
- Australia and New Zealand
- Southeast Asia
- Rest of Asia Pacific
- Middle East
- Saudi Arabia
- United Arab Emirates
- Turkey
- Rest of Middle East
- Africa
- South Africa
- Egypt
- Rest of Africa
- North America
Data Sources, Market Sizing, and Validation
Desk Research
Desk research starts by mapping the demand pool and the supply footprint using public, repeatable data. We rely on official and association sources such as the National Fluid Power Association industry statistics, US Census Bureau manufacturing and trade releases, UN Comtrade import and export series, and the International Trade Administration country notes (where relevant), followed by technical context from peer reviewed engineering journals.
These sources are then paired with practical market signals from company annual reports, investor presentations, and credible industry press. This is where we pick up changes in product mix, the way pricing is described, and where orders are coming from by end market. To reduce blind spots, we also use paid subscriptions for company financials and intelligence, patent searches, and shipment level trade checks when the public series is too aggregated. The sources listed above are illustrative, and many other references were used to collect data, clarify definitions, and validate assumptions.
Primary Interviews and Surveys
Primary work is used to confirm what the equipment revenue includes, how hydraulic versus pneumatic demand is shifting, and what pricing and lead time patterns look like in different regions. We interviewed and surveyed manufacturers, distributors, and large end users, then used these inputs to adjust conversion factors, adoption curves, and regional splits where desk sources were not fully aligned.
Distribution of primary research fieldwork respondents
| Company type | Respondent position | Region |
|---|---|---|
| Top tier: 27% | CXOs: 19% | APAC: 51% |
| Mid tier: 54% | Functional/Unit leaders: 23% | EMEA: 31% |
| Smaller Players: 19% | Managers: 58% | Americas: 18% |
Market-Sizing & Forecasting
The sizing model begins with a top down build that reconstructs regional demand from manufacturing activity and industrial investment signals, then applies fluid power intensity for key equipment using industries as the allocation basis. Once the demand pool is shaped, we corroborate it with selective bottom-up approximations, such as sampled product level ASPs multiplied by estimated shipment volumes and channel checks from distributors, then we adjust totals if gaps show up.
Inputs used in the model include indicators such as industrial production trends, machine and equipment output, construction and mining activity signals, automation investment trends, and import and export movements for relevant equipment categories. We also incorporate pricing direction and product mix shifts (for example, higher value integrated hydraulic power units versus standard components) using patterns that interviewees repeatedly validated.
Forecasts are developed using scenario analysis, where macro drivers and industry capex expectations are translated into base, conservative, and upside paths, and the most plausible path is selected using expert feedback. Where bottom-up checks are incomplete for smaller countries, we fill the gap using peer market ratios and trade-linked proxies, then re-check the implied per-industry spend so the result stays realistic.
Data Validation & Update Cycle
Validation is done through a set of cross-checks, where model totals are compared against independent signals like trade flows, association shipment direction, and the implied equipment spend per unit of industrial output. When a region shows an unusual jump or drop, the assumptions behind mix, price progression, and end use exposure are reviewed, and follow up calls are triggered to re-check the outlier.
Before sign-off, the work is reviewed in steps: first by the analyst building the model, then by a second analyst who tests the logic and checks variance versus known industry markers. Reports are refreshed annually, and interim updates are made when material events occur, such as major policy shifts, large capacity changes, or sudden demand shocks. Right before delivery, we do a final pass so the client receives the latest updated view.
Mordor Intelligence's Global Fluid Power Equipment Market Size Compared Against Other Published Estimates
Published market values for fluid power equipment can look far apart because the service boundary is not always consistent, and because some estimates mix component revenue with broader motion control, services, or downstream equipment value. Differences also come from the year chosen as the reference point, currency conversion timing, and whether the model uses shipment linked reality checks or stays mainly assumption driven.
By tracking trade-linked equipment signals and industry output indicators, Mordor Intelligence keeps the market value tied to equipment sales revenue and avoids counting the value of finished machines that only contain fluid power systems, which can inflate totals.
Benchmark comparison
| Source | Market Size | Gaps in Research Methodology |
|---|---|---|
| Mordor Intelligence | USD 73.07 B (2026) | |
| Global Consultancy A | USD 54.25 B (2026) | Uses a narrower product boundary that leans toward selected components and may exclude integrated units and some mobile equipment demand, which pulls the total down. |
| Industry Study B | USD 45.62 B (2024) | Blends adjacent actuator categories and applies a different base year and growth path, and the scope may treat hydraulics and pneumatics at a higher level without a consistent equipment-only revenue filter. |
The spread across sources is mostly explained by what is counted as equipment revenue versus adjacent categories, and by whether the sizing is anchored to observable demand signals like trade and industrial activity. When assumptions are kept traceable to clear inputs and re-tested through interviews, the final number becomes easier to reconcile and repeat year after year.


Key Questions Answered in the Report
How large is the fluid power equipment market in 2026?
It stood at USD 73.07 billion in 2026 and is projected to reach USD 90.72 billion by 2031.
What is the expected CAGR for the fluid power equipment market to 2031?
The forecast compound annual growth rate is 4.42 % over the 2026-2031 period.
Which technology commands the largest share of revenue?
Hydraulic equipment led with 60.92 % of 2025 sales thanks to unrivaled power density.
Which end-user segment is forecast to grow the fastest?
Agriculture is projected to expand at a 5.31 % CAGR as precision farming gains traction.
Which region is the fastest-growing market?
The Middle East is expected to post a 5.44 % CAGR through 2031, led by renewable energy projects.
Who are the leading suppliers in the fluid power equipment market?
Parker Hannifin, Bosch Rexroth and Danfoss head the market, collectively holding a mid-20 % share.
Page last updated on:






