
Flow Control Market Size and Share
Market Overview
| Study Period | 2020 - 2031 |
|---|---|
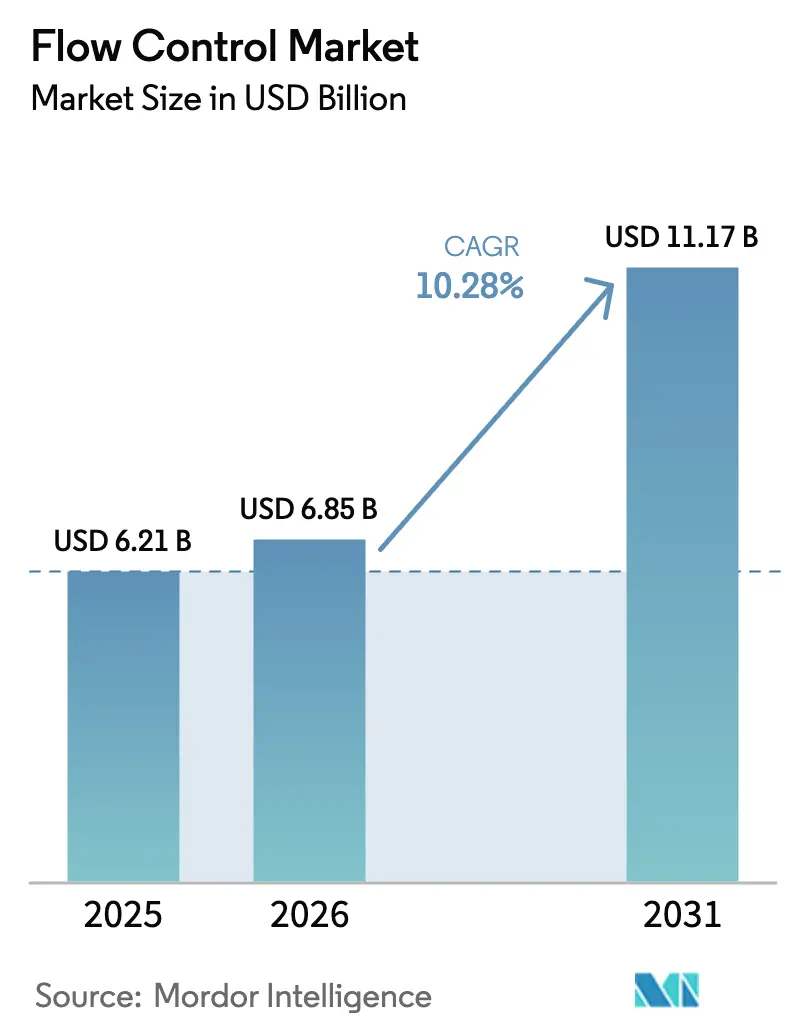
| Market Size (2026) | USD 6.85 Billion |
| Market Size (2031) | USD 11.17 Billion |
| Growth Rate (2026 - 2031) | 10.28% CAGR |
| Fastest Growing Market | Asia-Pacific |
| Largest Market | Asia-Pacific |
| Market Concentration | Low |
Major Players *Disclaimer: Major Players sorted in no particular order Image © Mordor Intelligence. Reuse requires attribution under CC BY 4.0. | |
Flow Control Market Analysis by Mordor Intelligence
The Flow Control market size is expected to grow from USD 6.21 billion in 2025 to USD 6.85 billion in 2026 and is forecast to reach USD 11.17 billion by 2031 at 10.28% CAGR over 2026-2031. This continued expansion reflects simultaneous investments in industrial digitization, infrastructure renewal, and stricter environmental oversight, which are reshaping process-control architectures. Enterprise spending focuses on smart devices that support predictive maintenance while ensuring uptime. End users are increasingly favoring suppliers that combine mechanical expertise with secure, cloud-ready analytics. Asia Pacific maintains the strongest regional pull, underpinned by China’s automation drive, India’s Production Linked Incentive schemes, and steady LNG terminal construction across Southeast Asia.[1]Economic Times, “PLI Scheme for Electronics Manufacturing Gets Extension Till 2025-26,” economictimes.indiatimes.com In parallel, the tightening EU and U.S. emission norms accelerate the replacement of legacy valves with certified low-leakage designs, even as specialty alloy shortages and cybersecurity threats introduce cost volatility and risk.
Key Report Takeaways
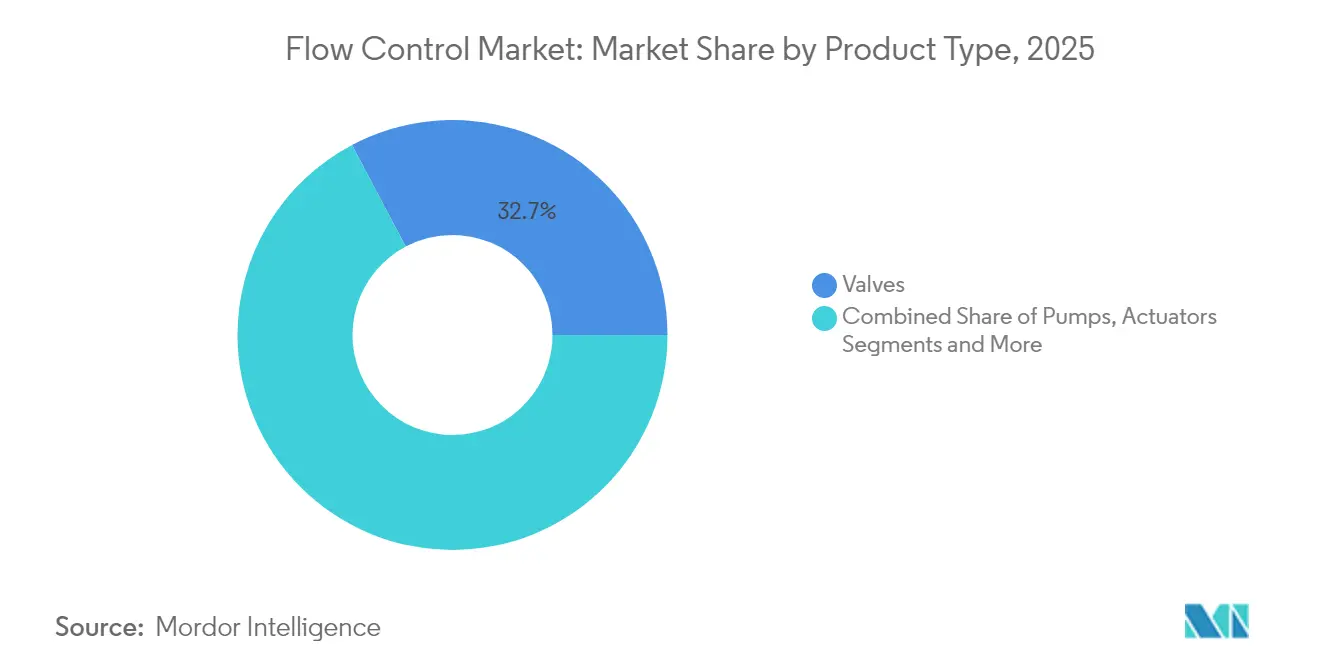
- By product type, valves led with 32.74% revenue share of the flow control equipment market in 2025 and is projected to expand at a 13.16% CAGR through 2031.
- By end-user industry, oil and gas held 28.12% of the flow control equipment market share in 2025, while pharmaceuticals and biotechnology recorded the highest projected CAGR at 11.3% through 2031.
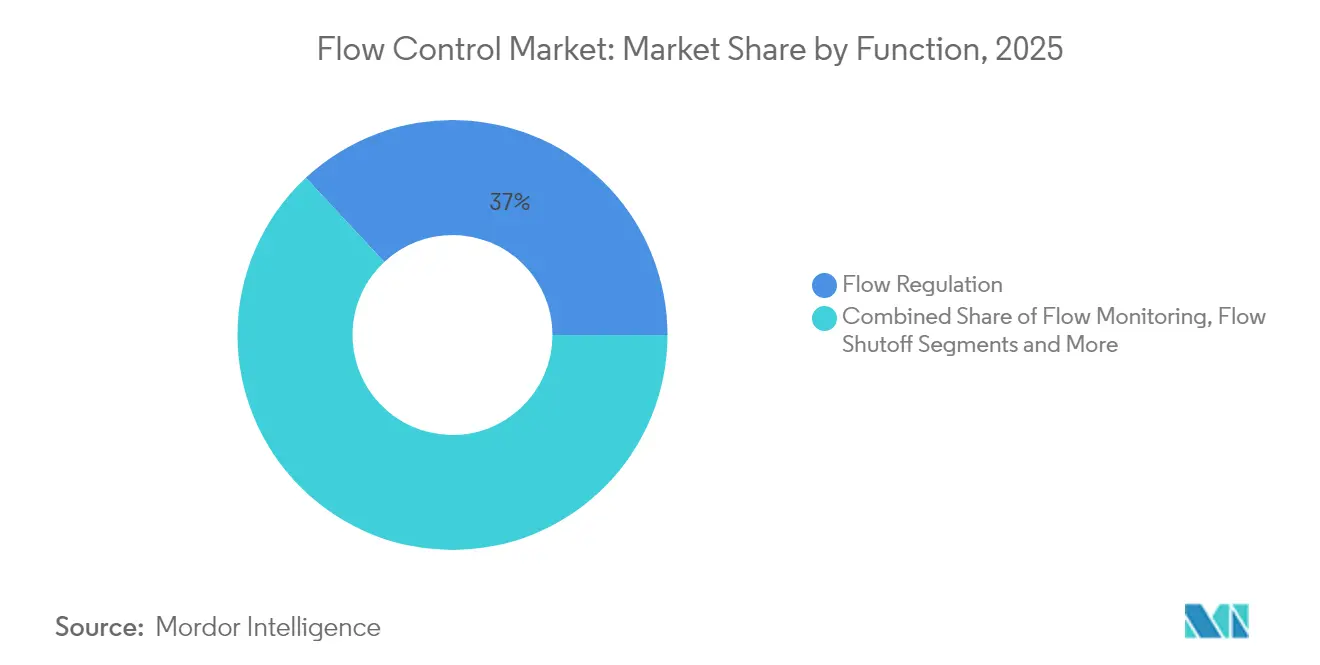
- By function, flow regulation accounted for a 36.95% share of the flow control equipment market size in 2025, and flow monitoring is advancing at a 12.55% CAGR through 2031.
- By technology, electric systems commanded 31.12% of the flow control equipment market size in 2025 and smart/digital solutions are set to rise at a 13.07% CAGR to 2031.
- By region, Asia Pacific captured 41.55% of the flow control equipment market share in 2025; the same region is projected to post a 9.6% CAGR to 2031.
Note: Market size and forecast figures in this report are generated using Mordor Intelligence’s proprietary estimation framework, updated with the latest available data and insights as of 2026.
Global Flow Control Market Trends and Insights
Drivers Impact Analysis*
| Driver | (~) % Impact on CAGR Forecast | Geographic Relevance | Impact Timeline |
|---|---|---|---|
| Digitization of legacy flow control infrastructure | +2.8% | North America, Europe, global roll-outs | Medium term (2-4 years) |
| Surge in LNG terminal investments across emerging economies | +2.1% | Asia-Pacific, Middle East and Africa | Long term (≥ 4 years) |
| Rapid uptake of modular chemical plants | +1.7% | North America, Europe, Asia-Pacific | Medium term (2-4 years) |
| Sustainability mandates driving water reuse systems | +1.9% | Global, Europe leadership | Long term (≥ 4 years) |
| Tightening fugitive-emission regulations | +1.4% | North America, Europe | Short term (≤ 2 years) |
| Micro-precision flow for cell and gene therapies | +1.2% | North America, Europe, Asia-Pacific | Medium term (2-4 years) |
| Source: Mordor Intelligence | |||
Digitization of Legacy Flow Control Infrastructure
Manufacturers are replacing pneumatic or hydraulic loops with sensor-rich electric assemblies that integrate seamlessly into plant SCADA systems. Real-time telemetry, combined with AI, reduces unscheduled downtime by as much as 30% and ensures tighter process tolerances, especially in chemical and petrochemical processes where grade yields hinge on flow accuracy.[2]ABB, “Flow Measurement Products,” new.abb.com The retrofit model appeals to mature plants because it lowers capex versus full replacement, while cloud dashboards give executives immediate visibility into energy and maintenance metrics.
Surge in LNG Terminal Investments Across Emerging Economies
Vietnam, India, and Indonesia are adding greenfield terminals that require cryogenic-ready valves, actuators, and flow meters capable of operating at temperatures of≥ –160 °C. Vietnam alone plans five new facilities worth USD 12 billion by 2030. Each terminal integrates redundant digital shutoff loops to meet safety integrity levels, opening premium niches for suppliers that can certify both extreme-temperature metallurgy and SIL-3 electronics.
Rapid Uptake of Modular Chemical Plants
Short product cycles in the specialty chemicals industry have driven the adoption of skid-mounted reactors. These modules rely on standardized connection points, enabling flow control equipment suppliers to deliver pre-engineered, drop-in packages that compress site-build schedules by 30% and reduce labor risk. The template design lets OEMs leverage common part numbers and predictive spares stocking.
Sustainability Mandates Driving Water Reuse Systems
The updated EU Urban Wastewater Treatment Directive requires a 90% reuse rate by 2030, prompting utilities and industrial parks to deploy high-accuracy magnetic flow meters and variable-speed pumps for closed-loop networks. Advanced control strategies balance nutrient removal efficiency against energy use, a calculation possible only with continuous flow telemetry at each stage.
Restraints Impact Analysis*
| Restraint | (~) % Impact on CAGR Forecast | Geographic Relevance | Impact Timeline |
|---|---|---|---|
| Supply chain volatility for specialty alloys | −1.8% | Global high-performance sectors | Short term (≤ 2 years) |
| Cybersecurity vulnerabilities in IIoT-enabled devices | −1.3% | Global, critical infrastructure | Medium term (2-4 years) |
| Capital expenditure cuts in upstream oil | −1.1% | Global oil and gas | Short term (≤ 2 years) |
| Fragmented aftermarket service in developing regions | −0.9% | Asia-Pacific, Middle East and Africa, South America | Long term (≥ 4 years) |
| Source: Mordor Intelligence | |||
Supply Chain Volatility for Specialty Alloys
Price swings of more than 40% in nickel-based superalloys have resulted in extended lead times of over 40 weeks for severe-service valve bodies.[3]London Metal Exchange, “Stainless Steel Market Data,” lme.com Engineering teams cannot readily substitute metals without requalification, and buyers often resort to dual sourcing or maintaining inventory buffers, which can increase working capital.
Cybersecurity Vulnerabilities in IIoT-Enabled Devices
Industrial control system advisories increased by 34% in 2024, and flow devices with open-source stacks were frequently listed on exploit lists. Vendors now embed hardware roots of trust and partner with certified secure-development lifecycles, but compliance adds cost and extends validation timelines.
*Our forecasts treat driver/restraint impacts as directional, not additive. The impact forecasts reflect baseline growth, mix effects, and variable interactions.
Segment Analysis
By Product Type: Smart Devices Outperform Traditional Hardware
Traditional valves held a 32.74% market share of the flow control equipment market in 2025 and are advancing at a 13.16% CAGR. Pumps and actuators remain essential for bulk fluid movement; however, their growth trails that of the intelligent valve segment, as predictive algorithms have proven to reduce maintenance outlays. Flow meters benefit from compliance-driven demand for accurate discharge reporting. Collectively, upgraded smart assemblies are expanding the installed base for diagnostics platforms, supporting aftermarket revenues that now account for more than 20% of vendor totals.
The retrofit wave favors hybrid solutions, where digital positioners are bolted onto legacy bodies, creating cost-effective pathways to analytics without halting production. Vendors with modular electronics platforms offer tailored signal protocols, including HART, Modbus, and OPC UA, which support multi-vendor architectures within brownfield plants. Suppliers also preload calibration curves that meet ISO 5167 traceability standards, thereby accelerating regulatory audits.


By End-User Industry: Life-Science Demand Accelerates
Oil and gas companies maintained a 28.12% market share of flow control equipment in 2025, driven by LNG expansion and methane leak reduction initiatives. Yet pharmaceuticals and biotechnology lead growth at 11.3% CAGR as cell and gene therapy lines proliferate. Water and wastewater utilities sit close behind, catalyzed by circular-economy projects. Power generators retrofit flow circuits to manage varying renewable inputs while maintaining grid inertia, which boosts demand for fast-response control valves. Chemical firms are shifting toward modular pilot plants that require reconfigurable flow skids, and hygienic food and beverage processors are buying sanitary diaphragm valves compatible with automated clean-in-place cycles.
The life-science boom hinges on validated documentation; suppliers that bundle electronic records with each skid reduce customer qualification effort. Meanwhile, conventional energy firms concentrate their spending on safety-critical units that deliver quantifiable reductions in leaks, tying equipment choices to emissions-credit strategies.
By Function: Monitoring Overtakes Pure Regulation
Flow regulation accounted for 36.95% of the flow control equipment market size in 2025. Monitoring, however, advances at a 12.55% CAGR because data-centric management unlocks incremental energy savings and enables rapid anomaly detection. Shutoff functions grow in tandem with stricter process-safety mandates, and diversion devices support multi-product production lines seeking agile changeovers.
Real-time monitoring is no longer optional under tightened environmental permits. Continuous data streams feed historian databases and predictive models that can forecast seal degradation weeks in advance. Plants that exploit these insights report a 20% reduction in emergency call-outs.
By Technology: Electric Platforms Dominate While Digital Layers Scale
Electric actuation accounted for 31.12% of 2025 revenue, thanks to its precision and ease of wiring. Smart/digital overlays are projected to grow at a 13.07% CAGR through 2031 as OEMs release wireless-ready boards and cloud-based dashboards. Pneumatics remain prevalent in explosion-prone zones, although the costs of air compression and decarbonization targets constrain their adoption. Hydraulics cater to heavy-thrust niches but suffer weight and maintenance drawbacks. Edge gateways now sit atop valve or pump housings, enabling encrypted MQTT data transfer to plant clouds within minutes of installation.
Geography Analysis
Asia Pacific’s 41.55% share illustrates unmatched project volume ranging from Chinese semiconductor plants to Indian biomanufacturing parks. Government incentives, low labor costs, and rapid permitting compress asset lifecycles. Digital retrofit programs trail greenfield build-outs but are gaining traction as multinationals demand common OT standards across regions.
North American buyers allocate budgets for cyber-secure upgrades to safety-instrumented nodes, encouraged by federal critical infrastructure directives. U.S. LNG export expansion likewise sustains cryogenic valve demand. European end users earmark capex for leak-detection-and-repair equipment to meet Industrial Emissions Directive revisions, and municipal utilities have begun multi-year upgrades to achieve 2030 water reuse targets.
Gulf Cooperation Council members are integrating IIoT-based smart district cooling networks that run on looped chilled water, driving sales of corrosion-resistant butterfly valves. South American mining output boosts slurry-duty valve consumption, but macroeconomic volatility hinders capital cycles. African water-treatment build-outs are in their early stages; development banks stipulate that hardware include remote diagnostics to minimize site visits.


Regulatory Landscape
Flow control systems increasingly fall under horizontal operational-technology cybersecurity expectations as valves, actuators, and flow meters become IIoT-connected and integrated with plant SCADA/DCS environments. The ISA/IEC 62443 series is a core reference for Industrial Automation and Control Systems (IACS) security programs, while NIST SP 800-82r3 remains a key U.S. federal reference for OT cybersecurity risk management that influences procurement requirements across critical infrastructure end users.
In Europe, governance around embedded intelligence in industrial control environments tightened with Regulation (EU) 2024/1689 (EU AI Act), with high-risk rules for Annex III systems (including critical infrastructure management) applying from 2 August 2026. In parallel, IEC issued additions to the 62443 ecosystem in 2025, including IEC PAS 62443-2-2:2025 (published 11 March 2025) on IACS Security Protection Schemes and IEC PAS 62443-1-6:2025 (published 19 December 2025) on cybersecurity application guidance, reinforcing vendor requirements for secure development practices, traceability, and auditable controls in connected flow control deployments.
Value Chain Analysis
The value chain spans raw materials and precision components (specialty alloys, castings/forgings, seals, electronics), equipment manufacturing (valves, pumps, actuators, flow meters, and digital positioners), systems integration (instrumentation packages tied into DCS/SCADA and asset management software), and distribution through direct EPC/project channels and regional industrial distributors. Qualification and compliance requirements shape sourcing, with severe-service and safety-critical applications relying on validated foundries and certified sub-suppliers, while electronics and firmware layers add secure-by-design and lifecycle support demands for IIoT-enabled devices.
Downstream, EPCs, OEM skid builders, and plant operators drive specification and acceptance testing, followed by commissioning and long-life aftermarket service (spares, calibration, field service, and analytics subscriptions). Lead times and cost volatility are amplified by constrained specialty alloys and the need to requalify materials, pushing manufacturers toward dual sourcing, regionalized production footprints, and closer coordination with logistics providers. Digitalization is also reshaping operations and fulfillment, with broader adoption of AI-driven scheduling and logistics workflows to improve traceability and responsiveness across global shipments of engineered flow control equipment.
Competitive Landscape
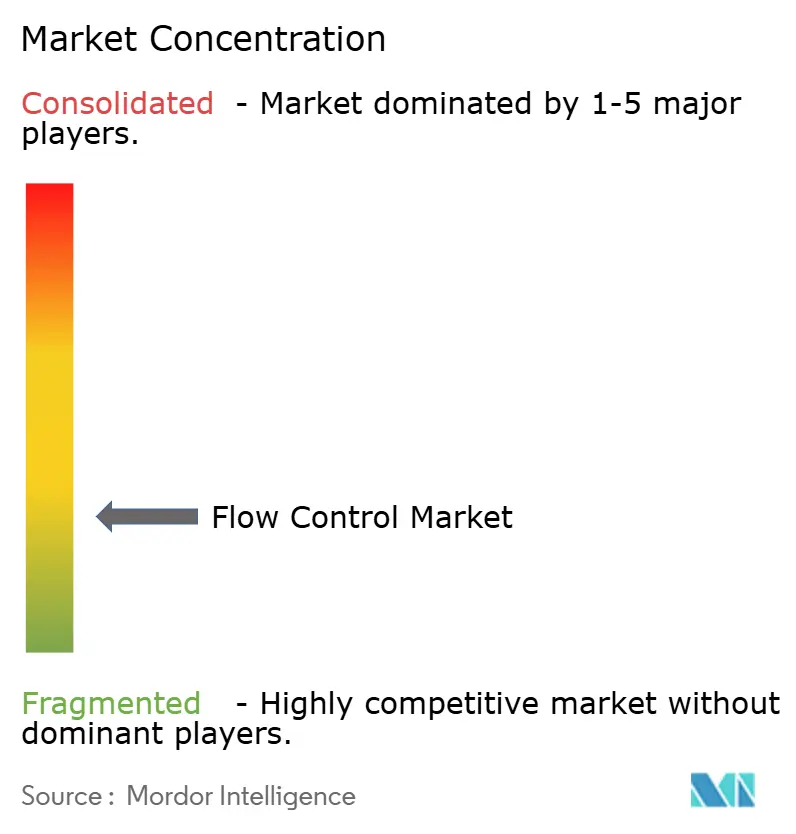
The flow control market remains moderately fragmented. However, hundreds of regional specialists compete in niche alloys, hygienic skids, or service contracts. M&A momentum favors digital capability gaps; Emerson’s USD 11 billion purchase of AspenTech in 2024 merged sensing hardware with AI-powered optimization suites.[4]Reuters, “Emerson Completes Acquisition of AspenTech,” reuters.com Siemens invested USD 2.1 billion to expand smart-instrument manufacturing footprints in Germany and China, ensuring capacity near end markets while introducing carbon-neutral production lines.
Flowserve secured a USD 850 million, multi-terminal LNG contract in Vietnam, its largest win in the Asia Pacific region, leveraging its proven cryogenic performance and local service centers. Honeywell’s Experion HS SCADA release embeds secure-boot firmware and anomaly-based intrusion detection, underscoring the centrality of cybersecurity. Emerging software-only firms monetize valve data via subscription dashboards, tempting asset owners keen to move capex to opex, while legacy OEMs counter by bundling lifetime analytics within hardware list prices.
Patent filings underscore innovation pressure: more than 200 smart-valve submissions landed at the USPTO during 2024 alone, covering wireless power harvesting, self-calibrating trim, and edge AI diagnostics. Suppliers that can certify both process safety and data security stand best placed to command premium margins.
Flow Control Industry Leaders
Emerson Electric Company
Flowserve Corporation
Siemens AG
Honeywell International Inc.
Alfa Laval AB
- *Disclaimer: Major Players sorted in no particular order

Market Opportunities and Future Outlook
A whitespace sits at the intersection of flow hardware and cyber-secure connectivity, where end users want retrofit-friendly instruments that deliver actionable diagnostics without full asset replacement. Offerings such as portable non-intrusive ultrasonic flow metering and valve controllers with secure wireless configuration support faster audits, maintenance rounds, and troubleshooting across water and wastewater networks, power plants, and process industries, while reducing downtime linked to intrusive measurement or manual configuration.
An opportunity set is also emerging around high-density cooling and thermal management control, where AI-driven optimization is being trialed on multi-chiller and facility cooling systems. For example, Daikin and NTT DATA launched a data center proof of concept in Japan (announced July 2026, running until March 2027) integrating AI-based thermal prediction with facility cooling control, reinforcing demand for accurate flow measurement, controllable valves, and interoperable control loops in cooling plants. As industrial automation shifts toward distributed control architectures and deterministic networking, suppliers that combine certified mechanical performance with auditable cybersecurity controls (aligned to frameworks such as ISA/IEC 62443) have a practical path to expand attach rates for digital positioners, edge gateways, and lifecycle software services.
Recent Industry Developments
- July 2026: Flowserve completed its USD 490 million all-cash acquisition of Trillium Flow Technologies' Valves Division (excluding French operations). The deal expands Flowserve's mission-critical valve portfolio and broadens its installed base for aftermarket services in severe-duty and regulated applications. Integration also strengthens its ability to bid on larger engineered packages where valve breadth and service coverage influence award decisions.
- January 2025: Emerson completed its USD 11 billion acquisition of AspenTech. The combination deepened Emerson's hybrid hardware-software stack, linking flow instrumentation and valves with optimization and predictive maintenance software used in process industries. The transaction reinforced the market shift toward bundled equipment-plus-analytics procurement models.
- December 2024: Siemens announced a USD 2.1 billion capacity expansion in Germany and China focused on IIoT-enabled valves and flow meters. Added manufacturing capacity closer to key demand centers supports shorter lead times for digitization-driven retrofit programs in chemicals and pharmaceuticals. The move also signals continued investment in smart-instrument production scale as connectivity and security features become standard requirements.


Research Methodology Framework and Report Scope
Market Definition and Coverage
For this study, the global flow control market is defined as the revenue generated from equipment used to regulate, shut off, divert, or monitor the flow of liquids and gases across industrial systems, where the value is counted at the equipment supply level and tracked in USD.
Scope exclusions: We exclude on-site installation labor, plant-level EPC project value, and ongoing maintenance services when they are priced separately from the equipment.
Segmentation Overview
- By Product Type
- Valves
- Pumps
- Actuators
- Flow Meters
- By End-user Industry
- Oil and Gas
- Water and Wastewater
- Power Generation
- Chemical and Petrochemical
- Pharmaceuticals and Biotechnology
- Food and Beverage
- By Function
- Flow Monitoring
- Flow Regulation
- Flow Shutoff
- Flow Diversion
- By Technology
- Pneumatic
- Hydraulic
- Electric
- Smart/Digital
- By Geography
- North America
- United States
- Canada
- Mexico
- South America
- Brazil
- Argentina
- Rest of South America
- Europe
- Germany
- United Kingdom
- France
- Italy
- Spain
- Rest of Europe
- Asia-Pacific
- China
- Japan
- India
- Singapore
- Australia
- Malaysia
- Rest of Asia-Pacific
- Middle East and Africa
- Middle East
- Saudi Arabia
- United Arab Emirates
- Rest of Middle East
- Africa
- South Africa
- Egypt
- Rest of Africa
- Middle East
- North America
Data Sources, Market Sizing, and Validation
Desk Research
Desk research was used to build the market map, understand where demand concentrates, and set the boundaries for what should be counted as flow control equipment revenue. We reviewed public sources such as U.S. Energy Information Administration (EIA) datasets, International Energy Agency (IEA) industry indicators, U.S. Geological Survey (USGS) mining and minerals series, and World Bank industrial and infrastructure indicators to track macro demand signals linked to fluid handling.
To anchor the industrial footprint by region, we also referred to sources such as UN Comtrade trade statistics for relevant equipment categories, International Organization for Standardization (ISO) references for commonly used standards language, and technical papers in peer-reviewed journals that describe adoption trends (for example, smart diagnostics in valves and instrumentation). Alongside this, company annual reports, investor presentations, and reputable business press were used to sanity-check product mix discussions and end-user exposure. Our subscriptions for company financials and patent databases were used to confirm supplier focus areas and recent product activity. These sources are illustrative, and we also consulted other public and subscription sources to collect data, validate assumptions, and clarify specific points.
Primary Interviews and Surveys
Primary work focused on validating what gets counted in flow control across pumps, valves, meters, and related devices, and on aligning pricing and replacement cycles with actual buying behavior. We spoke with a mix of manufacturers, distributors, system integrators, and industrial end users across major process industries. The regional spread was kept broad so assumptions for Asia-Pacific buildout and mature-market replacement demand could both be tested.
Distribution of primary research fieldwork respondents
| Company type | Respondent position | Region |
|---|---|---|
| Top tier: 33% | CXOs: 14% | APAC: 42% |
| Mid tier: 50% | Functional/Unit leaders: 40% | EMEA: 31% |
| Smaller Players: 17% | Managers: 46% | Americas: 27% |
Market-Sizing & Forecasting
Sizing was built using a top-down approach where industrial demand pools are reconstructed from end-use activity and installed-base signals, and then translated into equipment spending using mix and replacement assumptions. Because flow control is typically purchased as a blend of new-build demand and maintenance-driven replacements, we split the demand logic across expansion projects and recurring replacement cycles before arriving at the market total.
Key inputs used in the model include process industry capex direction (oil and gas, power, mining, and marine), water and wastewater infrastructure activity, manufacturing output trends in electronics-heavy countries, typical replacement intervals for critical components, and observed shifts toward smart and digitally enabled devices (which can change average selling prices over time). Results were then corroborated with selective bottom-up checks such as sampled supplier revenue exposure, channel discussions on unit volumes, and ASP-by-equipment-type ranges. Where gaps existed, we used conservative midpoints and then re-checked with interview feedback. For forecasting, scenario analysis was used so high and low cases could be linked to different capex cycles, regional investment timing, and adoption speed for smart monitoring and control features. The final outlook reflects the most repeated expectations heard from practitioners.
Data Validation & Update Cycle
Validation was done by comparing the modeled totals against independent signals such as industrial production direction, trade movement consistency for relevant equipment categories, and whether the implied spend per facility type looked realistic. Outliers were reviewed at the region and end-user level, and when a swing could not be explained by a clear driver like a capex jump or a pricing shift, the assumption was revisited and checked again with additional calls.
Before sign-off, the work passes through multi-step internal reviews so the math, definitions, and year-on-year movements are aligned. The report is refreshed annually, and interim updates are made when material events occur (for example, major policy changes affecting industrial investment or sharp currency moves). Right before delivery, we run a fresh scan of recent developments and re-validate the key assumptions so clients get an up-to-date view.
Mordor Intelligence's Global Flow Control Market Sizing Compared With Other Published Estimates
It is common to see different published market sizes for flow control because the scope can shift in small but meaningful ways, and because some publishers anchor the market on different years or pricing bases. Divergence also comes from how pump, valve, and meter revenues are counted across OEM supply, aftermarket replacements, and bundled project packages.
In this study, the market is kept limited to equipment value across pumps, valves, meters, and related devices. This avoids counting EPC project value and most service-heavy contract value, which helps explain why the 2026 value is far below some 2024 estimates shown in the table, and that difference is applied by Mordor Intelligence.
Benchmark comparison
| Source | Market Size | Gaps in Research Methodology |
|---|---|---|
| Mordor Intelligence | USD 6.85 B (2026) | |
| Industry Research House A | USD 60.20 B (2024) | Uses a much broader value pool that appears to align with the full industrial flow control systems spend, which can fold in large project packages and service components, and it also anchors on a different base year and pricing environment. |
| Industry Forecast Desk B | USD 80.00 B (2024) | Tracks valves as a standalone market (and not the full pumps-valves-meters set), and the definition is product-specific with country and sector rollups that may include categories not treated as flow control equipment in narrower models. |
The spread across figures mainly reflects what is counted, and the year and pricing basis used. When scope is kept consistent at the equipment level and the demand drivers are tied back to repeatable indicators like capex direction, replacement behavior, and adoption of smart devices, the final size becomes easier to reconcile and update over time.


Key Questions Answered in the Report
Which region holds the largest share of global demand?
Asia Pacific captured 41.55% of 2025 spending, driven by automation-intensive industrial expansion.
Which product segment is forecast to grow fastest?
Smart and digital valves are set to expand at 13.07% CAGR as plants retrofit predictive capabilities.
Why are pharmaceuticals and biotechnology driving orders?
Cell and gene therapy lines require ultra-clean, precision flow systems, propelling a segment CAGR of 11.3%.
What risks could slow adoption of IIoT-ready devices?
Heightened cybersecurity threats and specialty-alloy shortages could temper near-term deployment.
Page last updated on:






