
Financial Services Application Market Size and Share
Market Overview
| Study Period | 2020 - 2031 |
|---|---|
| Market Size (2026) | USD 187.37 Billion |
| Market Size (2031) | USD 343.64 Billion |
| Growth Rate (2026 - 2031) | 12.92 % |
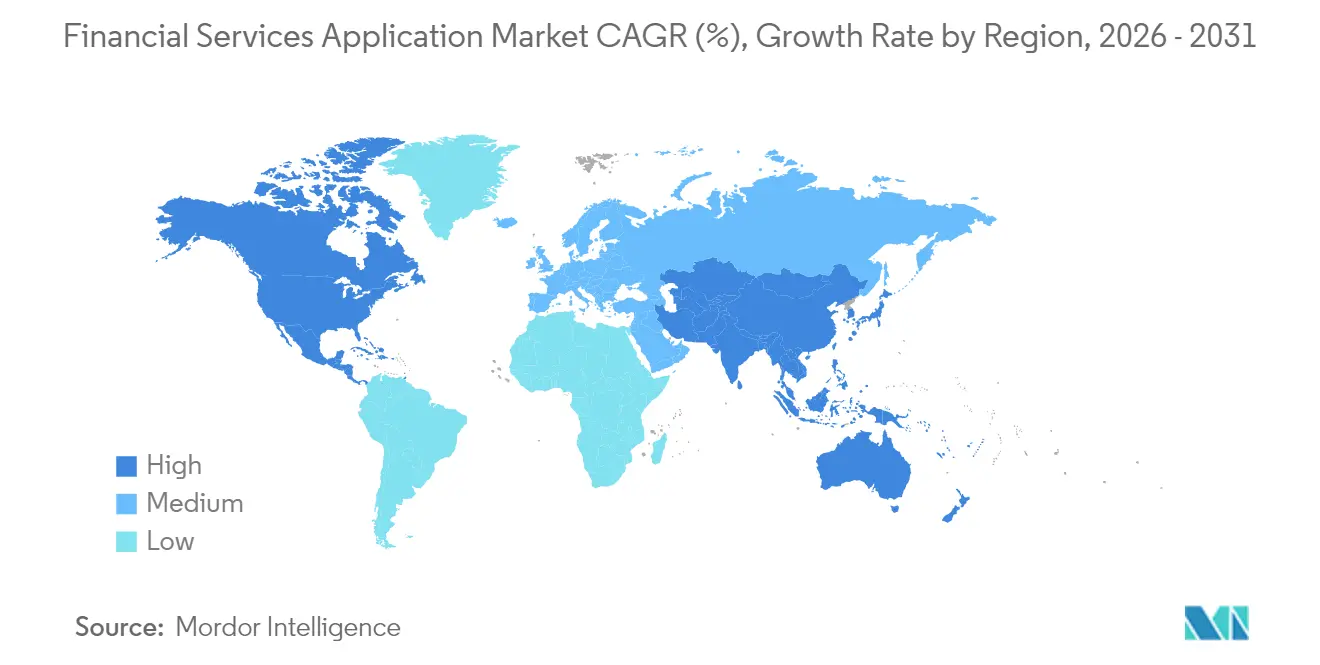
| Fastest Growing Market | Asia Pacific |
| Largest Market | North America |
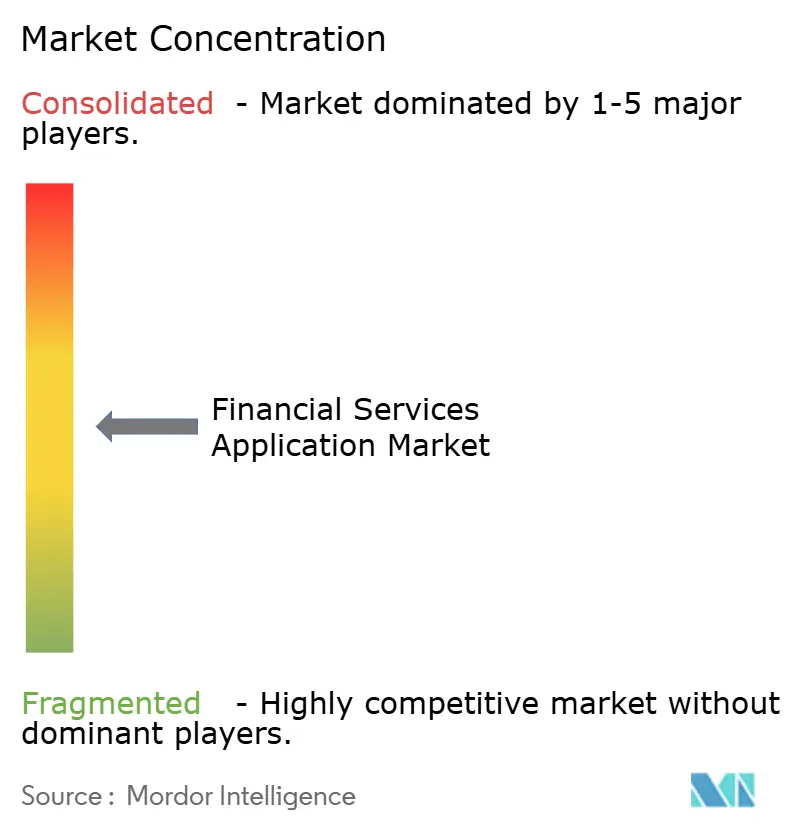
| Market Concentration | Medium |
Major Players *Disclaimer: Major Players sorted in no particular order Image © Mordor Intelligence. Reuse requires attribution under CC BY 4.0. | |
Financial Services Application Market Analysis by Mordor Intelligence
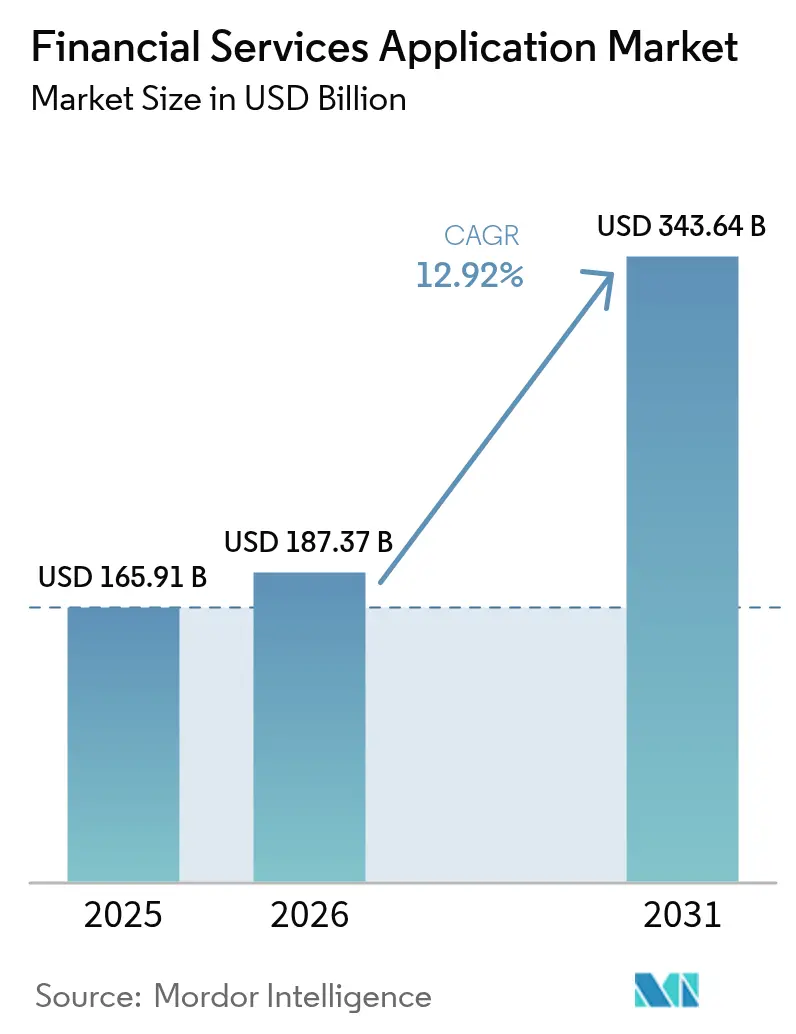
The financial services applications market size was valued at USD 165.91 billion in 2025 and estimated to grow from USD 187.37 billion in 2026 to reach USD 343.64 billion by 2031, at a CAGR of 12.92% during the forecast period (2026-2031). Strong demand stems from regulatory deadlines, cloud-native architectures and AI-enabled customer experience tools that together redefine how institutions build and operate their technology stacks. Software-defined banking, real-time payment rails and open-banking mandates are pushing buyers toward platform ecosystems that replace fragmented point solutions. Vendors that blend AI, analytics and low-code workflow engines into a single environment are capturing share as banks, insurers and capital-markets firms prioritize speed, compliance and personalization. Meanwhile, robust venture funding and large-scale partnerships have reduced barriers to entry, enabling specialist fintech providers to introduce niche capabilities that plug easily into core platforms.
Key Report Takeaways
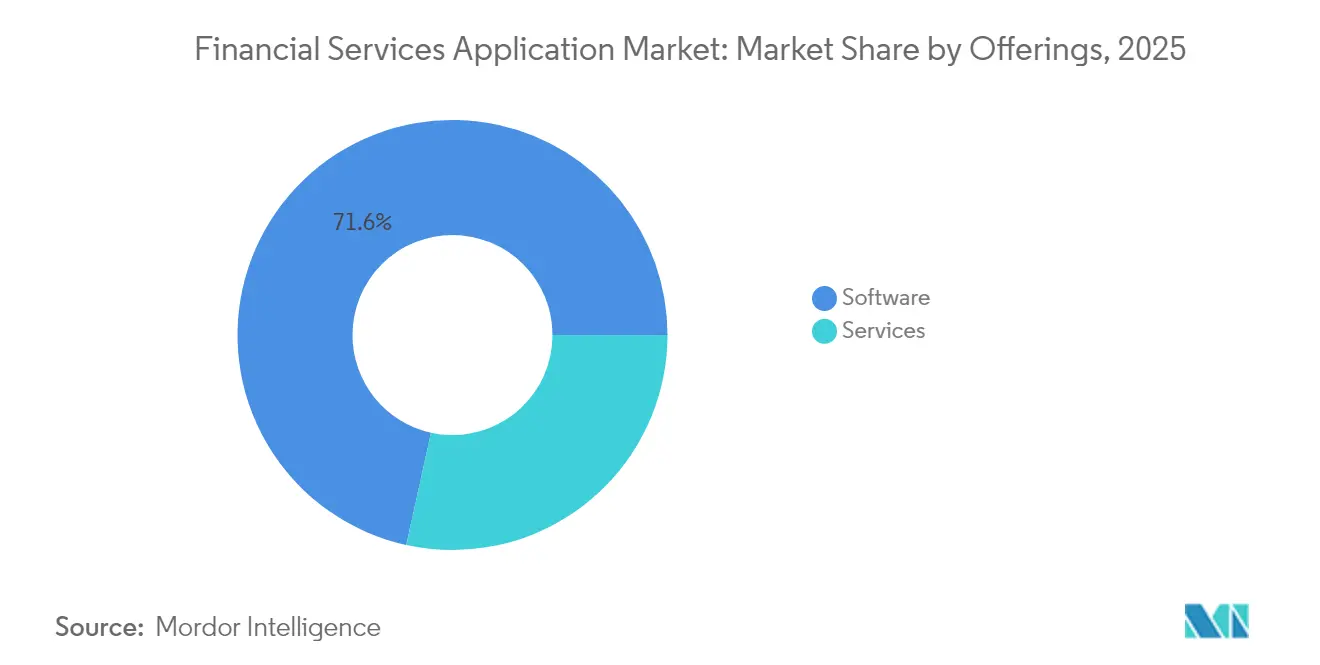
- By offering, software accounted for 71.55% revenue in 2025; BI, analytics & AI suites are expanding at a 14.32% CAGR through 2031.
- By deployment, cloud models captured 63.05% share in 2025, while public-cloud usage is rising at 17.55% CAGR to 2031.
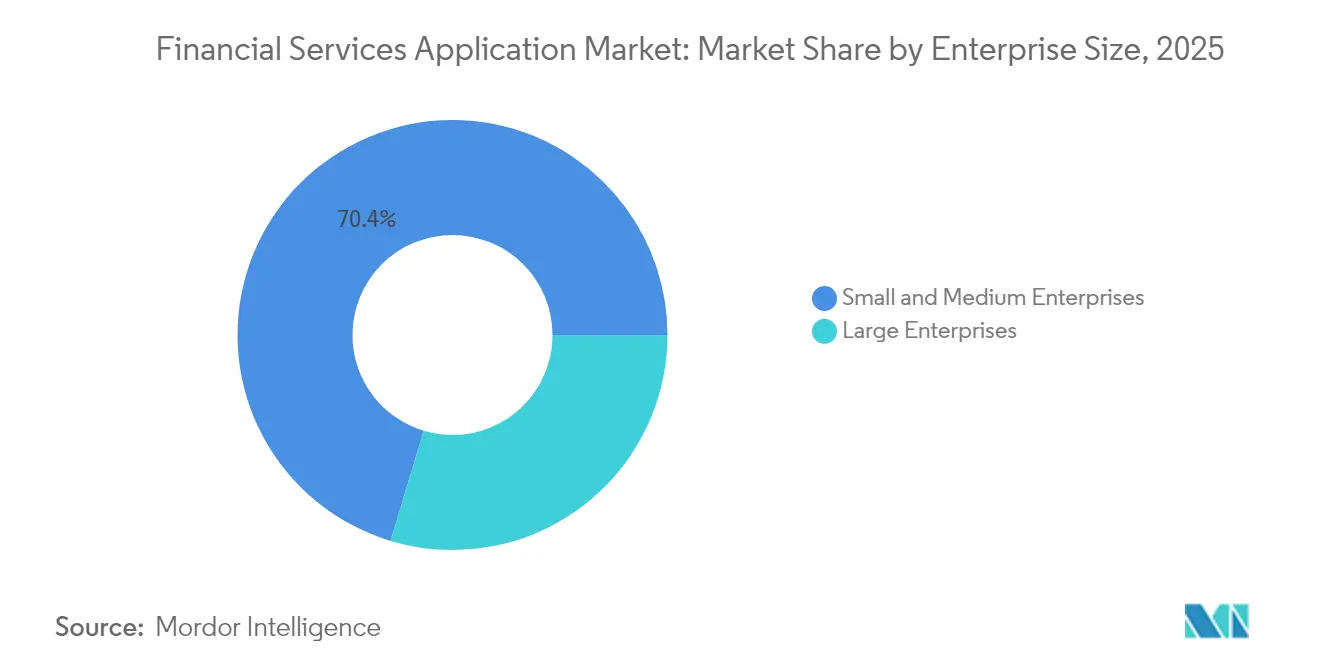
- By enterprise size, large institutions commanded 29.65% revenue in 2025;SMEs show the fastest 15.05% CAGR to 2031.
- By end-user, banks held 70.62% of demand in 2025, whereas fintech and neo-banks are advancing at 14.92% CAGR through 2031.
- By geography, North America led with 37.85% share in 2025; Asia-Pacific is projected to grow the quickest at 12.58% CAGR to 2031.
Note: Market size and forecast figures in this report are generated using Mordor Intelligence’s proprietary estimation framework, updated with the latest available data and insights as of 2026.
Market Trends and Insights
Drivers Impact Analysis of Financial Services Application Market*
| Driver | (~) % Impact on CAGR Forecast | Geographic Relevance | Impact Timeline |
|---|---|---|---|
| Rapid cloud-first core modernisation | +3.2% | North America, Europe | Medium term (2-4 years) |
| AI-driven hyper-personalisation | +2.8% | Global, strongest in Asia-Pacific | Long term (≥ 4 years) |
| Open-banking APIs | +2.1% | Europe expanding to North America and Asia-Pacific | Short term (≤ 2 years) |
| Regulatory push for real-time payments | +1.9% | Global, staggered by market | Medium term (2-4 years) |
| Alternative data monetisation | +1.4% | North America, Europe emerging in Asia-Pacific | Long term (≥ 4 years) |
| Quantum-secure cryptography pilots | +0.8% | Developed markets | Long term (≥ 4 years) |
| Source: Mordor Intelligence | |||
Rapid Cloud-First Core Modernisation Among Tier-1 Banks
Legacy cores restrict scalability, so leading banks are shifting workloads to cloud-native engines that support embedded finance, real-time analytics and continuous deployment. Commerce Bank’s go-live on a Temenos platform cut product launch cycles from months to weeks and illustrated how elastic infrastructure improves customer experience [1]. European and North American institutions are renegotiating outsourcing contracts to accelerate decommissioning of on-premise stacks, freeing capital for innovation. Regulators have clarified that public-cloud usage is acceptable if operational-resilience rules are met, further unlocking budgets. As migration templates mature, mid-tier lenders can reuse proven blueprints, widening the addressable financial services applications market[2].
AI-Driven Hyper-Personalisation to Lift Share-of-Wallet
Banks now embed generative AI directly inside their core workflow to craft context-aware offers, nudge savings behaviour and price risk dynamically. Temenos’ secured AI module runs inference in real time and meets banking-grade privacy rules, helping lenders tailor messages that raise product adoption. Asia-Pacific institutions are pairing alternative data—such as gig-economy income feeds—with AI scoring to reach first-time borrowers. Early adopters report double-digit gains in cross-sell ratios, proving that algorithmic personalisation lifts revenues faster than rate promotions. Continual model-monitoring remains essential, yet institutions that link AI to clean data pipelines are widening the service gap with slower peers.
Open-Banking APIs Catalysing Fintech–Bank Collaboration
EU payment-service directives forced banks to open customer data through standard APIs, transforming data from proprietary asset to collaboration currency. Third-party developers now weave account-aggregation, instant lending and budgeting tools straight into consumer apps, broadening engagement while lowering acquisition cost for incumbents [ECB.EUROPA.EU]. North American regulators are drafting similar rules, and sandbox pilots across Asia-Pacific indicate broad global uptake. Banks that pivot to API-first architectures tap fee income from ecosystem partners rather than compete head-on, making open-banking a durable growth lever for the financial services applications market.
Regulatory Push for Real-Time Payment Rails
Mandates such as the EU Instant Payments Regulation oblige every bank to process euro transfers in seconds by 2025, triggering platform overhauls well beyond the payment module. Commerce Bank’s launch of FedNow through its Temenos stack showed that risk analytics, fraud controls and liquidity tools must all run in real time. Tight implementation windows accelerate procurement decisions, and vendors offering pre-integrated modules gain a decisive edge. Markets that already completed roll-outs, like India and Brazil, demonstrate sustained transaction-volume growth that justifies the upgrade spend, locking in multi-year software contracts.
Restraints Impact Analysis of Financial Services Application Market*
| Restraint | (~) % Impact on CAGR Forecast | Geographic Relevance | Impact Timeline |
|---|---|---|---|
| Escalating core-banking migration costs | -2.4% | Global, higher in developed markets | Medium term (2-4 years) |
| Vendor lock-in and multi-cloud complexity | -1.8% | Global, impacts large enterprises | Long term (≥ 4 years) |
| Scarcity of domain-ready Gen-AI data | -1.3% | Varies by privacy regime | Short term (≤ 2 years) |
| Post-quantum compliance uncertainty | -0.9% | Security-sensitive sectors | Long term (≥ 4 years) |
| Source: Mordor Intelligence | |||
Escalating Core-Banking Migration Costs
Banks budgeting only for licence fees often discover that data cleansing, parallel runs and staff retraining multiply total spend three- to five-fold. IBS Intelligence reported that 55% of institutions see legacy complexity as the primary transformation hurdle. Mid-size lenders face the brunt because they lack dedicated change-management teams, leading to schedule slips that erode projected ROI. Each delay postpones downstream projects such as AI analytics and open-API roll-outs, dampening near-term demand growth for the financial services applications market.
Vendor Lock-In and Multi-Cloud Complexity
Reliance on a single hyperscaler or platform narrows bargaining power and raises exit barriers as interfaces, security policies and staff skills become proprietary. Attempts to hedge risk via multi-cloud introduce new toolchains for observability, encryption and networking that inflate operating expense. The Bank of England flagged cloud concentration as a systemic threat, signalling tougher scrutiny of outsourcing contracts. Large enterprises must weigh resiliency gains against governance overhead, slowing some procurement cycles and tempering growth expectations.
*Our forecasts treat driver/restraint impacts as directional, not additive. The impact forecasts reflect baseline growth, mix effects, and variable interactions.
Financial Services Application Market Segment Analysis
By Offerings:
Software Dominance Drives AI InnovationSoftware solutions held 71.55% of financial services applications market share in 2025 as institutions gravitated toward unified suites that reduce integration effort. BI, analytics and AI modules are projected to post a 14.32% CAGR to 2031, powered by demand for predictive risk scoring and hyper-personalisation.
Services such as consulting, migration and managed operations fill capability gaps for banks without deep IT teams. As cloud adoption scales, vendors are bundling implementation accelerators and low-code tooling to shrink go-live timelines, keeping service revenue on a steady upward path.

By Deployment:
Public Cloud Accelerates Digital TransformationCloud deployments represented 63.05% of the financial services applications market size in 2025, with public cloud usage climbing 17.55% CAGR through 2031. High-availability zones, sovereign-cloud options and regulator-approved blueprints have eased prior security concerns.
Private-cloud and on-premise models persist in jurisdictions with strict data-residency rules, yet cost-benefit analyses increasingly favor refactoring workloads into cloud-native micro-services. Vendors are responding with containerized editions that run identically across environments, giving banks a phased exit route from legacy data centers.
By Enterprise Size:
Micro-Enterprises Drive DemocratizationLarge institutions still generated 29.65% of revenue in 2025 thanks to complex multi-country operations that require broad functionality. However, SMEs are expanding at 15.05% CAGR as subscription pricing and low-code configuration lower entry barriers.
These smaller players often target niche communities or underserved segments and rely on cloud platforms to deliver full-service banking without heavy capital spend. Their success validates the view that competitive advantage comes from customer intimacy rather than owning costly infrastructure, widening the customer base for the financial services applications market.
By End-User:
FinTech Innovation Challenges Traditional BankingBanks accounted for 70.62% demand in 2025, reflecting regulatory obligations and large balance sheets that necessitate end-to-end platforms. Fintech and neo-banks, though smaller in absolute terms, are growing at 14.92% CAGR to 2031 as they embed finance into everyday digital experiences.
Insurers and capital-markets firms adopt specialized modules for risk, portfolio and treasury management, but increasingly tap shared SaaS infrastructure to cut unit costs. Cross-sector convergence—such as insurers offering payment wallets—creates new licensing opportunities for modular vendors.
Geography Analysis
North America Financial Services Application Market
North America led with 37.85% revenue in 2025, underpinned by early cloud adoption, robust venture funding and regulatory clarity around open banking. United States banks pilot AI-driven credit models and instant-payment engines, while Canadian and Mexican lenders prioritise modern savings platforms and card-issuing services.
APAC Financial Services Application Market
Asia-Pacific is set to deliver the highest 12.58% CAGR, fuelled by smartphone-first consumer behaviour, government incentives for digital payments and rapid neo-bank launches. Markets such as India benefit from nationwide real-time payment rails, whereas Australia and Singapore focus on open-data frameworks that spur account-switching and product innovation.
Europe Financial Services Application Market
Europe remains a sizeable, regulation-led buyer segment. PSD2 and the impending instant-payments mandate oblige every credit institution to upgrade API security, fraud analytics and liquidity tools simultaneously. Coupled with post-Brexit competition among UK, German and French fintech hubs, the region keeps vendor pipelines active despite macroeconomic headwinds.
Regulatory Landscape
Regulation continues to drive application modernization, particularly for real-time payments, open banking, and supervisory expectations on cloud outsourcing and operational resilience. In Europe, PSD2-driven API access requirements and the EU Instant Payments Regulation (processing euro transfers in seconds by 2025) are pushing coordinated upgrades across payments, fraud controls, and liquidity tooling, increasing demand for integrated platforms rather than point solutions.
In 2026, global standard setters and regulators extended scrutiny to AI governance and digitized financial crime controls, shaping expectations for model risk management, auditability, and data sharing. The Financial Stability Board issued a June 2026 consultation on sound practices for responsible AI adoption (with comments due July 22, 2026), while FATF highlighted expansion of public-private AML/CFT partnerships (84 operational PPPs globally) and emphasized collaboration across virtual asset service providers and other sectors. In the United States, a May 2026 presidential action called for integrating fintech innovation into regulatory frameworks, reinforcing the need for compliant architectures that can connect digital capabilities into traditional payment systems and regulated workflows.
Value Chain Analysis
The value chain covers solution ideation and product engineering (core banking, risk and compliance, transaction processing, BI/analytics/AI, and CX layers), platform and infrastructure dependencies (hyperscalers, sovereign cloud, identity and security stacks), implementation partners (systems integrators, consulting, and managed services), and distribution through direct enterprise sales and ecosystem marketplaces. For buyers, integration and migration work, data cleansing, parallel runs, testing, and training often account for a large share of program effort, which strengthens the role of services partners alongside software suites.
Operational resilience and third-party risk management are also shaping vendor selection and ongoing governance across the chain. The EU Digital Operational Resilience Act (DORA) reached full application on 17 January 2025, increasing requirements for documented ICT third-party arrangements and exit strategies, which then cascades from financial institutions to critical software providers and their downstream dependencies (including open-source components). Industry coordination is emerging around software supply chain resilience as well, with FINOS announcing in June 2026 its intent to form the Open Source Enterprise Resiliency Alliance (OSERA), reflecting a more mutualized approach to managing systemic open-source and Nth-party risks that can affect banking and payments platforms.
Competitive Landscape
The field is moderately fragmented: global platform vendors coexist with deep-focus fintech specialists. Leaders like Temenos, Fiserv and FIS bundle core processing, analytics and channel apps, positioning themselves as one-stop shops for digital transformation. Their scale enables multi-year investment in generative AI, quantum-secure encryption and low-code tooling.
Specialists differentiate through speed or function—examples include AI-only credit-risk engines and cross-border payment orchestrators. Partnerships and MandA remain common; Temenos’ divestment of Multifonds and Fiserv’s pending Payfare deal illustrate portfolio pruning to double-down on cloud and embedded finance.
Institutions increasingly shortlist vendors that demonstrate open APIs, regulator-approved reference architectures and a roadmap for zero-downtime upgrades. This platform preference accelerates consolidation, yet sustained fintech entry keeps pricing and innovation pressure high, balancing the landscape.
Financial Services Application Industry Leaders
-
Accenture Plc
-
FIS Corporation
-
Fiserv, Inc.
-
IBM Corporation
-
Infosys Limited
- *Disclaimer: Major Players sorted in no particular order
Financial Services Application Market Companies Covered in this Report
- Accenture plc
- Fidelity National Information Services, Inc. (FIS)
- Fiserv, Inc.
- International Business Machines Corporation (IBM)
- Infosys Limited
- Finastra Group Holdings Limited
- Oracle Corporation
- SAP SE
- Tata Consultancy Services Limited
- Temenos AG
- Microsoft Corporation
- Salesforce, Inc.
- Avaloq Group AG
- Intellect Design Arena Limited
- Jack Henry and Associates, Inc.
- Cognizant Technology Solutions Corporation
- NCR Corporation
- Silverlake Axis Ltd
- Mambu B.V.
- nCino, Inc.
Market Opportunities and Future Outlook
A key opportunity is enterprise-wide modernization programs that combine cloud migration, security and operational resilience controls, and platform rationalization, rather than single-module replacements. Buyer requirements are increasingly framed around running regulated workloads on cloud infrastructure with auditable controls and portability, reflecting heightened scrutiny of ICT third-party arrangements and exit planning. Recent execution provides examples of spend and organizational commitment: Intesa Sanpaolo completed migration of core IT systems to Google Cloud regions in Italy hosted in TIM data centers (supporting its Isytech platform), and Absa Group reported 5.4 million digitally active customers alongside increased investment into digital infrastructure, cybersecurity, and cloud capabilities.
Another near-term opportunity is scaling AI from pilots into governed production workflows, especially for onboarding, servicing, underwriting, and fraud operations, where banks want measurable cycle-time reduction without compromising privacy and compliance. The market is moving toward packaged, domain-specific AI capabilities embedded into financial applications, including agentic workflow constructs, which increases demand for data foundations, model monitoring, and integration accelerators that connect AI to core and payment systems. In parallel, open-data expansion beyond banking is creating additional application demand: the UK Financial Conduct Authority set out an open finance roadmap and plans a discussion paper in Q4 2026 on the first open finance scheme, establishing a concrete policy timetable that software vendors and integrators can align to for consent, data-sharing, and interoperability features.
Recent Industry Developments in Financial Services Application Market
- June 2026: Accenture partnered with ServiceNow to launch AI-powered services designed to accelerate migration from legacy risk platforms onto the ServiceNow AI Platform. The initiative focuses on regulated risk and compliance workflows where modernization is constrained by technical debt and operational resilience requirements, supporting demand for packaged transformation services alongside platform software.
- May 2026: Fiserv launched agentOS, an agentic AI operating system aimed at helping financial institutions deploy and manage AI agents across banking workflows, developed with OpenAI and AWS Bedrock. This product move advances application roadmaps toward embedded, governed AI execution layers that sit closer to core systems and operational processes.
- January 2026: FIS completed the acquisition of Global Payments' Issuer Solutions business for USD 13.5 billion, alongside the sale of its stake in Worldpay to Global Payments. The transaction reshapes portfolio focus across payments and issuer processing, with implications for platform bundling, cross-sell into banking clients, and competitive positioning among large financial software vendors.
Financial Services Application Market Report Scope and Research Methodology
Market Definition and Coverage
This market covers software applications and related services used by financial institutions to run core transaction processes and customer-facing activities, as well as functions like risk, compliance, analytics, and operations. Values are calculated in USD for the global demand across banks, insurers, capital market firms, and similar users.
Scope exclusions: The sizing does not include general IT hardware spending or non-financial enterprise applications that are not primarily purchased for financial services workflows.
Segments Covered in This Report
- By Offerings
- Software
- Core Banking Platforms
- Audit, Risk and Compliance
- Business Transaction Processing
- BI, Analytics and AI Suites
- Customer Experience and CRM
- Enterprise IT (ERP, HR, Finance)
- Services
- Consulting
- Integration and Migration
- Training and Support
- Operations and Managed Services
- Software
- By Deployment
- Cloud
- On-premise
- By Enterprise Size
- Small and Medium Enterprises
- Large Enterprises
- By End-User
- Banking
- Insurance
- Capital Markets
- FinTech / Neo-banks
- By Geography
- North America
- United States
- Canada
- Mexico
- South America
- Brazil
- Argentina
- Rest of South America
- Europe
- Germany
- United Kingdom
- France
- Italy
- Spain
- Russia
- Rest of Europe
- Asia-Pacific
- China
- Japan
- India
- South Korea
- Australia and New Zealand
- Rest of Asia-Pacific
- Middle East and Africa
- Middle East
- Saudi Arabia
- United Arab Emirates
- Turkey
- Rest of Middle East
- Africa
- South Africa
- Nigeria
- Egypt
- Rest of Africa
- Middle East
- North America
Data Sources, Market Sizing, and Validation
Desk Research
Desk research was used to build the base structure of the model and to set realistic guardrails around adoption and spend. We relied on public sources such as central bank and financial regulator publications, payments and settlement body statistics, OECD and World Bank indicators, and IT and cybersecurity guidance from agencies such as NIST, alongside academic journals on banking technology and operational risk.
On top of this, we reviewed annual reports, investor presentations, and press releases from application providers and major financial institutions to understand product scope and typical deployment patterns. For cross-checking, we also used paid subscriptions that track company financials, public news and filings, and patent activity to validate where product focus and investment were moving. These examples are not exhaustive, and other public and paid sources were referenced throughout data collection, validation, and clarification.
Primary Interviews and Surveys
Primary interviews and surveys were run with a mix of application vendors, implementation partners, and end users inside financial institutions to confirm what is actually being bought and renewed. Respondent input was used to tighten assumptions on the deployment mix, typical scope of service bundles (implementation, support, operations), and how spending differs by institution size and region, then to sanity-check the demand signals from desk research.
Distribution of primary research fieldwork respondents
| Company type | Respondent position | Region |
|---|---|---|
| Top tier: 35% | CXOs: 14% | APAC: 44% |
| Mid tier: 44% | Functional/Unit leaders: 42% | EMEA: 29% |
| Smaller Players: 21% | Managers: 44% | Americas: 27% |
Market-Sizing & Forecasting
Sizing started with a top-down build where financial-services IT spend signals and digital adoption markers were translated into an addressable application pool, then allocated across software and service components using observed mix patterns. To keep totals realistic, we corroborated the results with selective bottom-up approximations, such as sample vendor revenue scaling, typical price-per-user or price-per-institution checks, and implementation and support spend ratios gathered from interviews.
Key inputs that shaped the model included cloud versus on-premises deployment share, compliance and risk management investment cycles, transaction processing modernization intensity, analytics and customer experience platform uptake, and enterprise size mix across financial institutions. Forecasts were built using scenario analysis supported by primary feedback on budget direction, regulatory pressure, and upgrade timing, and then translated into a year-by-year growth path that avoided one-time spike effects. Where bottom-up visibility was limited in smaller regions or niche application types, gaps were handled through conservative penetration assumptions that were expanded only when multiple interviewees described the same spend and renewal behavior.
Data Validation & Update Cycle
Validation was done in several passes so the final numbers do not depend on a single assumption. Model outputs were checked against independent signals, including financial-services IT spending direction, cloud migration pace, and reported outsourcing and managed services trends, and then anomalies were reviewed before sign-off.
If a value looked out of range, we re-opened the drivers, re-checked currency timing and unit definitions, and re-contacted sources when needed. Reports are refreshed annually, with interim updates when major events change budgets, regulations, or deployment patterns, and a final pre-delivery pass is completed so clients receive the latest view.
Mordor Intelligence's Global Financial Services Application Market Market Size Measured Against Other Published Estimates
It is common to see different market size numbers for financial services applications because publishers do not always count the same items. The biggest swings usually come from how far the scope extends into adjacent IT categories, how services are bundled with software, and whether the estimate is anchored to realistic adoption and pricing for the banking, insurance, and capital markets user base.
Here, software categories like transaction processing, customer experience, and audit, risk and compliance are counted alongside related consulting, integration, and operations and maintenance services that are directly tied to delivering and running these applications. Some other estimates expand into broader enterprise application spend or wider financial technology totals, and the spread becomes larger when aggressive long-range growth is applied without checking deployment mix and renewal behavior. For that reason, the counted scope is kept tight and refreshed at the application level in Mordor Intelligence.
Some differences also come from how each publisher sets its base year and whether service bundles are allocated consistently between software and services, which can shift totals even when growth assumptions are similar.
Benchmark comparison
| Source | Market Size | Gaps in Research Methodology |
|---|---|---|
| Mordor Intelligence | USD 165.91 B (2025) | |
| Global Consultancy A | USD 1450.49 B (2025) | Uses a much wider definition that appears to fold in broad financial services software and related technology spending beyond dedicated application and delivery services, which inflates the total even if growth assumptions are moderate. |
| Industry Publisher B | USD 181.50 B (2026) | Starts from a different base year and is presented as an estimated 2026 value, so differences can come from the year shift, exchange-rate timing, and how software versus service bundles are split in the starting point. |
The table shows that the main differences are not just about growth rates, they are about what gets counted and the exact timing of the base year. By keeping inclusions tied to financial services application software plus directly attached services, and then checking the result with pricing and deployment indicators, the estimate stays traceable to repeatable inputs and can be updated cleanly when budgets or adoption move.
Key Questions Answered in the Report
What is the projected growth of the financial services applications market to 2031?
The market is expected to rise from USD 165.91 billion in 2025 to USD 343.64 billion by 2031 at a 12.92% CAGR.
Which offering captures the largest share of spending today?
Software suites hold 71.55% of 2025 revenue, led by BI, analytics and AI modules growing at 14.32% CAGR.
Why is public cloud adoption accelerating among banks?
Regulator-approved security frameworks and lower total cost of ownership pushed cloud deployments to 63.05% share in 2025, with public-cloud workloads advancing at 17.55% CAGR.
Which region is expanding the fastest?
Asia-Pacific leads with a forecast 12.58% CAGR as mobile-first consumers and supportive regulations drive digital-banking uptake.