
Filling Machines Market Size and Share
Market Overview
| Study Period | 2020 - 2031 |
|---|---|
| Market Size (2026) | USD 8.3 Billion |
| Market Size (2031) | USD 10.29 Billion |
| Growth Rate (2026 - 2031) | 4.39 % |
| Fastest Growing Market | Asia-Pacific |
| Largest Market | Asia-Pacific |
| Market Concentration | Low |
Major Players.webp) *Disclaimer: Major Players sorted in no particular order Image © Mordor Intelligence. Reuse requires attribution under CC BY 4.0. | |
Filling Machines Market Analysis by Mordor Intelligence
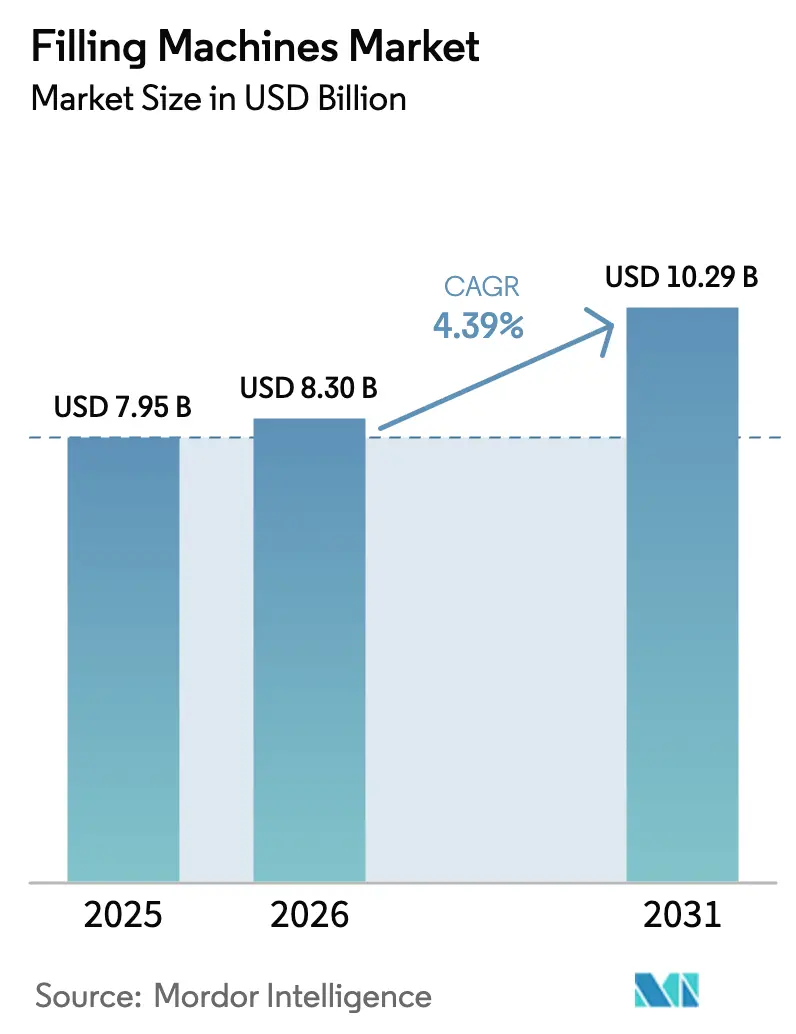
The filling machines market size was valued at USD 7.95 billion in 2025 and estimated to grow from USD 8.3 billion in 2026 to reach USD 10.29 billion by 2031, at a CAGR of 4.39% during the forecast period (2026-2031). Demand is shifting from pure capacity additions toward equipment that blends speed with rapid changeovers, digital diagnostics, and regulatory‐ready hygiene. Growth is propelled by tighter food-safety and pharmaceutical standards that trigger replacement cycles, the worldwide SKU explosion that forces factories to run smaller lots, and the surge in ready-to-drink (RTD) beverages that require ultra-clean, high-speed lines. Asia-Pacific holds the largest regional foothold and the strongest expansion outlook, driven by China and India’s investments in food processing and biologics manufacturing. Rotary systems remain the workhorse for high-volume beverage lines, but aseptic platforms and fully automatic lines are scaling faster as biologics, premium beverages, and labor shortages reshape plant economics.
Key Report Takeaways
- By equipment type, rotary filling systems led with 23.10% of filling machines market share in 2025, while aseptic systems are projected to expand at a 7.12% CAGR through 2031.
- By automation level, semi-automatic machines accounted for 57.80% of the filling machines market size in 2025; fully automatic systems post the highest 5.42% CAGR to 2031.
- By end-user industry, food-and-beverage held 40.10% revenue share in 2025; pharmaceuticals and biologics recorded the fastest 7.28% CAGR between 2026-2031.
- By container type, bottles dominated at 35.10% in 2025, yet cans are advancing at an 8.05% CAGR on sustainability grounds.
- By geography, Asia-Pacific captured 39.20% of the filling machines market in 2025 and is growing at 8.42% CAGR to 2031.
Note: Market size and forecast figures in this report are generated using Mordor Intelligence’s proprietary estimation framework, updated with the latest available data and insights as of 2026.
Market Trends and Insights
Drivers Impact Analysis of Filling Machines Market*
| Driver | (~)% Impact on CAGR Forecast | Geographic Relevance | Impact Timeline |
|---|---|---|---|
| Growth of RTD beverage demand for high-speed hygienic lines | +1.2% | Global, with concentration in APAC and North America | Medium term (2-4 years) |
| Rising adoption of aseptic technology for shelf-life extension | +0.9% | Global, led by Europe and North America pharmaceutical hubs | Long term (≥ 4 years) |
| Automation uptake to offset skilled-labor shortages | +0.8% | North America & EU primarily, expanding to APAC | Short term (≤ 2 years) |
| Stricter food-safety regulations mandating equipment upgrades | +0.6% | Global, with stringent enforcement in developed markets | Medium term (2-4 years) |
| Quick-changeover agility for multi-SKU DTC brands | +0.5% | North America & EU, emerging in urban APAC centers | Short term (≤ 2 years) |
| AI-enabled inline inspection driving predictive-maintenance ROI | +0.4% | Advanced manufacturing regions globally | Long term (≥ 4 years) |
| Source: Mordor Intelligence | |||
Growth of RTD Beverage Demand for High-Speed Hygienic Lines
RTD beverages are on a clear path toward USD 1 trillion by 2032, forcing bottlers to install lines that exceed 100,000 bottles per hour without compromising sterility, Dairy Foods. Dairy-based RTD products contain proteins and functional additives that are heat-sensitive, so lines must deliver laminar filling and instantaneous cleanup. Sugar-reduced and lactose-free variants raise viscosity challenges that piston-pump or mass-flow-meter systems solve by self-adjusting flow rates. Krones recently delivered a PET line to Nu-Pure Beverages that marries filling, capping, and inspection in one frame to save floor space. Consumer cravings for convenience, combined with premium nutrition trends, keep fuelling investment in modular systems capable of flipping between multiple RTD recipes while holding microbial counts below accepted limits.
Rising Adoption of Aseptic Technology for Shelf-Life Extension
Aseptic filling accelerated in 2024 as pharmaceutical and food companies looked to cut cold-chain costs by as much as 40% through ambient-storage solutions, FDA.[1]U.S. Food & Drug Administration, “Guidance for Industry: Sterile Drug Products Produced by Aseptic Processing,” fda.gov Emergent BioSolutions adopted SA25 robotic workcells that isolate product, container, and operator, achieving flexible vial sizing and higher sterility assurance. Updated FDA guidance highlights metering pump accuracy and sterilization validation, prompting vendors to install gloveless isolators that slash intervention risk while speeding biologic throughput. Food brands use the same aseptic principles to offer preservative-free juices with a 12-month shelf life, signaling cross-sector design convergence.
Automation Uptake to Offset Skilled-Labor Shortages
Eight in ten pharmaceutical plants reported validation-engineer gaps in 2024, delaying line qualifications by up to 12 months and encouraging automation. Mary Kay’s mascara line cut staffing from 14 to 2 operators after integrating servo-positioned fillers, lifting output to 60 pieces per minute, Packaging World. AI algorithms now tweak nozzle alignment and temperature in real-time, clipping unplanned downtime by 30% and lowering utilities. As digital twins gain ground, suppliers deliver pre-validated recipe sets that shorten factory acceptance testing and free scarce talent.
Stricter Food-Safety Regulations Mandating Equipment Upgrades
The Food Safety Modernization Act (FSMA) enforces hazard-analysis protocols that demand corrosion-resistant surfaces and documented clean-in-place cycles Federal Register.[2]Federal Register, “FSMA Final Rule on Preventive Controls for Human Food,” federalregister.govAnnex 1 revisions also push pharma fillers toward closed isolators with real-time viable particle monitoring, Hygenix. Producers, therefore, specify hygienic welds, drain-friendly angles, and integrated sensor suites that auto-log pressure, flow, and temperature. Unified design standards are emerging, letting vendors sell one platform to both pharma and food plants, trimming R&D costs while widening reach.
Restraints Impact Analysis of Filling Machines Market*
| Restraint | (~) % Impact on CAGR Forecast | Geographic Relevance | Impact Timeline |
|---|---|---|---|
| High upfront CAPEX for advanced filling systems | -0.8% | Global, particularly impacting emerging markets | Short term (≤ 2 years) |
| Complex region-specific validation and compliance burden | -0.6% | Global, with highest impact in regulated industries | Medium term (2-4 years) |
| Supply volatility of pharma-grade single-use components | -0.4% | Global pharmaceutical manufacturing regions | Short term (≤ 2 years) |
| Shortage of validation engineers delaying line deployment | -0.3% | North America & EU primarily | Medium term (2-4 years) |
| Source: Mordor Intelligence | |||
High Upfront CAPEX for Advanced Filling Systems
Cutting-edge aseptic fillers can top USD 5 million, with qualification adding 25% to project budgets, straining SMEs and emerging-market processors. Single-use bags lower cleanup costs but impose six-figure annual consumable bills. Contract manufacturers shoulder much of this capex, but capacity still lags demand, sustaining long lead times.
Complex Region-Specific Validation and Compliance Burden
Distinct FDA, EMA, and PMDA requirements oblige separate documentation sets, raising engineering hours and delaying site acceptance tests ISPE. Multi-agency raw-material scrutiny compounds delays, contributing to 27% of drug shortages worldwide. Harmonization under ICH Q12 is progressing slowly, so vendors must maintain configurable validation packages that inflate pricing.
*Our forecasts treat driver/restraint impacts as directional, not additive. The impact forecasts reflect baseline growth, mix effects, and variable interactions.
Filling Machines Market Segment Analysis
By Equipment Type:
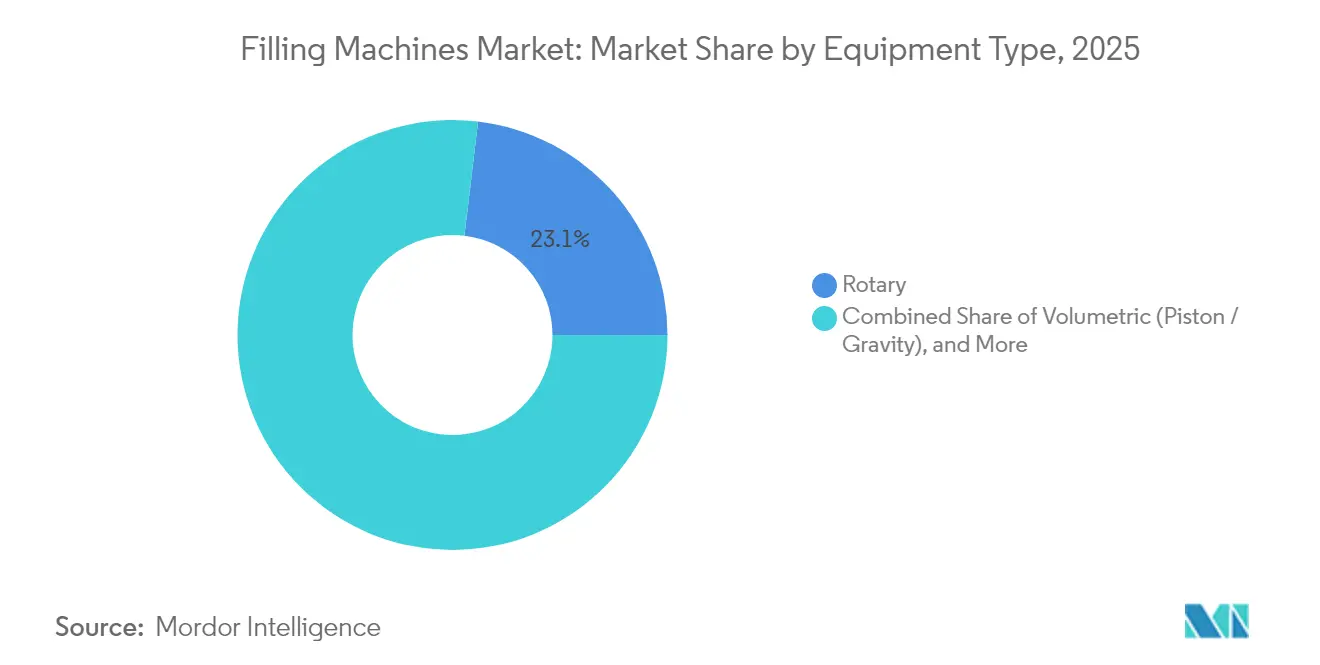
Rotary Reigns While Aseptic AcceleratesRotary platforms delivered 23.10% of the 2025 filling machines market share, owing to proven uptime in carbonated and still beverage lines. Downstream, aseptic units post the headline 7.12% CAGR to 2031 as biologics and preservative-free juices demand hermetically sealed dosing cells. The filling machines market size for aseptic units is expected to grow, underscoring supplier focus on isolated robotics. Suppliers blend piston, mass-flow, and time-pressure modules within one chassis, giving plants latitude to process water-like sports drinks in the morning and high-viscosity smoothies by night.
Volumetric piston fillers persist in sauces and creams, while net-weight systems gain favor for 1% pharma dosing. Tetra Pak’s A1 1100 merges aseptic barriers with 7-row drives to deliver 40,000 packs per hour Tetra Pak. Powder fillers are now grafted onto liquid lines, letting CDMOs diversify revenue without adding new cleanrooms.


By Automation Level:
Semi-Automatic Dominates but Full Automation Gains PaceSemi-automatic machines held 57.80% of the filling machines market share in 2025 by balancing capital restraint with operator control. Yet full automation races at 5.42% CAGR, nudged by wage inflation and validation-engineer shortages. The filling machines market size for fully automatic lines is projected to widen, aided by AI self-diagnostics that slash downtime. IoT-linked HMIs feed data directly into enterprise quality systems, trimming human paperwork. Manual tabletop units remain indispensable for fragile cosmetics and pilot-scale pharma batches that need human finesse.
Hybrid systems now embed cobots that load trays or apply traceable labels, marrying manual dexterity with machine repeatability. As regulatory audits migrate online, factories push for auto-generated audit trails, turning software capability into a core tender criterion.
By End-User Industry:
Food & Beverage Holds Scale, Pharma Leads GrowthFood and beverage claimed 40.10% of revenue in 2025, sustained by a post-pandemic surge in functional drinks and low-sugar dairy. However, pharma and biologics outpace all with 7.28% CAGR as cell-and-gene therapies and injectable biologics proliferate. The filling machines market size for pharma is set to widen as CDMOs race to add clean isolators and low-volume nests. Cosmetics edge upward on premium skincare requiring airless pumps.
Biologic vial fillers must load nested containers inside RABS or isolators while meeting ≤ 0.5 µm particle targets. The overlap of pharma and high-value food safety rules is coaxing suppliers to design one chassis certified for both, improving ROI.

By Container Type:
Bottles Lead, Cans Accelerate on Recycling AppealBottles, glass, or PET secured a 35.10% share in 2025, given their ubiquity across soft drinks, nutraceuticals, and personal care. Aluminum cans nevertheless advance at 8.05% CAGR under corporate carbon commitments and craft beverage migration to sleek formats. The filling machines market size for can lines rises fastest in North America, where breweries retrofit for nitrogen-infused coffees and hard seltzers.
Pouches and sachets are gaining in condiments and baby food, requiring gentle vacuum fillers to avoid air pockets. Vials and syringes are climbing in pharma due to home injectables. Equipment able to switch from cans to slim aluminum bottles in one shift now wins bids.
By Filling Technology:
Piston Dominance Meets Mass-Flow PrecisionPiston fillers delivered 24.20% of 2025 spend as positive displacement tackles chunky soups and lotions effectively. Mass-flow meters grow at 7.02% CAGR to 2031, supplying ±0.2% accuracy and inline verification that suits regulated drugs and RTD coffees with dairy. The filling machines market size for mass-flow lines is projected to double over the forecast period as IoT metrology prices fall.
Gravity remains the value choice for water and wine vats, while vacuum overflow fills fragile perfumes without foaming. Auger systems shake up nutraceutical capsules. GEA’s SmartFil offers more than 100 tool-less configurations for powder dosing.
Geography Analysis
APAC Filling Machines Market
Asia-Pacific generated 39.20% of 2025 revenue and is growing at 8.42% CAGR, reflecting China and India’s investments in shelf-stable dairy and vaccine fill-finish plants. Vietnam and Indonesia expand beverage capacity, aided by free-trade pacts that lure multinational co-packers. Local OEMs now license servo drives from European partners, trimming entry-level machine cost and boosting regional competitiveness.
North America Filling Machines Market
North America sits second by value, supported by high-margin biologics, craft beverages, and reshoring commitments to cut supply risk. Grants under the US Inflation Reduction Act channel funds to aseptic syringe lines, while Canadian dairy co-ops renew pouch fillers with energy-recovery CIP loops. The filling machines market size for North America is forecast to climb steadily as predictive-maintenance contracts bundle hardware, software, and spares into subscription models.
EMEA and South America Filling Machines Market
Europe remains the innovation nucleus, with German, Italian, and Swedish vendors exporting digital isolators and recyclable-pack-ready can fillers. The EU Green Deal targets accelerate the deployment of low-carbon motors and closed-loop water systems. Eastern Europe is converting outdated gravity lines to servo-driven net-weight platforms to serve private-label exporters. Middle East & Africa and South America trail in installed base yet show double-digit demand for entry-level rotary units in dairy, juice, and pharma secondary packaging.


Regulatory Landscape
Filling machines are shaped by overlapping safety, hygienic design, and quality requirements across major end-use sectors. In the European Union, the machinery safety framework is being updated through Regulation (EU) 2023/1230, which replaces the legacy Machinery Directive 2006/42/EC and tightens expectations around risk assessment, documentation, and conformity procedures that affect machine design, guarding, and functional safety for filling lines sold into the EU.
Across global procurement, OEMs commonly map designs to ISO 12100 (risk assessment and reduction) and regional machinery standards such as ANSI/PMMI B155.1 in the United States, alongside CE marking obligations in Europe. For regulated applications, compliance extends into operational and material requirements: pharmaceutical fill-finish environments must align with cGMP (21 CFR Parts 210/211) and aseptic processing expectations, while food and beverage buyers increasingly reference ISO 22000 and FSSC 22000 in supplier qualification. Material-contact choices, such as FDA 21 CFR 177.2600 for certain elastomers, and validated cleaning or sterilization documentation influence seals, product paths, and electronic record trails bundled with modern fillers.
Competitive Landscape
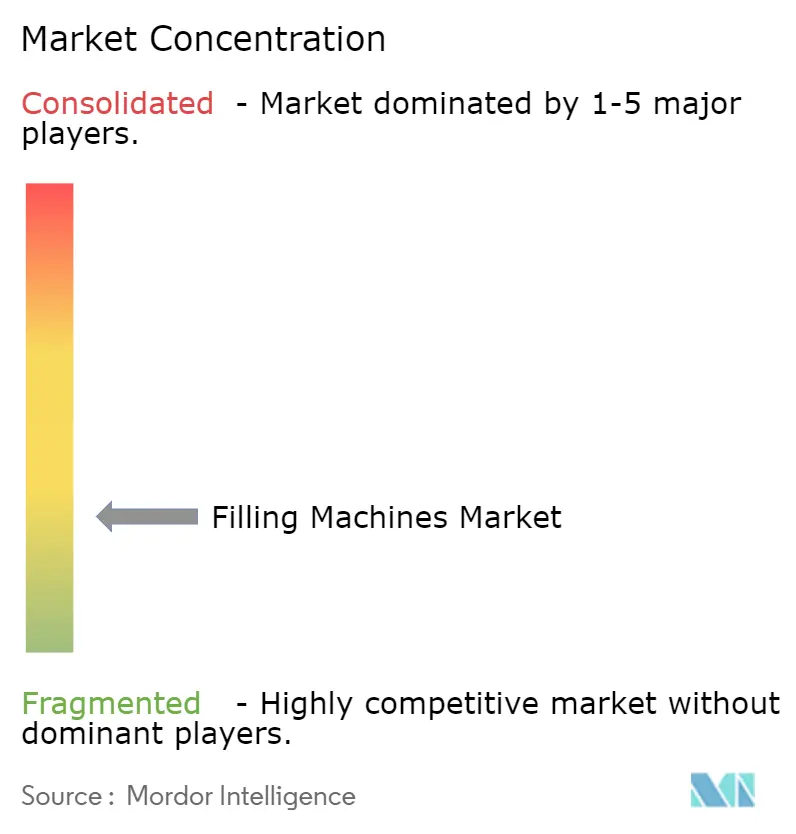
The landscape is moderately fragmented. Leaders pursue vertical integration to deliver full “cap-to-case” solutions. Krones acquired Netstal for injection molding and W.M. Sprinkman for US process tanks, broadening dairy offerings and shortening delivery in the Americas Krones. Tetra Pak opened a Swedish fermentation R&D hub to anchor its filling core with upstream processing. Sidel scales PET preform simulation tools that link directly to its EvoFILL platforms.
Digital capability is now decisive. Antares Vision bought FT System for EUR 67.7 million, embedding ROBO-QCS vision across 5,200 fillers and granting customers AI-driven defect analytics PowderBulkSolids. ProMach picked up MBF and Zacmi, strengthening niche wine and viscous food competencies. Mid-tier Asian players focus on price-performance mixes, offering servo-based rotary lines at 20% discount to EU models, gaining share in ASEAN breweries.
White-space opportunities include cell-and-gene aseptic micro-fills and RTD coffee nitro can lines. Sustainability pushes drive R&D into low-temperature sterilants and recyclable monomaterial pouch fillers. OEMs bundle IIoT platforms with lifetime service to lock in revenue and insulate against commoditization.
Filling Machines Industry Leaders
JBT Corporation
Ronchi Mario SPA
Barry-Wehmiller Companies Inc.
Krones AG
Tetra Laval Group
- *Disclaimer: Major Players sorted in no particular order
Filling Machines Market Companies Covered in this Report
- Krones AG
- Tetra Laval Group
- Syntegon Technology GmbH
- KHS GmbH
- JBT Corporation
- Ronchi Mario S.p.A.
- Barry-Wehmiller Companies Inc.
- Coesia Group
- GEA Group AG
- Serac Group
- IMA Group
- Shibuya Corporation
- Pro Mach Inc.
- Accutek Packaging Equipment
- Shemesh Automation
- US Bottlers Machinery
- Fuji Machinery Co. Ltd.
- OPTIMA Packaging Group
- Adelphi Group

Market Opportunities and Future Outlook
A whitespace is emerging around high-throughput, robotics-enabled modules that reduce footprint and improve flexibility in container handling upstream of the filler. In May 2026, Krones introduced its Robobox SynFlow robotic container distribution system, with stated throughput ranges of 55,000 to 105,000 containers per hour. The rollout reflects buyer demand for automation that stabilizes line efficiency as SKU counts rise and manual handling becomes a constraint, which creates an opening for OEMs and integrators to standardize robotic infeed and outfeed, changeover logic, and diagnostics as a retrofit layer for legacy rotary and net-weight lines, particularly in beverage and high-volume food plants.
A second opportunity is expanding into ready-meal and premium pet food production models that want end-to-end processing, aseptic handling, and flexible packaging with fast changeovers. In May 2026, JBT Marel signed an exclusive partnership with Aurum Process Technology to integrate aseptic food processing with flexible packaging solutions, underscoring active moves by filling-machine suppliers to extend beyond the filler into validated process-to-pack architectures. The market also continues to reward equipment that simplifies cross-region compliance, such as configurable validation packages aligned to FDA/EMA/PMDA expectations, and that embeds connectivity for audit-ready traceability. This creates room for differentiation through software, inspection, and service, rather than competing on capacity alone.
Recent Industry Developments in Filling Machines Market
- May 2026: Ronchi Mario SpA is featured in Italia Imballaggio in connection with Interpack 2026. The feature highlights the company’s 60th anniversary and advancements in filling and robotics.
- March 2026: Barry-Wehmiller (BW Packaging) announced its Interpack 2026 product lineup including Angelus seaming, Hayssen bagging, and Sleevit labeling systems. The announcement points to consolidation and integrated packaging-line solutions, with potential pull-through for BW Packaging brands in the global market.
- January 2025: Antares Vision bought FT System for EUR 67.7 million, expanding vision-inspection capabilities across 5,200 fillers worldwide. The deal strengthens AI-driven defect analytics and end-to-end digital QC across the installed base.


Filling Machines Market Report Scope and Research Methodology
Market Definition and Coverage
For this study, the market covers the revenue generated from filling machines used to dose liquids, semi-liquids, powders, or granules into containers in industrial packaging lines, including the sale of new equipment and the standard integration needed to run the machine at site.
Scope exclusions: Used equipment resale, standalone labeling and secondary packaging machines, and routine plant utilities are not counted unless they are bundled and priced as part of the filling machine purchase.
Segments Covered in This Report
- By Equipment Type
- Aseptic
- Rotary
- Volumetric (Piston / Gravity)
- Net-Weight
- Other Equipment Types
- By Automation Level
- Fully-Automatic
- Semi-Automatic
- Manual / Hand-held
- By End-User Industry
- Food and Beverage
- Pharmaceutical and Biologics
- Cosmetics and Personal Care
- Chemicals and Industrial
- Others End-User Industries
- By Container Type
- Bottles
- Cans
- Pouches and Sachets
- Tubes and Cartridges
- Vials / Syringes
- Other Container Types
- By Filling Technology
- Gravity
- Piston
- Time-Pressure
- Mass / Flow-Meter
- Vacuum
- Auger (Powder)
- By Geography
- North America
- United States
- Canada
- Mexico
- Europe
- Germany
- United Kingdom
- France
- Italy
- Spain
- Russia
- Rest of Europe
- Asia-Pacific
- China
- India
- Japan
- South Korea
- Australia and New Zealand
- Rest of Asia-Pacific
- Middle East and Africa
- Middle East
- United Arab Emirates
- Saudi Arabia
- Turkey
- Rest of Middle East
- Africa
- South Africa
- Nigeria
- Egypt
- Rest of Africa
- Middle East
- South America
- Brazil
- Argentina
- Rest of South America
- North America
Data Sources, Market Sizing, and Validation
Desk Research
We started with desk research to map the demand pool and set the basic boundaries of where filling machines are actually purchased, replaced, or upgraded. Public sources were used to align the model to real manufacturing activity, including UN Comtrade trade statistics for packaging machinery flows, industrial production series from the World Bank and OECD, and sector output indicators from the US Census Bureau and Eurostat.
To avoid building the model only from macro indicators, we also reviewed company annual reports, investor presentations, and plant expansion announcements to understand capacity additions and replacement cycles in food, beverage, pharma, and personal care. Patent databases were checked to spot technology direction, for example aseptic and high accuracy dosing, and an import-export shipment level database was used selectively to sanity check equipment movement in key hubs. The desk research sources listed above are illustrative only, and we used additional public documents and references to collect data, validate assumptions, and clarify questions during analysis.
Primary Interviews and Surveys
Primary work was then used to pressure test what desk research cannot fully show, especially average selling price ranges, mix shifts across automation levels, and how often lines are upgraded versus replaced. We spoke with machine manufacturers, system integrators, contract packers, and end-user engineering and procurement contacts across the main consuming regions, so we could validate utilization, order lead times, and near-term capex intent.
Distribution of primary research fieldwork respondents
| Company type | Respondent position | Region |
|---|---|---|
| Top tier: 30% | CXOs: 16% | APAC: 49% |
| Mid tier: 51% | Functional/Unit leaders: 34% | EMEA: 32% |
| Smaller Players: 19% | Managers: 50% | Americas: 19% |
Market-Sizing & Forecasting
Sizing was built using a top-down and bottom-up approach, where packaging line additions and replacement demand were reconstructed from manufacturing output signals and packaging intensity across end-use industries, then converted into equipment spend using typical price bands. Once that demand pool was formed, selective bottom-up checks were applied, such as sampled average selling price multiplied by estimated unit demand by application, and channel checks on order books, to adjust totals where the first pass looked too high or too low.
Key inputs we tracked include packaged food and beverage output growth, pharmaceutical production and sterile capacity expansion, automation adoption in packaging lines, typical changeover needs driven by SKU growth, and regional investment cycles in new plants. Forecasts were run using scenario analysis supported by a lighter regression overlay that links equipment spend to industrial output and capex indicators, and then refined using what interviewees shared on budgeting, lead times, and delivery schedules. Where bottom-up visibility was thin in smaller countries, we used regional proxies based on manufacturing mix and import intensity, and then rechecked using trade signals and interview feedback.
Data Validation & Update Cycle
We validate results by triangulating outputs across independent signals, including trade flows of packaging machinery, end-use production series, and the implied equipment spend per unit of packaged output. Outliers are flagged early, then the assumptions behind ASP, volumes, and mix are revisited, followed by an internal review so the numbers are consistent across regions and end users.
If large variances remain after these checks, experts are re-contacted to confirm whether the issue reflects a real market shift, for example a capex freeze or a wave of upgrades, or a modeling error. Reports are refreshed annually, and interim updates are made when major events materially change demand. Before delivery, a final analyst pass is completed so clients receive the latest updated view based on the most recent available information.
Mordor Intelligence's Global Filling Machines Market Size Versus Other Published Estimates
Published market sizes for filling machines can look far apart because different studies do not always count the same equipment boundary, time period, or pricing logic. In our work, we aim to keep the model traceable to observable demand drivers, and we validate those drivers through interviews so the total is explainable.
Trade movement of packaging machinery, end-use production trends, and replacement cycle feedback from plant engineers anchor Mordor Intelligence's estimate to a realistic buying cycle, rather than blending in adjacent packaging equipment or assuming aggressive automation jumps. Differences also come from whether a figure includes filling and sealing systems together, uses a broader packaging machinery bucket, applies a single global ASP without regional mix, or converts currency using different timing that can move totals in years with FX volatility.
Benchmark comparison
| Source | Market Size | Gaps in Research Methodology |
|---|---|---|
| Mordor Intelligence | USD 8.3 B (2026) | |
| Trade Journal A | USD 8.7 B (2025) | Often groups filling machines with sealing and capping modules in a single line value, which lifts the total when the scope is not separated by equipment boundary. |
| Industry Association B | USD 4.84 B (2025) | Tends to focus on a narrower machinery definition and may rely more on reported trade and member sales coverage, which can undercount domestic production and non-member suppliers in several regions. |
The comparison shows that the spread is mainly explained by scope and counting rules, not just growth expectations. When the demand pool is built from clear production signals and then checked using practical buying behavior and price ranges, the resulting market value stays easier to follow and repeat from year to year.


Key Questions Answered in the Report
What is the current value of the filling machines market?
It stands at USD 8.3 billion in 2026 and is set to reach USD 10.29 billion by 2031.
Which region leads the filling machines market?
Asia-Pacific holds 39.20% share in 2025 and also registers the fastest 8.42% CAGR to 2031.
Which equipment segment is growing the quickest?
Aseptic filling systems post the highest 7.12% CAGR as biologics and preservative-free foods gain ground.
Why are fully automated filling lines gaining popularity?
Labor shortages and the need for consistent regulatory compliance drive a 5.42% CAGR for fully automatic machines.
How do sustainability goals influence container choice?
Aluminum cans grow at 8.05% CAGR because their recyclability aligns with corporate carbon targets.
What technological trend offers the biggest ROI for manufacturers?
AI-enabled predictive maintenance cuts unplanned downtime by up to 40%, boosting overall equipment effectiveness.
Page last updated on:


 Your data is secure and never sold or shared.


