
Fiber Optic Pressure Sensors Market Size and Share
Market Overview
| Study Period | 2020 - 2031 |
|---|---|
| Market Size (2026) | USD 4.15 Billion |
| Market Size (2031) | USD 6.48 Billion |
| Growth Rate (2026 - 2031) | 9.29 % |
| Fastest Growing Market | Asia Pacific |
| Largest Market | North America |
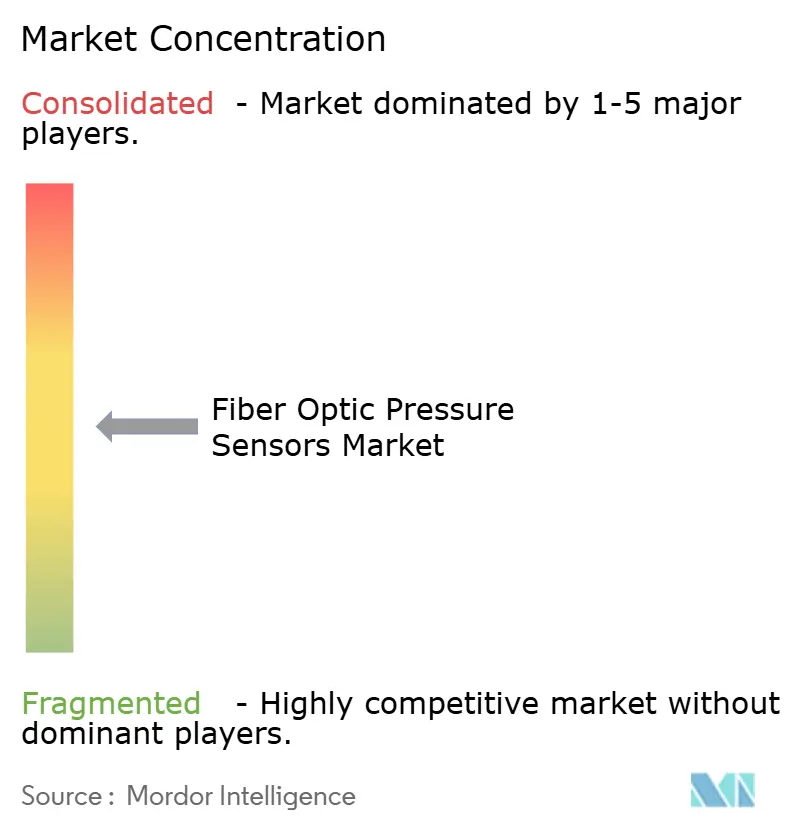
| Market Concentration | Medium |
Major Players *Disclaimer: Major Players sorted in no particular order Image © Mordor Intelligence. Reuse requires attribution under CC BY 4.0. | |
Fiber Optic Pressure Sensors Market Analysis by Mordor Intelligence
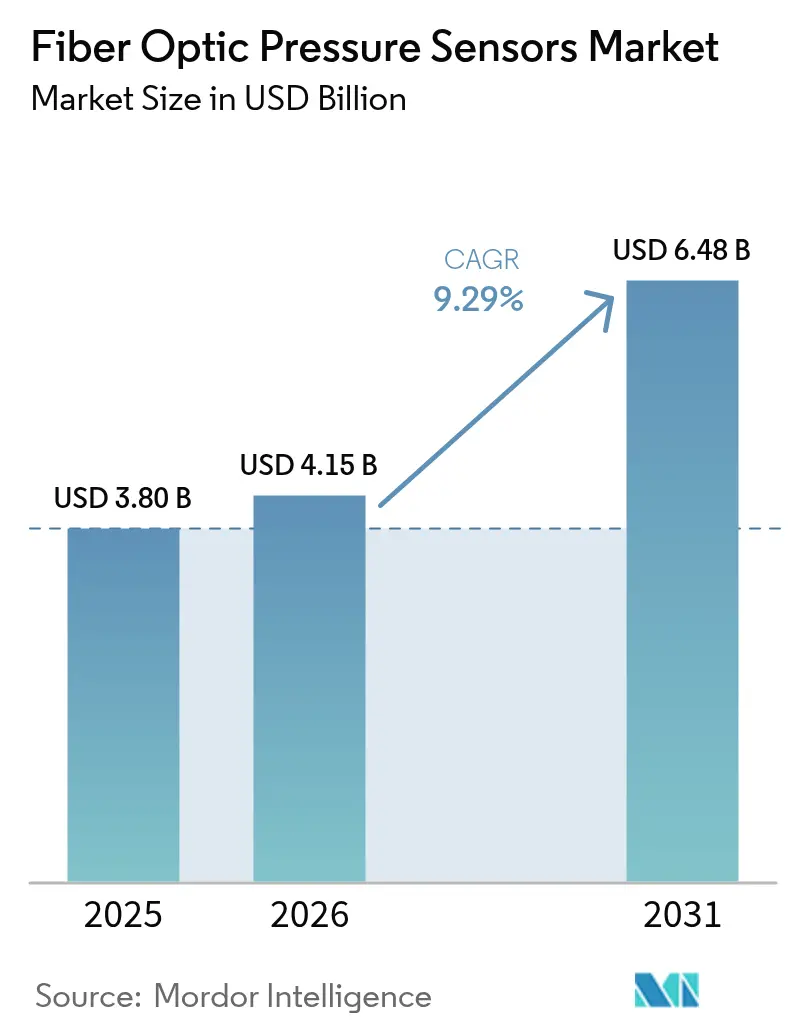
The fiber optic pressure sensors market size was valued at USD 3.8 billion in 2025 and estimated to grow from USD 4.15 billion in 2026 to reach USD 6.48 billion by 2031, at a CAGR of 9.29% during the forecast period (2026-2031). Robust demand stems from the technology’s suitability for real-time monitoring in harsh environments such as downhole oil wells and electric-vehicle battery packs. Ongoing miniaturization of Fabry–Perot micro-cavities and a 60% fall in interrogation-unit costs since 2020 have broadened adoption across industrial automation, healthcare, and mobility. Multiplexing gains have lifted Fiber Bragg Grating (FBG) uptake, while edge analytics integration in smart factories and implantable devices underscores new avenues of growth. Despite a 2–3 × cost premium over piezo-resistive sensors, rising total-cost-of-ownership advantages, workforce upskilling, and connector standardization initiatives continue to mitigate adoption barriers.
Key Report Takeaways
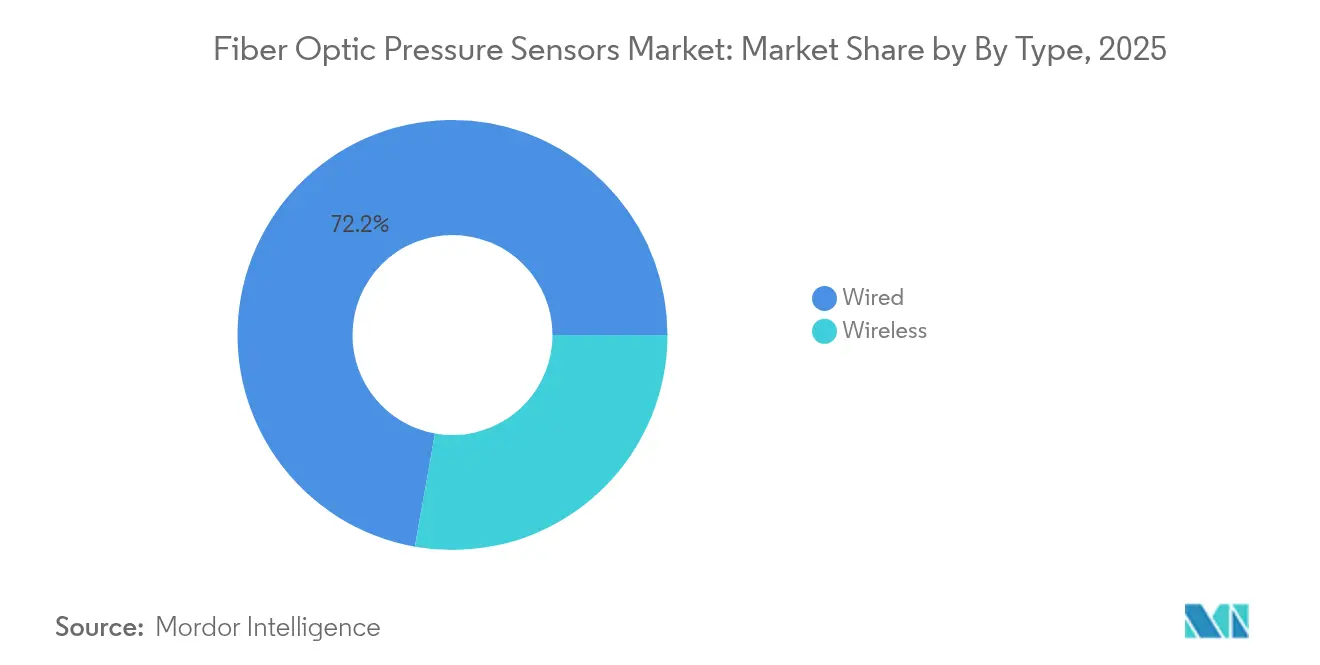
- By type, wired sensors held 72.20% of fiber optic pressure sensors market share in 2025, whereas wireless variants are projected to expand at a 11.6% CAGR through 2031.
- By technology, Fabry–Perot sensors led with 46.40% revenue share in 2025, while FBG technology is poised for the fastest 12.9% CAGR through 2031.
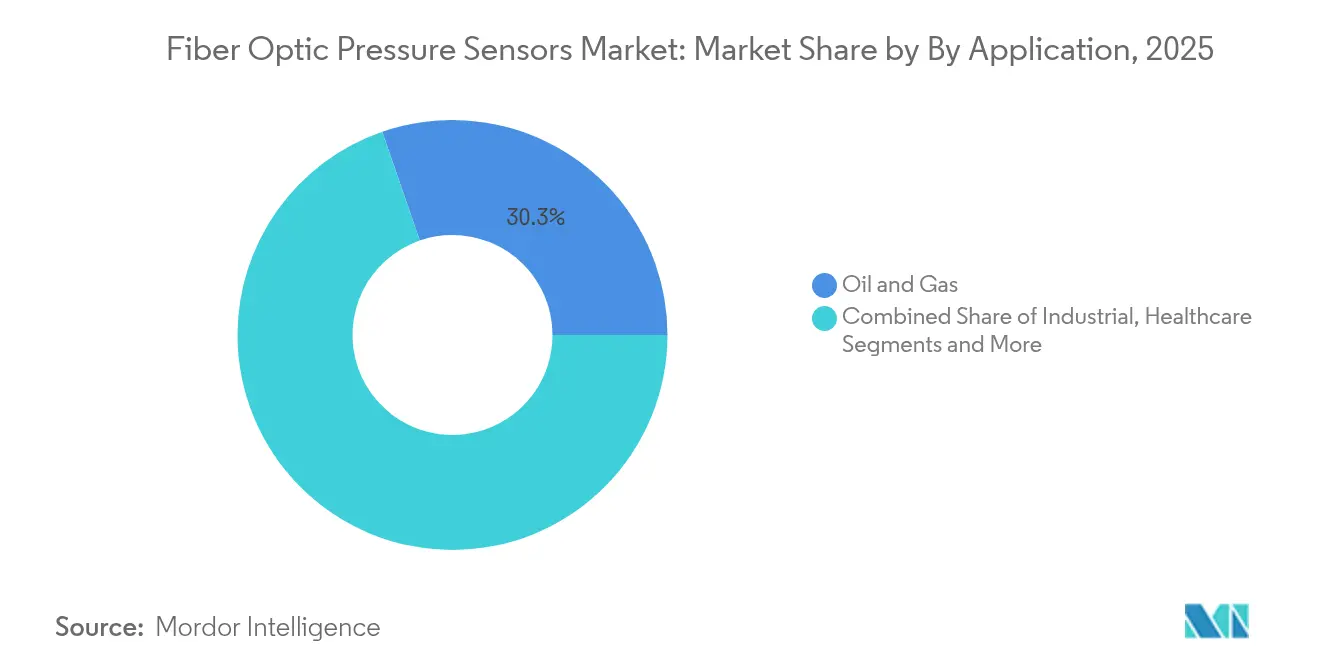
- By application, oil and gas accounted for 30.30% of the fiber optic pressure sensors market size in 2025; healthcare and medical devices are advancing at a 13.8% CAGR to 2031.
- By installation environment, down-hole and subsurface deployments captured 34.40% share of the fiber optic pressure sensors market size in 2025, whereas in-vivo biomedical use is set for a 14.2% CAGR through 2031.
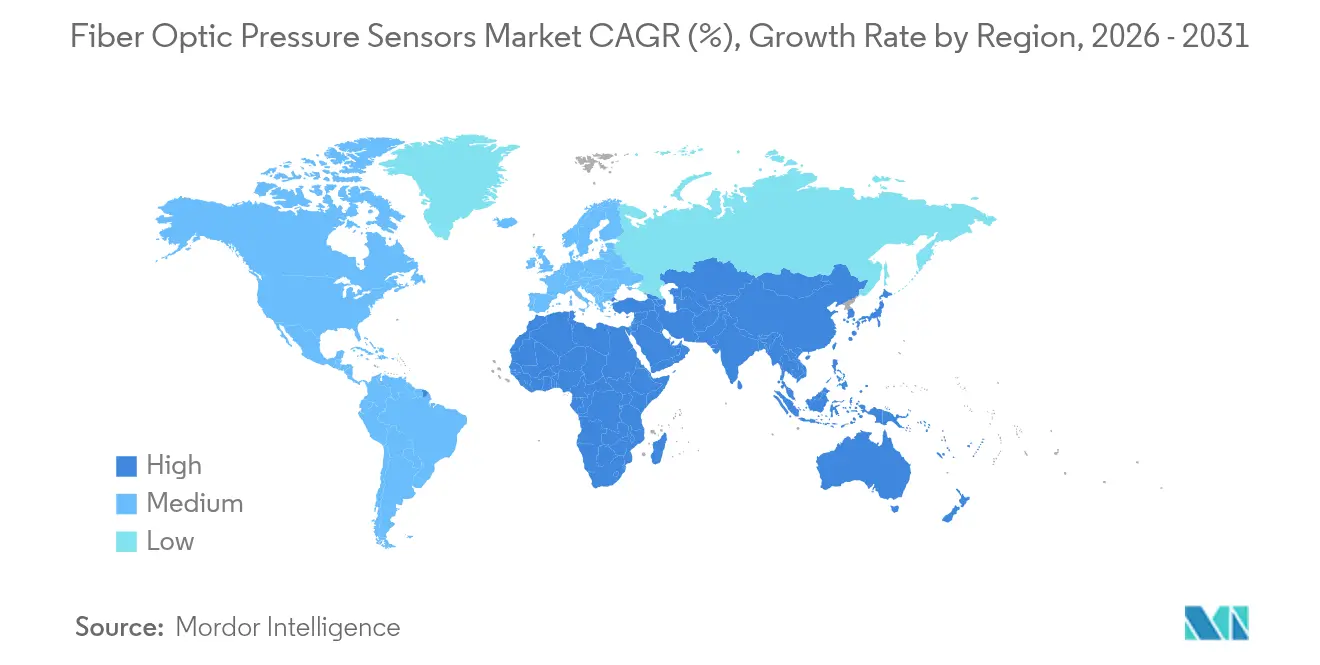
- By geography, North America dominated with 37.50% market share in 2025, yet Asia–Pacific is projected to grow the fastest at a 11.7% CAGR through 2031.
Note: Market size and forecast figures in this report are generated using Mordor Intelligence’s proprietary estimation framework, updated with the latest available data and insights as of 2026.
Market Trends and Insights
Drivers Impact Analysis of Fiber Optic Pressure Sensors Market*
| DRIVER | (~) % IMPACT ON CAGR FORECAST | GEOGRAPHIC RELEVANCE | IMPACT TIMELINE |
|---|---|---|---|
| Rapid miniaturisation of Fabry-Perot MEMS cavities | 2.1% | Global, with early adoption in North America & EU | Medium term (2-4 years) |
| Cost–down of distributed fiber-optic interrogation units | 1.8% | Global, accelerated in APAC manufacturing hubs | Short term (≤ 2 years) |
| OEM integration in EV battery-pack thermal-runaway safety | 1.5% | North America, EU, China EV manufacturing centers | Medium term (2-4 years) |
| Mandatory down-hole digitalisation targets (O&G) | 1.2% | Global O&G regions, concentrated in North America & Middle East | Long term (≥ 4 years) |
| Edge-analytics in smart factories (under-reported) | 0.9% | APAC industrial corridors, expanding to EU & North America | Medium term (2-4 years) |
| Implantable smart-catheter R&D funding spike (under-reported) | 0.7% | North America & EU medical device hubs | Long term (≥ 4 years) |
| Source: Mordor Intelligence | |||
Rapid Miniaturization of Fabry-Perot MEMS Cavities
Mass-production lithography now delivers cavity dimensions below 10 µm while preserving ±0.01% full-scale accuracy. This leap enables pressure detection as low as 2 kPa in space-constrained medical devices, outperforming conventional polymer sensors by 80% sensitivity. Smaller cavities shorten response times and lower unit cost through wafer-level integration that follows silicon-photonics process flows. Miniature sensors now support catheter-based cardiovascular monitoring, high-speed aerospace actuation feedback, and embedded battery-cell diagnostics without compromising structural integrity. As production volumes climb, the wired and wireless segments of the fiber optic pressure sensors market both benefit from higher performance at reduced price per channel.[1]
Cost-Down of Distributed Fiber-Optic Interrogation Units
The integration of silicon photonics has trimmed interrogation-unit pricing by roughly 60% since 2020, placing sub-nanometer wavelength resolution within reach of routine industrial budgets. Low-cost units now achieve 2.5 µε accuracy and sub-1 s response time, accelerating structural-health-monitoring adoption in bridges, tunnels, and pipelines. China leads global deployments with 11.3% share, validating cost competitiveness in large-scale smart-factory rollouts. Edge-analytics firmware further reduces data-backhaul needs, strengthening the value proposition in remote assets and boosting overall uptake of the fiber optic pressure sensors market.[2]
OEM Integration in EV Battery-Pack Thermal-Runaway Safety
Lab-on-fiber probes just 12 mm long and 125 µm in diameter track internal cell pressure and temperature during thermal runaway, offering advance warnings well before venting events. Their immunity to electromagnetic interference and corrosive electrolytes suits next-generation battery-management systems seeking improved safety compliance. Major automakers in North America, Europe, and China now trial embedded optical networks inside 18650 and pouch cells, pushing the fiber optic pressure sensors market deeper into the mobility ecosystem.
Mandatory Down-Hole Digitalization Targets in Oil & Gas
Baker Hughes’ SureCONNECT FE system links optical gauges to electric completions without intervention, reducing rig time while withstanding 200 °C and 15,000 psi conditions. Bragg-grating arrays measure pressure, temperature, and multiphase flow in real time, supporting production optimization mandates across tight reservoirs. As Middle-East producers pursue reservoir-management targets, adoption underpins long-term growth for the fiber optic pressure sensors market.[3]
Restraints Impact Analysis of Fiber Optic Pressure Sensors Market*
| RESTRAINTS | (~) % IMPACT ON CAGR FORECAST | GEOGRAPHIC RELEVANCE | IMPACT TIMELINE |
|---|---|---|---|
| High ASP vs piezo-resistive sensors | -1.4% | Global, particularly pronounced in price-sensitive APAC markets | Short term (≤ 2 years) |
| Connector standard-isation lag in subsea systems | -0.8% | Offshore regions, concentrated in North Sea & Gulf of Mexico | Medium term (2-4 years) |
| Scarcity of opto-qualified technicians (under-reported) | -0.6% | Global, acute in emerging markets and specialized applications | Long term (≥ 4 years) |
| IP fragmentation around micro-cavity designs (under-reported) | -0.4% | Global, affecting innovation-driven markets | Medium term (2-4 years) |
| Source: Mordor Intelligence | |||
High ASP Versus Piezo-Resistive Sensors
A 2–3 × unit-price premium persists, particularly in multi-sensor industrial automation projects where budget ceilings remain strict. Specialized interrogation hardware inflates capital cost compared to simple strain-gauge conditioners. Yet maintenance savings in corrosive or high-temperature sites offset initial spend over asset life cycles, encouraging gradual substitution. Silicon-photonics scale-up is expected to shrink the gap to near parity in high-volume lines by 2028, easing this restraint on the fiber optic pressure sensors market.
Connector Standardization Lag in Subsea Systems
Proprietary wet-mate connectors hinder interoperability and raise qualification expenses in deepwater fields. Each bespoke design demands exhaustive testing to assure leak-proof performance at depth, delaying deployments and discouraging multi-vendor integration. Industry consortia now draft common interface guidelines, while suppliers such as Baker Hughes promote modular wet-connect platforms that remove multiple penetrations and improve reliability. As standards mature, subsea adoption barriers will ease, lifting prospects for the fiber optic pressure sensors market.
*Our forecasts treat driver/restraint impacts as directional, not additive. The impact forecasts reflect baseline growth, mix effects, and variable interactions.
Fiber Optic Pressure Sensors Market Segment Analysis
By Type:
Wired Dominance Drives Infrastructure ReliabilityWired devices represented 72.20% of revenue in 2025, cementing their role in high-integrity assets such as downhole completions, pipeline corridors, and industrial furnaces. The fiber optic pressure sensors market size for wired units is projected to rise steadily alongside refinery upgrades and LNG terminal expansions. Physical connectivity guarantees signal integrity across kilometers of fiber in environments where wireless propagation is unreliable.
Wireless nodes, growing at a 11.6% CAGR, address installations where cabling adds weight, complexity, or safety risk. Implantable medical devices, battery cells, and rotating machinery capitalize on battery-free passive tags interrogated asynchronously. Continuous cost declines in ultra-low-power optical interrogators widen the addressable base beyond early adopters, lifting overall demand within the broader fiber optic pressure sensors market.[3].

By Technology:
Fabry–Perot Leadership Faces FBG ChallengeFabry–Perot sensors held 46.40% revenue share thanks to sub-milli-bar resolution and robustness at 200 °C. Their micro-cavity designs, now below 10 µm, allow integration in hypodermic needles and narrow geological perforations, reinforcing leadership within the fiber optic pressure sensors market share.
FBG arrays, however, will expand the fastest at 12.9% CAGR. A single fiber multiplexes hundreds of gratings, trimming per-point cost for structural-health-monitoring and long-haul pipeline projects. High-speed demodulators achieve ±1 pm stability, enhancing earthquake-resilient building surveillance and high-rise wind-load analysis. As interrogation costs fall, FBG uptake moderates Fabry–Perot dominance while enlarging total addressable revenue for the fiber optic pressure sensors market.
By Application:
Oil & Gas Dominance Challenged by Healthcare GrowthOil and gas operations controlled 30.30% of 2025 revenue, driven by mandatory downhole sensing in unconventional wells and mature offshore fields. Systems logging pressure and temperature at 10,000 ft depth underpin dynamic reservoir models, anchoring the fiber optic pressure sensors market size to energy-sector budgets.
Healthcare grows at 13.8% CAGR, pulling optical sensors into minimally invasive surgeries, smart catheters, and continuous cardiac monitoring. Biocompatible coatings and EMI immunity allow safe in-body deployment where electronics would pose rejection risks. Advanced cardiac mapping catheters rely on 80% higher sensitivity than polymer sensors, underscoring new frontiers for the fiber optic pressure sensors market.
By Installation Environment:
Down-Hole Applications Lead Specialized DeploymentsDown-hole installations delivered 34.40% of 2025 revenue due to stringent reliability requirements in wells hotter than 200 °C and pressures beyond 15,000 psi. The wired architecture remains preferred for its immunity to electromagnetic disturbances from drilling operations. Real-time analytics optimize artificial-lift settings and fracture-stimulation schedules, sustaining the core of the fiber optic pressure sensors market.
In-vivo biomedical settings record the fastest 14.2% CAGR. Ultra-thin probes inform surgeons of localized pressure changes during endovascular repairs, enhancing procedural outcomes. Similarly, aerospace and UAV sectors embed optical gauges to measure cabin pressure and fuel-line transients under high vibration, exploiting low mass and EMI immunity advantages. These diverse environments collectively extend the reach of the fiber optic pressure sensors market.
Geography Analysis
North America Fiber Optic Pressure Sensors Market
North America led with 37.50% revenue in 2025, supported by rigorous safety codes across shale plays and expanding EV battery plants. Federal incentives for advanced manufacturing and the presence of oilfield service majors foster rapid prototyping and early commercial launches. Aerospace programs also adopt optical gauges for flight-critical systems, reinforcing the region’s innovation edge within the fiber optic pressure sensors market.
APAC Fiber Optic Pressure Sensors Market
Asia–Pacific posts the strongest 11.7% CAGR to 2031. China’s 11.3% share of global distributed sensing deployments evidences government-driven smart-factory rollouts. Japan’s precision automotive giants integrate optical sensors in battery cooling loops, while India’s refinery expansions demand high-temperature gauging. Regional cost advantages in silicon photonics accelerate interrogation-unit output, broadening domestic availability and stimulating overall growth in the fiber optic pressure sensors market.
Europe Fiber Optic Pressure Sensors Market
Europe records stable uptake anchored in automotive manufacturing, petrochemical processing, and offshore wind. Germany’s 9.4% share of global optical deployments reflects long-standing leadership in industrial automation. United Kingdom subsea operators embrace wet-mate optical connectors for a new wave of North Sea life-extension projects. France’s aerospace sector increasingly favors optical arrays for real-time structural diagnostics, adding to steady momentum across the fiber optic pressure sensors market.
Regulatory Landscape
The regulatory and standards environment for fiber optic pressure sensors is increasingly shaped by formal metrology frameworks and national security oversight of fiber infrastructure. The International Electrotechnical Commission (IEC) published IEC 61757-8-1:2025 for Fiber Bragg Grating (FBG) based pressure sensors, followed by the broader IEC 61757:2026 (Edition 2.0) generic specification, which standardizes key parameters and test methods across fiber optic sensors. In Europe, the standard has been adopted as SIST EN IEC 61757-8-1:2026, supporting harmonized qualification and procurement language for pressure-measurement deployments.
Policy actions affecting fiber networks are also becoming more relevant as sensing increasingly rides on telecom-grade fiber. In June 2026, the US Federal Communications Commission (FCC) adopted a new submarine cable licensing regime that increases oversight and adds national security related certification and routine conditions for submarine cable equipment such as Submarine Line Terminal Equipment (SLTE). In parallel, US legislative scrutiny of supply chains intensified with the introduction of H.R. 9541 in June 2026, proposing restrictions on the use of federal funds by entities purchasing fiber-optic cable from countries of concern, which is a compliance consideration for infrastructure-led sensing rollouts even though the bill is not enacted.
Value Chain Analysis
The value chain covers specialty optical fiber and coating materials, sensing-element fabrication (Fabry-Perot microcavities and fiber gratings), packaging and connectorization for harsh environments, interrogation hardware (light sources, photonics, and demodulation electronics), and application-layer integration (software, edge analytics, and asset-management workflows). Differentiation increasingly sits at the system level, where sensor makers and integrators package multi-point sensing with interrogation plus analytics for use cases such as downhole monitoring, industrial plant deployments, and medical devices.
Upstream constraints concentrate on supply for specialized fiber, coatings, and high-precision opto-mechanical components, while midstream manufacturing depends on clean-room assembly, calibration, and optical testing. In medical-grade production, automated and robotized assembly has become a practical scaling path, highlighted by Resonetics advancing robotic manufacturing for its fiber optic pressure sensor product lines used in minimally invasive diagnostics (noted in 2025). Downstream, adoption timing is largely shaped by solution-led channels, with OEM partnerships and qualification cycles (including medical device compliance requirements) favoring suppliers that can deliver validated packaging, connectors, and long-term support.
Competitive Landscape
The market remains moderately fragmented, with no player exceeding a one-third share. Broad-portfolio service giants such as Baker Hughes, Halliburton, and Schlumberger bundle downhole optical gauges with integrated reservoir management, leveraging global fleets and high-pressure qualification laboratories. Specialized firms Luna Innovations and Opsens capitalize on high-precision medical and aerospace niches where sub-millibar resolution is essential.
Recent shifts indicate sharpening focus. Luna Innovations divested non-core assets to center on optical technology and expanded capacity in Atlanta to fulfill rising EV battery orders. Baker Hughes unveiled SureCONNECT FE, blending fiber arrays with intelligent completions to cut intervention costs. Nokia’s acquisition of Infinera extended silicon-photonics depth, promising lower interrogation costs for industrial-grade deployments.
Standard-interface momentum could reshape vendor dynamics. Providers offering interoperable wet-connect solutions and modular interrogation firmware may capture platform leadership as customers seek vendor-agnostic ecosystems. Conversely, IP fragmentation around micro-cavity designs could segment the fiber optic pressure sensors market into application-specific silos, sustaining price premiums in specialized medical and aerospace domains.
Fiber Optic Pressure Sensors Industry Leaders
-
Schlumberger Limited (SLB)
-
AP Sensing GmbH
-
Opsens Inc.
-
Luna Innovations Incorporated (incl. FISO Technologies)
-
Halliburton Company
- *Disclaimer: Major Players sorted in no particular order
Fiber Optic Pressure Sensors Market Companies Covered in this Report
- AP Sensing GmbH
- Baker Hughes Company
- Halliburton Company
- Honeywell International Inc.
- Infineon Technologies AG
- Luna Innovations Incorporated (incl. FISO Technologies)
- NXP Semiconductors N.V.
- Omron Corporation
- Opsens Inc.
- Panasonic Holdings Corporation
- Pressure Profile Systems Inc.
- Robert Bosch GmbH
- Schlumberger Limited (SLB)
- STMicroelectronics N.V.
- Texas Instruments Incorporated
- Yokogawa Electric Corporation
- ABB Ltd.
- Broadcom Inc.
- Rockwell Automation Inc.
- Sumitomo Electric Industries Ltd.
Market Opportunities and Future Outlook
Standardization and telecom-adjacent sensing are creating whitespace beyond traditional oil and gas and industrial automation deployments. The publication of IEC 61757:2026 adds a more uniform test and parameter framework for fiber optic sensors, which supports faster cross-vendor qualification discussions for buyers seeking auditable performance claims across harsh-environment pressure measurement. At the same time, tightening oversight of submarine cable infrastructure (for example, the FCC's June 2026 submarine cable licensing regime affecting SLTE) reinforces interest in monitoring and protection of critical fiber routes, aligning with distributed sensing platforms that combine sensing, interrogation, and analytics.
A concrete opportunity area is infrastructure-based monitoring where existing telecom fiber is used as a sensing medium, reducing the need for dedicated sensor installation in some scenarios. In July 2026, FiberCop and Nokia tested fiber sensing to detect hazards and threats such as landslides, roadworks, and vandalism, while Huawei documented 2026 deployments of distributed fiber sensing solutions for buried optical cable inspection using NCE-managed platforms for continuous event identification. These deployments also point to services demand around calibration and signal processing: 2026 academic work reported non-linear pressure sensitivity in commercial armored telecommunication cables up to 800 psi, indicating that linear calibration coefficients can be insufficient. This creates room for specialized characterization, calibration protocols, and analytics tuning as telecom operators and infrastructure owners operationalize fiber-based sensing.
Recent Industry Developments in Fiber Optic Pressure Sensors Market
- June 2026: SLB published a case study for its StethoScope Ultra formation pressure-while-drilling service, documenting reliable measurements under overbalance pressures of 11,000 psi in offshore Asia. The update reinforces HPHT-capable formation pressure measurement as an active commercialization area and supports continued demand for ruggedized optical pressure sensing and interrogation in complex wells.
- May 2026: AP Sensing announced delivery of distributed fiber optic sensing solutions (including DTS and DAS) for offshore wind projects at Fecamp, Saint-Brieuc, and Gruissan to monitor power cable infrastructure. This expands the addressable market for fiber-based monitoring in renewable-energy grids, where cable integrity and fault localization drive system-level sensing adoption.
- March 2025: SLB launched electric well control (EWC) technologies that incorporate IIoT sensors to provide real-time pressure readouts in place of conventional hydraulic systems. The shift toward electrified, sensor-rich well control supports deeper integration of pressure measurement into digital drilling and completion workflows, favoring vendors with high-reliability sensing and data integration capabilities.
Fiber Optic Pressure Sensors Market Report Scope and Research Methodology
Market Definition and Coverage
This market covers revenue earned from fiber optic pressure sensors used to measure pressure in industrial, energy, medical, aerospace, and other operating settings where electrical interference, safety, or distance makes optical sensing more suitable.
Scope exclusions: It excludes conventional electronic pressure sensors and related monitoring software or services that are sold separately from the sensor hardware.
Segments Covered in This Report
- By Type
- Wired
- Wireless
- By Technology
- Fabry-Perot
- Fiber Bragg Grating
- Intensity-Based
- Other Technologies
- By Application
- Oil and Gas
- Industrial Automation
- Healthcare and Medical Devices
- Automotive and Mobility
- Consumer Electronics
- Petrochemical
- Other Applications
- By Installation Environment
- Down-hole / Sub-surface
- Industrial Surface Plants
- In-vivo / Biomedical
- Aerospace and UAV
- Marine and Subsea Structures
- By Geography
- North America
- United States
- Canada
- Europe
- United Kingdom
- Germany
- France
- Russia
- Rest of Europe
- Asia-Pacific
- China
- India
- Japan
- Rest of Asia-Pacific
- South America
- Brazil
- Argentina
- Rest of South America
- Middle East and Africa
- GCC Countries
- Turkey
- South Africa
- Rest of Middle East and Africa
- North America
Data Sources, Market Sizing, and Validation
Desk Research
Desk research was used to build the initial view of demand pools and adoption patterns, then to anchor assumptions that are hard to obtain from company disclosures alone. We relied on public sources such as U.S. Energy Information Administration data for oil and gas activity, USGS and similar geological sources for drilling context, and healthcare procedure and device utilization signals from organizations such as the CDC and the World Health Organization.
For technology and product direction, we reviewed peer-reviewed optics and sensor publications, along with patent databases, to see which sensing methods were being pushed and where reliability claims were being tested. Import and export shipment level databases were selectively used to cross-check trade flows of relevant sensor components and assemblies, and we also reviewed annual reports, investor presentations, standards body notes, and reputable press coverage to confirm major deployment programs and pricing direction. These examples are not exhaustive, and many other sources were also used for data collection, validation, and clarification during the study.
Primary Interviews and Surveys
Primary interviews and surveys helped convert the desk view into a practical market model by checking what gets bought, how it is specified, and how pricing shifts with sensing technology and installation conditions. We spoke with a mix of sensor suppliers, system integrators, and end users across energy, industrial automation, and medical use cases, then validated regional demand patterns across APAC, EMEA, and the Americas.
Distribution of primary research fieldwork respondents
| Company type | Respondent position | Region |
|---|---|---|
| Top tier: 33% | CXOs: 14% | APAC: 50% |
| Mid tier: 51% | Functional/Unit leaders: 42% | EMEA: 32% |
| Smaller Players: 16% | Managers: 44% | Americas: 18% |
Market-Sizing & Forecasting
The sizing started from a top-down build where pressure monitoring demand was reconstructed using end-use activity signals, then translated into fiber optic adoption using penetration and suitability checks by application. In practice, we connected indicators such as drilling and completion activity, industrial automation investment cycles, the share of harsh environment monitoring points, and medical device use cases where electromagnetic immunity is required.
Once a top-line number was formed, it was corroborated with selective bottom-up approximations, including sampled average selling prices by sensing technology, channel checks on typical order sizes, and supplier-side sanity checks on where volume is actually concentrated. Where data gaps existed, they were handled with conservative assumptions that were reviewed with interviewees, then adjusted only when multiple independent inputs pointed in the same direction.
Forecasts were built using scenario analysis, since adoption is influenced by a few variables that can change faster than long-term averages. Inputs that were stress-tested included oil and gas capex direction, automation project pipelines, qualification timelines in safety critical settings, component cost trends that affect sensor pricing, and regional buildouts that change installation volumes.
Data Validation & Update Cycle
Validation was done through multi-step checks, where model outputs were compared against independent signals like end market activity levels, technology adoption commentary, and observed price ranges for comparable sensor configurations. If a segment total looked unusually high or low, the assumptions behind penetration, pricing, or application mapping were revisited and then rechecked through follow-up expert conversations.
Before sign-off, the analysis goes through internal review so calculation logic, units, and conversions are consistent across regions and years. Reports are refreshed annually, and interim updates are made when material events shift demand or pricing, followed by a final pre-delivery review so clients receive the latest updated view.
Mordor Intelligence's Global Fiber Optic Pressure Sensors Market Market Estimate Compared With Other Published Estimates
Published market sizes for fiber optic pressure sensors can differ because boundary lines are not always drawn the same way, and because some models lean heavily on broader sensor markets and then apply simple percentages. Differences also come from the year used for sizing, how currency conversions are timed, and whether pricing is treated as stable or allowed to move with component costs and technology mix.
By tracking installation-environment demand signals and refreshing ASP assumptions by sensing technology, Mordor Intelligence keeps the total tied to where fiber optic sensors are actually specified, rather than counting adjacent optical sensing revenue that does not measure pressure. Some estimates also appear to use a narrower end-use set or a more aggressive adoption curve without rechecking with integrators and end users, which can pull totals down or push them up depending on the chosen starting point.
Benchmark comparison
| Source | Market Size | Gaps in Research Methodology |
|---|---|---|
| Mordor Intelligence | USD 4.15 B (2026) | |
| Industry Research Firm A | USD 0.70 B (2024) | Uses an earlier base year and a smaller stated market total, which often happens when only a limited set of end uses or a narrower definition of pressure sensing deployments is counted. |
| Industry Publisher B | USD 2.31 B (2024) | Anchors the market at 2024 and appears to apply broader segment buckets and longer horizon growth assumptions, which can shift totals depending on what is treated as pressure-only sensor revenue versus related optical sensing items. |
The spread in values mainly comes from year choice and the scope boundary around what qualifies as a pressure sensor sale in fiber optic form. Using a model that ties demand to observable deployment drivers and checks pricing and adoption assumptions with industry participants helps keep the result traceable and repeatable.
Key Questions Answered in the Report
What is the current size of the fiber optic pressure sensors market?
The market stood at USD 4.15 billion in 2026 and is projected to reach USD 6.48 billion by 2031.
Which technology segment will grow the fastest?
Fiber Bragg Grating sensors are expected to record a 12.9% CAGR, outpacing other technologies thanks to multiplexing advantages.
Why are wireless optical pressure sensors gaining traction?
Wireless variants enable non-invasive monitoring in implantable medical devices and EV battery cells, supporting a 11.6% CAGR through 2031.
Which application dominates revenue today?
Oil and gas downhole monitoring leads with 30.30% revenue share because of mandatory digitalization targets.
Which region offers the highest growth potential?
Asia–Pacific is forecast to expand at a 11.7% CAGR through 2031, propelled by Chinese smart-factory and Japanese mobility initiatives.
What is the main hurdle to broader adoption?
A 2–3 × cost premium over piezo-resistive sensors remains the primary restraint, though the gap is narrowing as silicon-photonics scaling progresses.