| Study Period | 2017 - 2030 |
| Base Year For Estimation | 2024 |
| Forecast Data Period | 2025 - 2030 |
| Market Size (2025) | USD 520.9 Million |
| Market Size (2030) | USD 639.4 Million |
| CAGR (2025 - 2030) | 4.19 % |
| Market Concentration | Medium |
Major Players*Disclaimer: Major Players sorted in no particular order |

Feed Phytogenics Market Analysis
The Feed Phytogenics Market size is estimated at 520.9 million USD in 2025, and is expected to reach 639.4 million USD by 2030, growing at a CAGR of 4.19% during the forecast period (2025-2030).
The global feed industry is experiencing a significant transformation driven by increasing consumer awareness regarding food safety and sustainability in animal farming practices. This shift has led to a growing preference for natural feed additives, with phytogenics emerging as a crucial alternative to traditional feed supplements. In 2022, phytogenics represented approximately 1.4% of the total feed additives market, highlighting their growing acceptance among farmers and feed manufacturers. The industry is witnessing a notable transition towards plant-based solutions, particularly as regulations around antibiotic usage in animal feed become more stringent across major markets. This transformation is further accelerated by increasing consumer demand for antibiotic-free meat and dairy products, pushing producers to adopt natural alternatives.
Technological advancements in extraction and processing methods have significantly enhanced the efficacy of phytogenic feed additives. Essential oils, valued at USD 0.3 billion in 2022, have emerged as a cornerstone of the phytogenics market due to their cost-effectiveness and proven benefits in enhancing digestive secretions and stimulating blood circulation in livestock. The industry has seen substantial investments in research and development, focusing on improving the bioavailability and stability of plant-based compounds. Manufacturing companies are increasingly adopting sophisticated extraction techniques to maintain the integrity of active compounds while ensuring consistent product quality.
The livestock industry's rapid modernization has created a robust demand for advanced feed solutions that can improve animal health and productivity naturally. Feed production has shown remarkable growth, with North America alone witnessing an increase from 215.5 million metric tons in 2017 to 281.2 million metric tons in 2022, reflecting the expanding scale of commercial farming operations. This growth is accompanied by increasing emphasis on feed efficiency and animal welfare, driving the adoption of innovative phytogenic feed additives. The industry is also seeing a rise in strategic partnerships between feed manufacturers and research institutions to develop more effective phytogenics in animal nutrition.
Environmental sustainability has become a central focus in the feed industry, with producers increasingly recognizing the role of phytogenics in reducing environmental impact. The livestock sector, which managed approximately 17.25 billion animals in the Asia-Pacific region alone in 2021, is actively seeking solutions to minimize its environmental footprint while maintaining productivity. Phytogenic feed additives are gaining prominence for their ability to improve feed conversion rates and reduce waste production. This trend aligns with global sustainability initiatives and is driving innovation in eco-friendly feed solutions, particularly in regions with high livestock populations and growing environmental concerns.
Global Feed Phytogenics Market Trends
High demand for animal protein and poultry products such as eggs with increasing investment in poultry sector is increasing poultry population
- The poultry population has witnessed a significant increase over recent years, primarily due to the growing demand for chicken meat and eggs in daily diets globally. The shift toward poultry products has been driven by the increasing prices of other meat, such as pig meat, in the United States. The consumption of eggs in Europe increased by 4.6% between 2017 and 2021, amounting to 6,135 metric tons in 2021.
- Asia-Pacific is the largest producer of poultry birds, with production registering a 6.6% increase in 2022 compared to 2017. The rise in poultry production is due to the growing demand for animal protein following the outbreak of African Swine Fever, which reduced the pork meat supply. China, which accounts for 40% of global production, has more than 900 million stock-laying hens, and the largest layer poultry farming center can hatch 60 million chicks per year. The Middle East is also expected to witness growth in poultry production during the forecast period (2023-2029). Companies such as Almarai in Saudi Arabia have invested heavily in the industry, with USD 1.12 billion spent on establishing new farms to expand production.
- The increasing demand for poultry products and rising investments in the poultry industry are expected to strengthen feed production. This, in turn, is expected to drive the demand for feed additives in the global market during the forecast period. The global poultry industry is poised for significant growth over the coming years, driven by the increasing shift toward poultry products and increasing investments in the industry.

Understand The Key Trends Shaping This Market
Download PDF
The growing demand for seafood consumption in Asia-Pacific and South America, and government initiatives is increasing the feed production for aquaculture species
- The demand for feed is rapidly increasing due to the expansion of aquaculture, which is driving the growth of compound feed production. In 2022, compound feed production increased by 13.1% over the previous year, and fish feed production increased by 46.3% between 2017 and 2022. The rise in consumption of fish feed is driven by the need to maintain and improve the performance of aquatic animals and increase productivity to meet the growing demand for seafood.
- Fish feed accounted for 73.2% of the global feed market in 2022, as fish is highly consumed and produced in the Asia-Pacific region. Fish was followed by shrimp and other aquatic species in the global market, with shrimp being highly imported by European countries and the United States from other regions. Countries are focusing on expanding aquaculture production to meet the growing demand for seafood. For instance, India increased its budget allocation to the Department of Fisheries from USD 114.1 million in 2020 to USD 168.8 million in 2021 to increase production, which is expected to boost the demand for feed during the forecast period.
- South America is also recording increased feed production, which rose by 46.4% in 2022 from 2017 to reach 5.1 million metric ton, in line with the expansion of aquaculture farming. The region is one of the major seafood-consuming regions, and the increasing demand for seafood is driving the growth of aquaculture production. As aquaculture continues to expand to meet the growing demand, the development of the industry and a focus on its expansion are expected to fuel feed production. This increase in feed production for aquatic species is expected to aid in the growth of the aquaculture segment during the forecast period.

OTHER KEY INDUSTRY TRENDS COVERED IN THE REPORT
- Increased consumption of beef meat, growing food and beverage sector, and increasing number of farms are driving the global ruminants production
- Poultry feed production is increasing owing to high demand for poultry meat and increasing investments in emerging countries such as India and Saudi Arabia
- Asia-Pacific is largest producer of swine feed with high per capita consumption of pork meat and African Swine Fever (ASF) impacted the swine industries in Europe and Africa
- Swine population is increasing due to high pork consumption with Asia-Pacific and Europe being the significant producers of pork
- High demand for ruminants feed in Asia-Pacific and North America with the United States exported 80% of beef production and emergence of new milk providers in India
Segment Analysis: Sub Additive
Essential Oil Segment in Feed Phytogenics Market
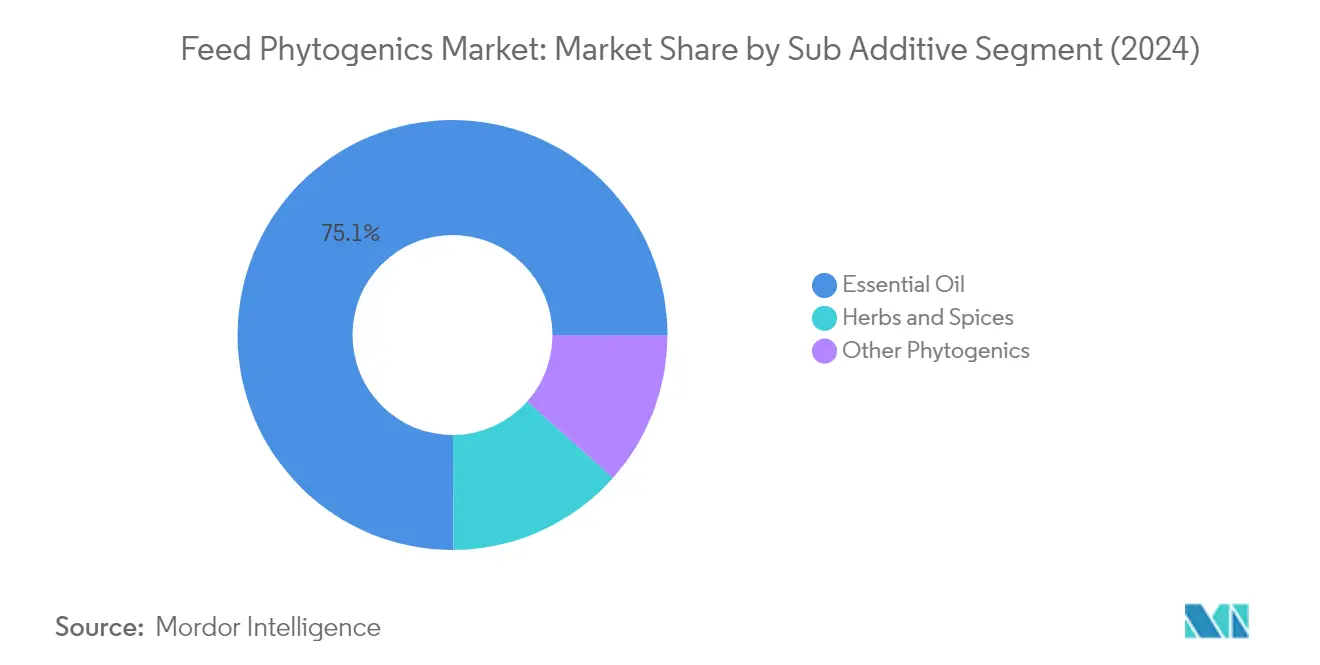
Essential oils have emerged as the dominant segment in the global feed phytogenics market, commanding approximately 75% of the market share in 2024. The segment's prominence can be attributed to its cost-effectiveness and superior benefits in animal nutrition. Essential oils enhance the production of digestive secretions, stimulate blood circulation, and reduce levels of pathogenic bacteria in livestock. The poultry industry has been the largest consumer of essential oils, particularly due to their effectiveness in improving gut health and boosting immunity in poultry birds. These oils have also shown remarkable results in decreasing diarrhea in post-weaned pigs and improving overall gut health in swine. The Asia-Pacific region has been particularly receptive to essential oils, with major companies collaborating to introduce improved phytogenic feed additives in key markets like China.
Herbs & Spices Segment in Feed Phytogenics Market
The herbs and spices segment is projected to experience the highest growth rate in the phytogenics market, with an expected CAGR of approximately 4% during 2024-2029. This growth trajectory is primarily driven by their increasing adoption as alternatives to antibiotic growth promoters (AGPs) in animal diets. Herbs and spices provide significant antimicrobial properties against various pathogens, particularly in poultry birds, such as Salmonella. These natural additives have demonstrated positive effects on production performance and antioxidant functions across various livestock species. The segment's growth is further supported by the rising awareness of their health benefits, including improved protein efficiency and enhanced gastrointestinal morphology. The increasing demand for natural feed ingredients and the growing focus on sustainable animal nutrition practices are expected to continue driving the segment's expansion.
Remaining Segments in Sub Additive Market
The other phytogenics segment, comprising various natural substances derived from plants such as grains, fruits, roots, and agri-industrial byproducts, plays a crucial role in the feed phytogenics market. These alternatives offer unique benefits such as high palatability and improved feed conversion ratios, making them valuable additions to animal feed formulations. The segment has shown particular strength in the Asia-Pacific region, where there is a growing emphasis on natural feed additives. These other phytogenics are especially popular in the poultry sector, where they serve as effective phytobiotics and antibiotic replacements. Their ability to improve resistance and gut function, particularly in broilers and layers, has made them an increasingly important component of modern animal nutrition strategies.
Segment Analysis: Animal
Poultry Segment in Feed Phytogenics Market
The poultry segment dominates the global feed phytogenics market, commanding approximately 46% market share in 2024. This significant market position is primarily driven by the extensive use of phytogenic feed additives in improving poultry productivity and health outcomes. Essential oils are particularly popular in this segment, accounting for about 75% of poultry feed phytogenics consumption, as they enhance digestive secretions and boost immune responses in birds. The segment's prominence is further strengthened by the increasing commercial poultry farming activities across the Asia-Pacific and North America regions, where producers are actively seeking natural alternatives to traditional feed additives. Broilers represent the largest sub-segment within poultry, followed by layers and other poultry birds, reflecting the high demand for meat production globally.
Aquaculture Segment in Feed Phytogenics Market
The aquaculture segment is emerging as the fastest-growing segment in the feed phytogenics market, projected to expand at approximately 5% CAGR from 2024 to 2029. This robust growth is driven by increasing awareness about the benefits of phytogenic feed additives in improving feed efficiency and nutrient uptake in aquatic species. The segment's growth is particularly strong in the Asia-Pacific region, where major aquaculture-producing countries are increasingly adopting these natural feed additives. Essential oils and other phytogenic compounds are gaining popularity in fish and shrimp farming due to their ability to enhance growth performance and disease resistance while contributing to sustainable aquaculture practices. The rising global demand for seafood and the growing emphasis on environmentally sustainable aquaculture practices are further accelerating the adoption of feed phytogenics in this segment.
Remaining Segments in Animal Feed Phytogenics Market
The remaining segments in the feed phytogenics market include swine, ruminants, and other animals, each playing distinct roles in shaping market dynamics. The phytogenic feed additives for swine market is particularly significant in regions with high pork consumption, where phytogenics are used to improve gut health and feed conversion efficiency. The ruminants segment, encompassing both dairy and beef cattle, focuses on utilizing phytogenics to enhance milk production and meat quality while reducing methane emissions. The other animals segment, though smaller, serves specialized markets including horses and rabbits, where phytogenics are valued for their natural health-promoting properties. These segments collectively demonstrate the versatility and broad applicability of phytogenic feed additives across different livestock species.
Feed Phytogenics Market Geography Segment Analysis
Feed Phytogenics Market in Africa
The African feed phytogenics market demonstrates significant potential for growth, driven by increasing awareness of healthy animal diets and the rising demand for quality feed additives. The region's market is primarily concentrated in South Africa, Egypt, and Kenya, with each country showing distinct market dynamics influenced by their respective livestock industries. The adoption of phytogenics in Africa is gaining momentum as farmers increasingly recognize the benefits of these natural alternatives in improving animal health and productivity.
Feed Phytogenics Market in South Africa
South Africa emerges as the dominant force in the African feed phytogenics market, holding approximately 60% of the regional market share in 2024. The country's leadership position is supported by its advanced agricultural infrastructure and well-established commercial farming sector. South Africa's market is characterized by a strong presence in both poultry and ruminant segments, with poultry being the primary consumer of phytogenic feed additives. The country's robust distribution networks and increasing awareness among farmers about the benefits of natural feed additives have contributed to its market dominance.
Feed Phytogenics Market in Kenya
Kenya represents the most dynamic market in the African region, with a projected growth rate of approximately 3% during 2024-2029. The country's market expansion is driven by the rapid development of its poultry and dairy farming sectors. Kenya's agricultural sector is increasingly adopting modern farming practices, with a particular focus on natural feed additives to enhance animal productivity. The country's growing emphasis on commercial farming practices and increasing investments in livestock development are creating favorable conditions for market growth.
Feed Phytogenics Market in Asia-Pacific
The Asia-Pacific region represents a crucial market for feed phytogenics, characterized by diverse agricultural practices and rapidly evolving livestock sectors. The region encompasses major markets including China, Japan, India, Australia, Indonesia, the Philippines, Thailand, Vietnam, and South Korea. The market dynamics are shaped by increasing awareness of animal health, growing demand for quality meat products, and rising adoption of modern farming practices across these countries.
Feed Phytogenics Market in China
China stands as the powerhouse of the Asia-Pacific feed phytogenics market, commanding approximately 45% of the regional market share in 2024. The country's dominant position is supported by its massive livestock population and extensive feed production capabilities. China's market is particularly strong in the poultry and swine segments, with increasing adoption of phytogenics as alternatives to traditional growth promoters. The country's focus on food security and sustainable farming practices continues to drive market growth.
Feed Phytogenics Market in Japan
Japan emerges as the most dynamic market in the Asia-Pacific region, with an expected growth rate of approximately 5% during 2024-2029. The country's market is characterized by high-quality standards and sophisticated farming practices. Japan's focus on technological advancement in animal nutrition and increasing preference for natural feed additives has positioned it as a key growth market. The country's strict regulations on antibiotic usage in animal feed have further accelerated the adoption of phytogenic feed additives.
Feed Phytogenics Market in Europe
The Europe feed phytogenics market demonstrates a mature and well-regulated landscape, with a strong presence across multiple countries including Germany, France, Italy, Spain, the Netherlands, Russia, Turkey, and the United Kingdom. The region's market is characterized by stringent regulations on animal feed additives and growing consumer awareness about food safety. The European market benefits from advanced research and development capabilities and a strong emphasis on sustainable farming practices.
Feed Phytogenics Market in Germany
Germany maintains its position as the leading market for feed phytogenics in Europe, representing approximately 15% of the regional market share in 2024. The country's market leadership is underpinned by its advanced agricultural sector and strong focus on animal welfare. Germany's market is characterized by high adoption rates across various livestock segments, particularly in poultry and swine farming. The country's robust research infrastructure and innovative approach to animal nutrition continue to drive market development.
Feed Phytogenics Market in United Kingdom
The United Kingdom demonstrates the highest growth potential in the European region, with a projected growth rate of approximately 4.5% during 2024-2029. The UK market is driven by an increasing focus on natural feed additives and growing awareness about antibiotic resistance in livestock. The country's emphasis on sustainable farming practices and animal welfare has created favorable conditions for the adoption of phytogenic feed additives. The UK's strong research capabilities and innovative approach to animal nutrition continue to support market expansion.
Feed Phytogenics Market in Middle East
The Middle Eastern feed phytogenics market, primarily represented by Iran and Saudi Arabia, shows steady development in response to growing demand for quality animal products. Saudi Arabia emerges as the largest market in the region, while Iran demonstrates the fastest growth potential. The region's market is characterized by increasing investments in livestock development and growing awareness about the benefits of natural feed additives. The Middle Eastern market benefits from modernizing agricultural practices and rising demand for meat and dairy products.
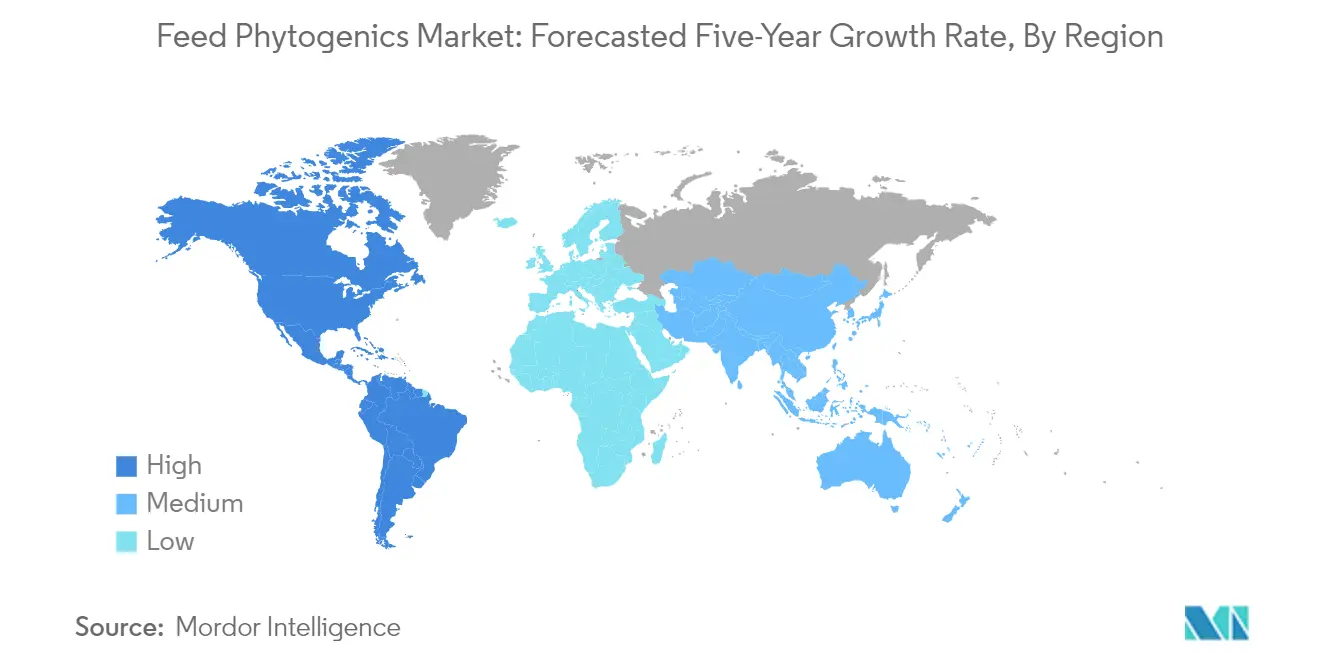
Feed Phytogenics Market in North America
The North American feed phytogenics market, encompassing the United States, Canada, and Mexico, represents a sophisticated and technologically advanced market landscape. The United States emerges as both the largest and fastest-growing market in the region, leading in both market size and innovation. The region's market is characterized by strong research and development capabilities, advanced farming practices, and an increasing focus on natural alternatives to traditional feed additives. The North American market benefits from well-established distribution networks and growing consumer awareness about food safety and animal welfare.
Feed Phytogenics Market in South America
The South American feed phytogenics market, comprising Brazil, Argentina, and Chile, demonstrates strong growth potential driven by expanding livestock sectors and increasing adoption of modern farming practices. Brazil establishes itself as the largest market in the region, while Chile shows the fastest growth trajectory. The region's market is characterized by its strong agricultural base, growing awareness about animal nutrition, and increasing investments in livestock development. The South American market continues to evolve with improving infrastructure and rising demand for quality animal products.
Get Analysis on Important Geographic Markets
Download PDF
Feed Phytogenics Industry Overview
Top Companies in Feed Phytogenics Market
The feed phytogenics market is characterized by companies actively pursuing innovation and expansion strategies to strengthen their market positions. Major players are focusing on developing novel phytogenics products through extensive research and development initiatives, particularly targeting alternatives to antibiotics in animal feed. Companies are demonstrating operational agility by establishing new manufacturing facilities and research centers across strategic locations to better serve regional markets. Strategic partnerships and collaborations have become increasingly common, allowing companies to combine technological expertise and expand their product portfolios. Geographic expansion, particularly in emerging markets across Asia-Pacific and Latin America, remains a key focus area as companies aim to capitalize on growing demand. Additionally, investments in sustainable and environmentally friendly production processes have become a significant trend among market leaders.
Consolidated Market Led By Global Players
The feed phytogenics market exhibits a consolidated structure dominated by large multinational corporations with diverse product portfolios. These major players leverage their extensive research capabilities, established distribution networks, and strong brand recognition to maintain their market positions. The market is characterized by the presence of both specialized feed additive manufacturers and large agricultural conglomerates that have integrated feed phytogenics into their broader product offerings. Local players, while present in various regions, typically operate at a smaller scale and often focus on specific geographic markets or animal segments.
The industry has witnessed significant merger and acquisition activity as companies seek to expand their technological capabilities and geographic reach. Large companies are actively acquiring smaller, specialized firms to gain access to innovative technologies and established regional markets. This consolidation trend has led to the emergence of stronger market players with enhanced capabilities in product development and distribution. Vertical integration strategies are also becoming more prevalent as companies aim to control various aspects of the value chain, from raw material sourcing to end-product distribution.
Innovation and Distribution Drive Market Success
For established players to maintain and increase their market share, continuous investment in research and development remains crucial. Companies need to focus on developing innovative phytogenic solutions that address specific challenges in animal nutrition while meeting evolving regulatory requirements. Building strong relationships with key stakeholders, including feed manufacturers and livestock producers, is essential for market success. Additionally, establishing efficient distribution networks and providing technical support services to customers can help companies differentiate themselves in the market. Incumbent players must also focus on sustainability initiatives and transparent supply chain practices to meet growing consumer demands for environmentally responsible products.
New entrants and smaller players can gain ground by focusing on niche market segments and developing specialized products for specific animal types or regional markets. Success in this market requires building strong technical expertise and demonstrating product efficacy through scientific research and field trials. Companies must also navigate complex regulatory environments and invest in obtaining necessary certifications and approvals. Developing strategic partnerships with established players or regional distributors can help newer companies overcome market entry barriers and expand their presence. Additionally, focusing on digital technologies and innovative delivery systems can provide opportunities for differentiation in an increasingly competitive market. The Phytogenics Group, a notable player, exemplifies this approach by leveraging its expertise in PFA (Phytogenic Feed Additives) to drive innovation and market penetration.
Feed Phytogenics Market Leaders
-
Adisseo
-
Cargill Inc.
-
DSM Nutritional Products AG
-
IFF(Danisco Animal Nutrition)
-
Land O'Lakes
- *Disclaimer: Major Players sorted in no particular order

Need More Details on Market Players and Competiters?
Download PDF
Feed Phytogenics Market News
- December 2022: Adisseo group had agreed to acquire Nor-Feed and its subsidiaries to develop and register botanical additives for use in animal feed.
- September 2022: DSM has acquired Prodap, a leading Brazilian animal nutrition and technology company. With this strategy, the company combines technology offerings, consulting services, and specialized nutritional solutions to improve animal farming efficiency and sustainability.
- July 2022: Cargill has extended its partnership with Innovafeed to provide aquafarmers with innovative and nutritious ingredients, including additives.
Free With This Report
We provide a complimentary and exhaustive set of data points on regional and country-level metrics that present the fundamental structure of the industry. Presented in the form of 35+ free charts, the section covers difficult-to-find data of various regions on feed production through various animal categories such as Ruminants, Poultry, Swine, and Aquaculture.


Feed Phytogenics Market Report - Table of Contents
1. EXECUTIVE SUMMARY & KEY FINDINGS
2. REPORT OFFERS
3. INTRODUCTION
- 3.1 Study Assumptions & Market Definition
- 3.2 Scope of the Study
- 3.3 Research Methodology
4. KEY INDUSTRY TRENDS
-
4.1 Animal Headcount
- 4.1.1 Poultry
- 4.1.2 Ruminants
- 4.1.3 Swine
-
4.2 Feed Production
- 4.2.1 Aquaculture
- 4.2.2 Poultry
- 4.2.3 Ruminants
- 4.2.4 Swine
-
4.3 Regulatory Framework
- 4.3.1 Australia
- 4.3.2 Brazil
- 4.3.3 Canada
- 4.3.4 China
- 4.3.5 France
- 4.3.6 Germany
- 4.3.7 India
- 4.3.8 Italy
- 4.3.9 Japan
- 4.3.10 Mexico
- 4.3.11 Netherlands
- 4.3.12 Philippines
- 4.3.13 Russia
- 4.3.14 South Africa
- 4.3.15 Spain
- 4.3.16 Thailand
- 4.3.17 Turkey
- 4.3.18 United Kingdom
- 4.3.19 United States
- 4.3.20 Vietnam
- 4.4 Value Chain & Distribution Channel Analysis
5. MARKET SEGMENTATION (includes market size in Value in USD and Volume, Forecasts up to 2030 and analysis of growth prospects)
-
5.1 Sub Additive
- 5.1.1 Essential Oil
- 5.1.2 Herbs & Spices
- 5.1.3 Other Phytogenics
-
5.2 Animal
- 5.2.1 Aquaculture
- 5.2.1.1 By Sub Animal
- 5.2.1.1.1 Fish
- 5.2.1.1.2 Shrimp
- 5.2.1.1.3 Other Aquaculture Species
- 5.2.2 Poultry
- 5.2.2.1 By Sub Animal
- 5.2.2.1.1 Broiler
- 5.2.2.1.2 Layer
- 5.2.2.1.3 Other Poultry Birds
- 5.2.3 Ruminants
- 5.2.3.1 By Sub Animal
- 5.2.3.1.1 Beef Cattle
- 5.2.3.1.2 Dairy Cattle
- 5.2.3.1.3 Other Ruminants
- 5.2.4 Swine
- 5.2.5 Other Animals
-
5.3 Region
- 5.3.1 Africa
- 5.3.1.1 By Country
- 5.3.1.1.1 Egypt
- 5.3.1.1.2 Kenya
- 5.3.1.1.3 South Africa
- 5.3.1.1.4 Rest of Africa
- 5.3.2 Asia-Pacific
- 5.3.2.1 By Country
- 5.3.2.1.1 Australia
- 5.3.2.1.2 China
- 5.3.2.1.3 India
- 5.3.2.1.4 Indonesia
- 5.3.2.1.5 Japan
- 5.3.2.1.6 Philippines
- 5.3.2.1.7 South Korea
- 5.3.2.1.8 Thailand
- 5.3.2.1.9 Vietnam
- 5.3.2.1.10 Rest of Asia-Pacific
- 5.3.3 Europe
- 5.3.3.1 By Country
- 5.3.3.1.1 France
- 5.3.3.1.2 Germany
- 5.3.3.1.3 Italy
- 5.3.3.1.4 Netherlands
- 5.3.3.1.5 Russia
- 5.3.3.1.6 Spain
- 5.3.3.1.7 Turkey
- 5.3.3.1.8 United Kingdom
- 5.3.3.1.9 Rest of Europe
- 5.3.4 Middle East
- 5.3.4.1 By Country
- 5.3.4.1.1 Iran
- 5.3.4.1.2 Saudi Arabia
- 5.3.4.1.3 Rest of Middle East
- 5.3.5 North America
- 5.3.5.1 By Country
- 5.3.5.1.1 Canada
- 5.3.5.1.2 Mexico
- 5.3.5.1.3 United States
- 5.3.5.1.4 Rest of North America
- 5.3.6 South America
- 5.3.6.1 By Country
- 5.3.6.1.1 Argentina
- 5.3.6.1.2 Brazil
- 5.3.6.1.3 Chile
- 5.3.6.1.4 Rest of South America
6. COMPETITIVE LANDSCAPE
- 6.1 Key Strategic Moves
- 6.2 Market Share Analysis
- 6.3 Company Landscape
-
6.4 Company Profiles (includes Global Level Overview, Market Level Overview, Core Business Segments, Financials, Headcount, Key Information, Market Rank, Market Share, Products and Services, and Analysis of Recent Developments).
- 6.4.1 Adisseo
- 6.4.2 Alltech, Inc.
- 6.4.3 Borregaard AS
- 6.4.4 Cargill Inc.
- 6.4.5 DSM Nutritional Products AG
- 6.4.6 IFF(Danisco Animal Nutrition)
- 6.4.7 Kemin Industries
- 6.4.8 Land O'Lakes
- 6.4.9 Marubeni Corporation (Orffa International Holding B.V.)
- 6.4.10 Prinova Group LLC
7. KEY STRATEGIC QUESTIONS FOR FEED ADDITIVE CEOS
8. APPENDIX
-
8.1 Global Overview
- 8.1.1 Overview
- 8.1.2 Porter’s Five Forces Framework
- 8.1.3 Global Value Chain Analysis
- 8.1.4 Global Market Size and DROs
- 8.2 Sources & References
- 8.3 List of Tables & Figures
- 8.4 Primary Insights
- 8.5 Data Pack
- 8.6 Glossary of Terms
You Can Purchase Parts Of This Report. Check Out Prices For Specific Sections
Get Price Break-up Now
List of Tables & Figures
- Figure 1:
- POPULATION OF POULTRY, NUMBER, GLOBAL, 2017-2022
- Figure 2:
- POPULATION OF RUMINANTS, NUMBER, GLOBAL, 2017-2022
- Figure 3:
- POPULATION OF SWINE, NUMBER, GLOBAL, 2017-2022
- Figure 4:
- PRODUCTION VOLUME OF AQUACULTURE FEED, METRIC TON, GLOBAL, 2017-2022
- Figure 5:
- PRODUCTION VOLUME OF POULTRY FEED, METRIC TON, GLOBAL, 2017-2022
- Figure 6:
- PRODUCTION VOLUME OF RUMINANTS FEED, METRIC TON, GLOBAL, 2017-2022
- Figure 7:
- PRODUCTION VOLUME OF SWINE FEED, METRIC TON, GLOBAL, 2017-2022
- Figure 8:
- VOLUME OF FEED PHYTOGENICS, METRIC TON, GLOBAL, 2017 - 2029
- Figure 9:
- VALUE OF FEED PHYTOGENICS, USD, GLOBAL, 2017 - 2029
- Figure 10:
- VOLUME OF FEED PHYTOGENICS BY SUB ADDITIVE CATEGORIES, METRIC TON, GLOBAL, 2017 - 2029
- Figure 11:
- VALUE OF FEED PHYTOGENICS BY SUB ADDITIVE CATEGORIES, USD, GLOBAL, 2017 - 2029
- Figure 12:
- VOLUME SHARE OF FEED PHYTOGENICS BY SUB ADDITIVE CATEGORIES, %, GLOBAL, 2017,2023 AND 2029
- Figure 13:
- VALUE SHARE OF FEED PHYTOGENICS BY SUB ADDITIVE CATEGORIES, %, GLOBAL, 2017,2023 AND 2029
- Figure 14:
- VOLUME OF ESSENTIAL OIL FEED PHYTOGENICS, METRIC TON, GLOBAL, 2017 - 2029
- Figure 15:
- VALUE OF ESSENTIAL OIL FEED PHYTOGENICS, USD, GLOBAL, 2017 - 2029
- Figure 16:
- VALUE SHARE OF ESSENTIAL OIL FEED PHYTOGENICS BY ANIMAL TYPE, %, GLOBAL, 2022 AND 2029
- Figure 17:
- VOLUME OF HERBS & SPICES FEED PHYTOGENICS, METRIC TON, GLOBAL, 2017 - 2029
- Figure 18:
- VALUE OF HERBS & SPICES FEED PHYTOGENICS, USD, GLOBAL, 2017 - 2029
- Figure 19:
- VALUE SHARE OF HERBS & SPICES FEED PHYTOGENICS BY ANIMAL TYPE, %, GLOBAL, 2022 AND 2029
- Figure 20:
- VOLUME OF OTHER PHYTOGENICS FEED PHYTOGENICS, METRIC TON, GLOBAL, 2017 - 2029
- Figure 21:
- VALUE OF OTHER PHYTOGENICS FEED PHYTOGENICS, USD, GLOBAL, 2017 - 2029
- Figure 22:
- VALUE SHARE OF OTHER PHYTOGENICS FEED PHYTOGENICS BY ANIMAL TYPE, %, GLOBAL, 2022 AND 2029
- Figure 23:
- VOLUME OF FEED PHYTOGENICS BY ANIMAL TYPE, METRIC TON, GLOBAL, 2017 - 2029
- Figure 24:
- VALUE OF FEED PHYTOGENICS BY ANIMAL TYPE, USD, GLOBAL, 2017 - 2029
- Figure 25:
- VOLUME SHARE OF FEED PHYTOGENICS BY ANIMAL TYPE, %, GLOBAL, 2017,2023 AND 2029
- Figure 26:
- VALUE SHARE OF FEED PHYTOGENICS BY ANIMAL TYPE, %, GLOBAL, 2017,2023 AND 2029
- Figure 27:
- VOLUME OF AQUACULTURE FEED PHYTOGENICS BY SUB ANIMAL TYPE, METRIC TON, GLOBAL, 2017 - 2029
- Figure 28:
- VALUE OF AQUACULTURE FEED PHYTOGENICS BY SUB ANIMAL TYPE, USD, GLOBAL, 2017 - 2029
- Figure 29:
- VOLUME SHARE OF AQUACULTURE FEED PHYTOGENICS BY SUB ANIMAL TYPE, %, GLOBAL, 2017,2023 AND 2029
- Figure 30:
- VALUE SHARE OF AQUACULTURE FEED PHYTOGENICS BY SUB ANIMAL TYPE, %, GLOBAL, 2017,2023 AND 2029
- Figure 31:
- VOLUME OF FISH FEED PHYTOGENICS, METRIC TON, GLOBAL, 2017 - 2029
- Figure 32:
- VALUE OF FISH FEED PHYTOGENICS, USD, GLOBAL, 2017 - 2029
- Figure 33:
- VALUE SHARE OF FISH FEED PHYTOGENICS BY SUB ADDITIVE CATEGORIES, %, GLOBAL, 2022 AND 2029
- Figure 34:
- VOLUME OF SHRIMP FEED PHYTOGENICS, METRIC TON, GLOBAL, 2017 - 2029
- Figure 35:
- VALUE OF SHRIMP FEED PHYTOGENICS, USD, GLOBAL, 2017 - 2029
- Figure 36:
- VALUE SHARE OF SHRIMP FEED PHYTOGENICS BY SUB ADDITIVE CATEGORIES, %, GLOBAL, 2022 AND 2029
- Figure 37:
- VOLUME OF OTHER AQUACULTURE SPECIES FEED PHYTOGENICS, METRIC TON, GLOBAL, 2017 - 2029
- Figure 38:
- VALUE OF OTHER AQUACULTURE SPECIES FEED PHYTOGENICS, USD, GLOBAL, 2017 - 2029
- Figure 39:
- VALUE SHARE OF OTHER AQUACULTURE SPECIES FEED PHYTOGENICS BY SUB ADDITIVE CATEGORIES, %, GLOBAL, 2022 AND 2029
- Figure 40:
- VOLUME OF POULTRY FEED PHYTOGENICS BY SUB ANIMAL TYPE, METRIC TON, GLOBAL, 2017 - 2029
- Figure 41:
- VALUE OF POULTRY FEED PHYTOGENICS BY SUB ANIMAL TYPE, USD, GLOBAL, 2017 - 2029
- Figure 42:
- VOLUME SHARE OF POULTRY FEED PHYTOGENICS BY SUB ANIMAL TYPE, %, GLOBAL, 2017,2023 AND 2029
- Figure 43:
- VALUE SHARE OF POULTRY FEED PHYTOGENICS BY SUB ANIMAL TYPE, %, GLOBAL, 2017,2023 AND 2029
- Figure 44:
- VOLUME OF BROILER FEED PHYTOGENICS, METRIC TON, GLOBAL, 2017 - 2029
- Figure 45:
- VALUE OF BROILER FEED PHYTOGENICS, USD, GLOBAL, 2017 - 2029
- Figure 46:
- VALUE SHARE OF BROILER FEED PHYTOGENICS BY SUB ADDITIVE CATEGORIES, %, GLOBAL, 2022 AND 2029
- Figure 47:
- VOLUME OF LAYER FEED PHYTOGENICS, METRIC TON, GLOBAL, 2017 - 2029
- Figure 48:
- VALUE OF LAYER FEED PHYTOGENICS, USD, GLOBAL, 2017 - 2029
- Figure 49:
- VALUE SHARE OF LAYER FEED PHYTOGENICS BY SUB ADDITIVE CATEGORIES, %, GLOBAL, 2022 AND 2029
- Figure 50:
- VOLUME OF OTHER POULTRY BIRDS FEED PHYTOGENICS, METRIC TON, GLOBAL, 2017 - 2029
- Figure 51:
- VALUE OF OTHER POULTRY BIRDS FEED PHYTOGENICS, USD, GLOBAL, 2017 - 2029
- Figure 52:
- VALUE SHARE OF OTHER POULTRY BIRDS FEED PHYTOGENICS BY SUB ADDITIVE CATEGORIES, %, GLOBAL, 2022 AND 2029
- Figure 53:
- VOLUME OF RUMINANTS FEED PHYTOGENICS BY SUB ANIMAL TYPE, METRIC TON, GLOBAL, 2017 - 2029
- Figure 54:
- VALUE OF RUMINANTS FEED PHYTOGENICS BY SUB ANIMAL TYPE, USD, GLOBAL, 2017 - 2029
- Figure 55:
- VOLUME SHARE OF RUMINANTS FEED PHYTOGENICS BY SUB ANIMAL TYPE, %, GLOBAL, 2017,2023 AND 2029
- Figure 56:
- VALUE SHARE OF RUMINANTS FEED PHYTOGENICS BY SUB ANIMAL TYPE, %, GLOBAL, 2017,2023 AND 2029
- Figure 57:
- VOLUME OF BEEF CATTLE FEED PHYTOGENICS, METRIC TON, GLOBAL, 2017 - 2029
- Figure 58:
- VALUE OF BEEF CATTLE FEED PHYTOGENICS, USD, GLOBAL, 2017 - 2029
- Figure 59:
- VALUE SHARE OF BEEF CATTLE FEED PHYTOGENICS BY SUB ADDITIVE CATEGORIES, %, GLOBAL, 2022 AND 2029
- Figure 60:
- VOLUME OF DAIRY CATTLE FEED PHYTOGENICS, METRIC TON, GLOBAL, 2017 - 2029
- Figure 61:
- VALUE OF DAIRY CATTLE FEED PHYTOGENICS, USD, GLOBAL, 2017 - 2029
- Figure 62:
- VALUE SHARE OF DAIRY CATTLE FEED PHYTOGENICS BY SUB ADDITIVE CATEGORIES, %, GLOBAL, 2022 AND 2029
- Figure 63:
- VOLUME OF OTHER RUMINANTS FEED PHYTOGENICS, METRIC TON, GLOBAL, 2017 - 2029
- Figure 64:
- VALUE OF OTHER RUMINANTS FEED PHYTOGENICS, USD, GLOBAL, 2017 - 2029
- Figure 65:
- VALUE SHARE OF OTHER RUMINANTS FEED PHYTOGENICS BY SUB ADDITIVE CATEGORIES, %, GLOBAL, 2022 AND 2029
- Figure 66:
- VOLUME OF SWINE FEED PHYTOGENICS, METRIC TON, GLOBAL, 2017 - 2029
- Figure 67:
- VALUE OF SWINE FEED PHYTOGENICS, USD, GLOBAL, 2017 - 2029
- Figure 68:
- VALUE SHARE OF SWINE FEED PHYTOGENICS BY SUB ADDITIVE CATEGORIES, %, GLOBAL, 2022 AND 2029
- Figure 69:
- VOLUME OF OTHER ANIMALS FEED PHYTOGENICS, METRIC TON, GLOBAL, 2017 - 2029
- Figure 70:
- VALUE OF OTHER ANIMALS FEED PHYTOGENICS, USD, GLOBAL, 2017 - 2029
- Figure 71:
- VALUE SHARE OF OTHER ANIMALS FEED PHYTOGENICS BY SUB ADDITIVE CATEGORIES, %, GLOBAL, 2022 AND 2029
- Figure 72:
- VOLUME OF FEED PHYTOGENICS BY REGION, METRIC TON, GLOBAL, 2017 - 2029
- Figure 73:
- VALUE OF FEED PHYTOGENICS BY REGION, USD, GLOBAL, 2017 - 2029
- Figure 74:
- VOLUME SHARE OF FEED PHYTOGENICS BY REGION, %, GLOBAL, 2017,2023 AND 2029
- Figure 75:
- VALUE SHARE OF FEED PHYTOGENICS BY REGION, %, GLOBAL, 2017,2023 AND 2029
- Figure 76:
- VOLUME OF FEED PHYTOGENICS BY COUNTRY, METRIC TON, AFRICA, 2017 - 2029
- Figure 77:
- VALUE OF FEED PHYTOGENICS BY COUNTRY, USD, AFRICA, 2017 - 2029
- Figure 78:
- VOLUME SHARE OF FEED PHYTOGENICS BY COUNTRY, %, AFRICA, 2017,2023 AND 2029
- Figure 79:
- VALUE SHARE OF FEED PHYTOGENICS BY COUNTRY, %, AFRICA, 2017,2023 AND 2029
- Figure 80:
- VOLUME OF EGYPT FEED PHYTOGENICS, METRIC TON, AFRICA, 2017 - 2029
- Figure 81:
- VALUE OF EGYPT FEED PHYTOGENICS, USD, AFRICA, 2017 - 2029
- Figure 82:
- VALUE SHARE OF EGYPT FEED PHYTOGENICS BY SUB ADDITIVE CATEGORIES, %, AFRICA, 2022 AND 2029
- Figure 83:
- VOLUME OF KENYA FEED PHYTOGENICS, METRIC TON, AFRICA, 2017 - 2029
- Figure 84:
- VALUE OF KENYA FEED PHYTOGENICS, USD, AFRICA, 2017 - 2029
- Figure 85:
- VALUE SHARE OF KENYA FEED PHYTOGENICS BY SUB ADDITIVE CATEGORIES, %, AFRICA, 2022 AND 2029
- Figure 86:
- VOLUME OF SOUTH AFRICA FEED PHYTOGENICS, METRIC TON, AFRICA, 2017 - 2029
- Figure 87:
- VALUE OF SOUTH AFRICA FEED PHYTOGENICS, USD, AFRICA, 2017 - 2029
- Figure 88:
- VALUE SHARE OF SOUTH AFRICA FEED PHYTOGENICS BY SUB ADDITIVE CATEGORIES, %, AFRICA, 2022 AND 2029
- Figure 89:
- VOLUME OF REST OF AFRICA FEED PHYTOGENICS, METRIC TON, AFRICA, 2017 - 2029
- Figure 90:
- VALUE OF REST OF AFRICA FEED PHYTOGENICS, USD, AFRICA, 2017 - 2029
- Figure 91:
- VALUE SHARE OF REST OF AFRICA FEED PHYTOGENICS BY SUB ADDITIVE CATEGORIES, %, AFRICA, 2022 AND 2029
- Figure 92:
- VOLUME OF FEED PHYTOGENICS BY COUNTRY, METRIC TON, ASIA-PACIFIC, 2017 - 2029
- Figure 93:
- VALUE OF FEED PHYTOGENICS BY COUNTRY, USD, ASIA-PACIFIC, 2017 - 2029
- Figure 94:
- VOLUME SHARE OF FEED PHYTOGENICS BY COUNTRY, %, ASIA-PACIFIC, 2017,2023 AND 2029
- Figure 95:
- VALUE SHARE OF FEED PHYTOGENICS BY COUNTRY, %, ASIA-PACIFIC, 2017,2023 AND 2029
- Figure 96:
- VOLUME OF AUSTRALIA FEED PHYTOGENICS, METRIC TON, ASIA-PACIFIC, 2017 - 2029
- Figure 97:
- VALUE OF AUSTRALIA FEED PHYTOGENICS, USD, ASIA-PACIFIC, 2017 - 2029
- Figure 98:
- VALUE SHARE OF AUSTRALIA FEED PHYTOGENICS BY SUB ADDITIVE CATEGORIES, %, ASIA-PACIFIC, 2022 AND 2029
- Figure 99:
- VOLUME OF CHINA FEED PHYTOGENICS, METRIC TON, ASIA-PACIFIC, 2017 - 2029
- Figure 100:
- VALUE OF CHINA FEED PHYTOGENICS, USD, ASIA-PACIFIC, 2017 - 2029
- Figure 101:
- VALUE SHARE OF CHINA FEED PHYTOGENICS BY SUB ADDITIVE CATEGORIES, %, ASIA-PACIFIC, 2022 AND 2029
- Figure 102:
- VOLUME OF INDIA FEED PHYTOGENICS, METRIC TON, ASIA-PACIFIC, 2017 - 2029
- Figure 103:
- VALUE OF INDIA FEED PHYTOGENICS, USD, ASIA-PACIFIC, 2017 - 2029
- Figure 104:
- VALUE SHARE OF INDIA FEED PHYTOGENICS BY SUB ADDITIVE CATEGORIES, %, ASIA-PACIFIC, 2022 AND 2029
- Figure 105:
- VOLUME OF INDONESIA FEED PHYTOGENICS, METRIC TON, ASIA-PACIFIC, 2017 - 2029
- Figure 106:
- VALUE OF INDONESIA FEED PHYTOGENICS, USD, ASIA-PACIFIC, 2017 - 2029
- Figure 107:
- VALUE SHARE OF INDONESIA FEED PHYTOGENICS BY SUB ADDITIVE CATEGORIES, %, ASIA-PACIFIC, 2022 AND 2029
- Figure 108:
- VOLUME OF JAPAN FEED PHYTOGENICS, METRIC TON, ASIA-PACIFIC, 2017 - 2029
- Figure 109:
- VALUE OF JAPAN FEED PHYTOGENICS, USD, ASIA-PACIFIC, 2017 - 2029
- Figure 110:
- VALUE SHARE OF JAPAN FEED PHYTOGENICS BY SUB ADDITIVE CATEGORIES, %, ASIA-PACIFIC, 2022 AND 2029
- Figure 111:
- VOLUME OF PHILIPPINES FEED PHYTOGENICS, METRIC TON, ASIA-PACIFIC, 2017 - 2029
- Figure 112:
- VALUE OF PHILIPPINES FEED PHYTOGENICS, USD, ASIA-PACIFIC, 2017 - 2029
- Figure 113:
- VALUE SHARE OF PHILIPPINES FEED PHYTOGENICS BY SUB ADDITIVE CATEGORIES, %, ASIA-PACIFIC, 2022 AND 2029
- Figure 114:
- VOLUME OF SOUTH KOREA FEED PHYTOGENICS, METRIC TON, ASIA-PACIFIC, 2017 - 2029
- Figure 115:
- VALUE OF SOUTH KOREA FEED PHYTOGENICS, USD, ASIA-PACIFIC, 2017 - 2029
- Figure 116:
- VALUE SHARE OF SOUTH KOREA FEED PHYTOGENICS BY SUB ADDITIVE CATEGORIES, %, ASIA-PACIFIC, 2022 AND 2029
- Figure 117:
- VOLUME OF THAILAND FEED PHYTOGENICS, METRIC TON, ASIA-PACIFIC, 2017 - 2029
- Figure 118:
- VALUE OF THAILAND FEED PHYTOGENICS, USD, ASIA-PACIFIC, 2017 - 2029
- Figure 119:
- VALUE SHARE OF THAILAND FEED PHYTOGENICS BY SUB ADDITIVE CATEGORIES, %, ASIA-PACIFIC, 2022 AND 2029
- Figure 120:
- VOLUME OF VIETNAM FEED PHYTOGENICS, METRIC TON, ASIA-PACIFIC, 2017 - 2029
- Figure 121:
- VALUE OF VIETNAM FEED PHYTOGENICS, USD, ASIA-PACIFIC, 2017 - 2029
- Figure 122:
- VALUE SHARE OF VIETNAM FEED PHYTOGENICS BY SUB ADDITIVE CATEGORIES, %, ASIA-PACIFIC, 2022 AND 2029
- Figure 123:
- VOLUME OF REST OF ASIA-PACIFIC FEED PHYTOGENICS, METRIC TON, ASIA-PACIFIC, 2017 - 2029
- Figure 124:
- VALUE OF REST OF ASIA-PACIFIC FEED PHYTOGENICS, USD, ASIA-PACIFIC, 2017 - 2029
- Figure 125:
- VALUE SHARE OF REST OF ASIA-PACIFIC FEED PHYTOGENICS BY SUB ADDITIVE CATEGORIES, %, ASIA-PACIFIC, 2022 AND 2029
- Figure 126:
- VOLUME OF FEED PHYTOGENICS BY COUNTRY, METRIC TON, EUROPE, 2017 - 2029
- Figure 127:
- VALUE OF FEED PHYTOGENICS BY COUNTRY, USD, EUROPE, 2017 - 2029
- Figure 128:
- VOLUME SHARE OF FEED PHYTOGENICS BY COUNTRY, %, EUROPE, 2017,2023 AND 2029
- Figure 129:
- VALUE SHARE OF FEED PHYTOGENICS BY COUNTRY, %, EUROPE, 2017,2023 AND 2029
- Figure 130:
- VOLUME OF FRANCE FEED PHYTOGENICS, METRIC TON, EUROPE, 2017 - 2029
- Figure 131:
- VALUE OF FRANCE FEED PHYTOGENICS, USD, EUROPE, 2017 - 2029
- Figure 132:
- VALUE SHARE OF FRANCE FEED PHYTOGENICS BY SUB ADDITIVE CATEGORIES, %, EUROPE, 2022 AND 2029
- Figure 133:
- VOLUME OF GERMANY FEED PHYTOGENICS, METRIC TON, EUROPE, 2017 - 2029
- Figure 134:
- VALUE OF GERMANY FEED PHYTOGENICS, USD, EUROPE, 2017 - 2029
- Figure 135:
- VALUE SHARE OF GERMANY FEED PHYTOGENICS BY SUB ADDITIVE CATEGORIES, %, EUROPE, 2022 AND 2029
- Figure 136:
- VOLUME OF ITALY FEED PHYTOGENICS, METRIC TON, EUROPE, 2017 - 2029
- Figure 137:
- VALUE OF ITALY FEED PHYTOGENICS, USD, EUROPE, 2017 - 2029
- Figure 138:
- VALUE SHARE OF ITALY FEED PHYTOGENICS BY SUB ADDITIVE CATEGORIES, %, EUROPE, 2022 AND 2029
- Figure 139:
- VOLUME OF NETHERLANDS FEED PHYTOGENICS, METRIC TON, EUROPE, 2017 - 2029
- Figure 140:
- VALUE OF NETHERLANDS FEED PHYTOGENICS, USD, EUROPE, 2017 - 2029
- Figure 141:
- VALUE SHARE OF NETHERLANDS FEED PHYTOGENICS BY SUB ADDITIVE CATEGORIES, %, EUROPE, 2022 AND 2029
- Figure 142:
- VOLUME OF RUSSIA FEED PHYTOGENICS, METRIC TON, EUROPE, 2017 - 2029
- Figure 143:
- VALUE OF RUSSIA FEED PHYTOGENICS, USD, EUROPE, 2017 - 2029
- Figure 144:
- VALUE SHARE OF RUSSIA FEED PHYTOGENICS BY SUB ADDITIVE CATEGORIES, %, EUROPE, 2022 AND 2029
- Figure 145:
- VOLUME OF SPAIN FEED PHYTOGENICS, METRIC TON, EUROPE, 2017 - 2029
- Figure 146:
- VALUE OF SPAIN FEED PHYTOGENICS, USD, EUROPE, 2017 - 2029
- Figure 147:
- VALUE SHARE OF SPAIN FEED PHYTOGENICS BY SUB ADDITIVE CATEGORIES, %, EUROPE, 2022 AND 2029
- Figure 148:
- VOLUME OF TURKEY FEED PHYTOGENICS, METRIC TON, EUROPE, 2017 - 2029
- Figure 149:
- VALUE OF TURKEY FEED PHYTOGENICS, USD, EUROPE, 2017 - 2029
- Figure 150:
- VALUE SHARE OF TURKEY FEED PHYTOGENICS BY SUB ADDITIVE CATEGORIES, %, EUROPE, 2022 AND 2029
- Figure 151:
- VOLUME OF UNITED KINGDOM FEED PHYTOGENICS, METRIC TON, EUROPE, 2017 - 2029
- Figure 152:
- VALUE OF UNITED KINGDOM FEED PHYTOGENICS, USD, EUROPE, 2017 - 2029
- Figure 153:
- VALUE SHARE OF UNITED KINGDOM FEED PHYTOGENICS BY SUB ADDITIVE CATEGORIES, %, EUROPE, 2022 AND 2029
- Figure 154:
- VOLUME OF REST OF EUROPE FEED PHYTOGENICS, METRIC TON, EUROPE, 2017 - 2029
- Figure 155:
- VALUE OF REST OF EUROPE FEED PHYTOGENICS, USD, EUROPE, 2017 - 2029
- Figure 156:
- VALUE SHARE OF REST OF EUROPE FEED PHYTOGENICS BY SUB ADDITIVE CATEGORIES, %, EUROPE, 2022 AND 2029
- Figure 157:
- VOLUME OF FEED PHYTOGENICS BY COUNTRY, METRIC TON, MIDDLE EAST, 2017 - 2029
- Figure 158:
- VALUE OF FEED PHYTOGENICS BY COUNTRY, USD, MIDDLE EAST, 2017 - 2029
- Figure 159:
- VOLUME SHARE OF FEED PHYTOGENICS BY COUNTRY, %, MIDDLE EAST, 2017,2023 AND 2029
- Figure 160:
- VALUE SHARE OF FEED PHYTOGENICS BY COUNTRY, %, MIDDLE EAST, 2017,2023 AND 2029
- Figure 161:
- VOLUME OF IRAN FEED PHYTOGENICS, METRIC TON, MIDDLE EAST, 2017 - 2029
- Figure 162:
- VALUE OF IRAN FEED PHYTOGENICS, USD, MIDDLE EAST, 2017 - 2029
- Figure 163:
- VALUE SHARE OF IRAN FEED PHYTOGENICS BY SUB ADDITIVE CATEGORIES, %, MIDDLE EAST, 2022 AND 2029
- Figure 164:
- VOLUME OF SAUDI ARABIA FEED PHYTOGENICS, METRIC TON, MIDDLE EAST, 2017 - 2029
- Figure 165:
- VALUE OF SAUDI ARABIA FEED PHYTOGENICS, USD, MIDDLE EAST, 2017 - 2029
- Figure 166:
- VALUE SHARE OF SAUDI ARABIA FEED PHYTOGENICS BY SUB ADDITIVE CATEGORIES, %, MIDDLE EAST, 2022 AND 2029
- Figure 167:
- VOLUME OF REST OF MIDDLE EAST FEED PHYTOGENICS, METRIC TON, MIDDLE EAST, 2017 - 2029
- Figure 168:
- VALUE OF REST OF MIDDLE EAST FEED PHYTOGENICS, USD, MIDDLE EAST, 2017 - 2029
- Figure 169:
- VALUE SHARE OF REST OF MIDDLE EAST FEED PHYTOGENICS BY SUB ADDITIVE CATEGORIES, %, MIDDLE EAST, 2022 AND 2029
- Figure 170:
- VOLUME OF FEED PHYTOGENICS BY COUNTRY, METRIC TON, NORTH AMERICA, 2017 - 2029
- Figure 171:
- VALUE OF FEED PHYTOGENICS BY COUNTRY, USD, NORTH AMERICA, 2017 - 2029
- Figure 172:
- VOLUME SHARE OF FEED PHYTOGENICS BY COUNTRY, %, NORTH AMERICA, 2017,2023 AND 2029
- Figure 173:
- VALUE SHARE OF FEED PHYTOGENICS BY COUNTRY, %, NORTH AMERICA, 2017,2023 AND 2029
- Figure 174:
- VOLUME OF CANADA FEED PHYTOGENICS, METRIC TON, NORTH AMERICA, 2017 - 2029
- Figure 175:
- VALUE OF CANADA FEED PHYTOGENICS, USD, NORTH AMERICA, 2017 - 2029
- Figure 176:
- VALUE SHARE OF CANADA FEED PHYTOGENICS BY SUB ADDITIVE CATEGORIES, %, NORTH AMERICA, 2022 AND 2029
- Figure 177:
- VOLUME OF MEXICO FEED PHYTOGENICS, METRIC TON, NORTH AMERICA, 2017 - 2029
- Figure 178:
- VALUE OF MEXICO FEED PHYTOGENICS, USD, NORTH AMERICA, 2017 - 2029
- Figure 179:
- VALUE SHARE OF MEXICO FEED PHYTOGENICS BY SUB ADDITIVE CATEGORIES, %, NORTH AMERICA, 2022 AND 2029
- Figure 180:
- VOLUME OF UNITED STATES FEED PHYTOGENICS, METRIC TON, NORTH AMERICA, 2017 - 2029
- Figure 181:
- VALUE OF UNITED STATES FEED PHYTOGENICS, USD, NORTH AMERICA, 2017 - 2029
- Figure 182:
- VALUE SHARE OF UNITED STATES FEED PHYTOGENICS BY SUB ADDITIVE CATEGORIES, %, NORTH AMERICA, 2022 AND 2029
- Figure 183:
- VOLUME OF REST OF NORTH AMERICA FEED PHYTOGENICS, METRIC TON, NORTH AMERICA, 2017 - 2029
- Figure 184:
- VALUE OF REST OF NORTH AMERICA FEED PHYTOGENICS, USD, NORTH AMERICA, 2017 - 2029
- Figure 185:
- VALUE SHARE OF REST OF NORTH AMERICA FEED PHYTOGENICS BY SUB ADDITIVE CATEGORIES, %, NORTH AMERICA, 2022 AND 2029
- Figure 186:
- VOLUME OF FEED PHYTOGENICS BY COUNTRY, METRIC TON, SOUTH AMERICA, 2017 - 2029
- Figure 187:
- VALUE OF FEED PHYTOGENICS BY COUNTRY, USD, SOUTH AMERICA, 2017 - 2029
- Figure 188:
- VOLUME SHARE OF FEED PHYTOGENICS BY COUNTRY, %, SOUTH AMERICA, 2017,2023 AND 2029
- Figure 189:
- VALUE SHARE OF FEED PHYTOGENICS BY COUNTRY, %, SOUTH AMERICA, 2017,2023 AND 2029
- Figure 190:
- VOLUME OF ARGENTINA FEED PHYTOGENICS, METRIC TON, SOUTH AMERICA, 2017 - 2029
- Figure 191:
- VALUE OF ARGENTINA FEED PHYTOGENICS, USD, SOUTH AMERICA, 2017 - 2029
- Figure 192:
- VALUE SHARE OF ARGENTINA FEED PHYTOGENICS BY SUB ADDITIVE CATEGORIES, %, SOUTH AMERICA, 2022 AND 2029
- Figure 193:
- VOLUME OF BRAZIL FEED PHYTOGENICS, METRIC TON, SOUTH AMERICA, 2017 - 2029
- Figure 194:
- VALUE OF BRAZIL FEED PHYTOGENICS, USD, SOUTH AMERICA, 2017 - 2029
- Figure 195:
- VALUE SHARE OF BRAZIL FEED PHYTOGENICS BY SUB ADDITIVE CATEGORIES, %, SOUTH AMERICA, 2022 AND 2029
- Figure 196:
- VOLUME OF CHILE FEED PHYTOGENICS, METRIC TON, SOUTH AMERICA, 2017 - 2029
- Figure 197:
- VALUE OF CHILE FEED PHYTOGENICS, USD, SOUTH AMERICA, 2017 - 2029
- Figure 198:
- VALUE SHARE OF CHILE FEED PHYTOGENICS BY SUB ADDITIVE CATEGORIES, %, SOUTH AMERICA, 2022 AND 2029
- Figure 199:
- VOLUME OF REST OF SOUTH AMERICA FEED PHYTOGENICS, METRIC TON, SOUTH AMERICA, 2017 - 2029
- Figure 200:
- VALUE OF REST OF SOUTH AMERICA FEED PHYTOGENICS, USD, SOUTH AMERICA, 2017 - 2029
- Figure 201:
- VALUE SHARE OF REST OF SOUTH AMERICA FEED PHYTOGENICS BY SUB ADDITIVE CATEGORIES, %, SOUTH AMERICA, 2022 AND 2029
- Figure 202:
- MOST ACTIVE COMPANIES BY NUMBER OF STRATEGIC MOVES, COUNT, GLOBAL, 2017 - 2023
- Figure 203:
- MOST ADOPTED STRATEGIES, COUNT, GLOBAL, 2017 - 2023
- Figure 204:
- VALUE SHARE OF MAJOR PLAYERS, %, GLOBAL
Feed Phytogenics Industry Segmentation
Essential Oil, Herbs & Spices are covered as segments by Sub Additive. Aquaculture, Poultry, Ruminants, Swine are covered as segments by Animal. Africa, Asia-Pacific, Europe, Middle East, North America, South America are covered as segments by Region.| Sub Additive | Essential Oil | |||
| Herbs & Spices | ||||
| Other Phytogenics | ||||
| Animal | Aquaculture | By Sub Animal | Fish | |
| Shrimp | ||||
| Other Aquaculture Species | ||||
| Poultry | By Sub Animal | Broiler | ||
| Layer | ||||
| Other Poultry Birds | ||||
| Ruminants | By Sub Animal | Beef Cattle | ||
| Dairy Cattle | ||||
| Other Ruminants | ||||
| Swine | ||||
| Other Animals | ||||
| Region | Africa | By Country | Egypt | |
| Kenya | ||||
| South Africa | ||||
| Rest of Africa | ||||
| Asia-Pacific | By Country | Australia | ||
| China | ||||
| India | ||||
| Indonesia | ||||
| Japan | ||||
| Philippines | ||||
| South Korea | ||||
| Thailand | ||||
| Vietnam | ||||
| Rest of Asia-Pacific | ||||
| Europe | By Country | France | ||
| Germany | ||||
| Italy | ||||
| Netherlands | ||||
| Russia | ||||
| Spain | ||||
| Turkey | ||||
| United Kingdom | ||||
| Rest of Europe | ||||
| Middle East | By Country | Iran | ||
| Saudi Arabia | ||||
| Rest of Middle East | ||||
| North America | By Country | Canada | ||
| Mexico | ||||
| United States | ||||
| Rest of North America | ||||
| South America | By Country | Argentina | ||
| Brazil | ||||
| Chile | ||||
| Rest of South America | ||||
Need A Different Region or Segment?
Customize Now
Market Definition
- FUNCTIONS - For the study, feed additives are considered to be commercially manufactured products that are used to enhance characteristics such as weight gain, feed conversion ratio, and feed intake when fed in appropriate proportions.
- RESELLERS - Companies engaged in reselling feed additives without value addition have been excluded from the market scope, to avoid double counting.
- END CONSUMERS - Compound feed manufacturers are considered to be end-consumers in the market studied. The scope excludes farmers buying feed additives to be used directly as supplements or premixes.
- INTERNAL COMPANY CONSUMPTION - Companies engaged in the production of compound feed as well as the manufacturing of feed additives are part of the study. However, while estimating the market sizes, the internal consumption of feed additives by such companies has been excluded.
| Keyword | Definition |
|---|---|
| Feed additives | Feed additives are products used in animal nutrition for purposes of improving the quality of feed and the quality of food from animal origin, or to improve the animals’ performance and health. |
| Probiotics | Probiotics are microorganisms introduced into the body for their beneficial qualities. (It maintains or restores beneficial bacteria to the gut). |
| Antibiotics | Antibiotic is a drug that is specifically used to inhibit the growth of bacteria. |
| Prebiotics | A non-digestible food ingredient that promotes the growth of beneficial microorganisms in the intestines. |
| Antioxidants | Antioxidants are compounds that inhibit oxidation, a chemical reaction that produces free radicals. |
| Phytogenics | Phytogenics are a group of natural and non-antibiotic growth promoters derived from herbs, spices, essential oils, and oleoresins. |
| Vitamins | Vitamins are organic compounds, which are required for normal growth and maintenance of the body. |
| Metabolism | A chemical process that occurs within a living organism in order to maintain life. |
| Amino acids | Amino acids are the building blocks of proteins and play an important role in metabolic pathways. |
| Enzymes | Enzyme is a substance that acts as a catalyst to bring about a specific biochemical reaction. |
| Anti-microbial resistance | The ability of a microorganism to resist the effects of an antimicrobial agent. |
| Anti-microbial | Destroying or inhibiting the growth of microorganisms. |
| Osmotic balance | It is a process of maintaining salt and water balance across membranes within the body's fluids. |
| Bacteriocin | Bacteriocins are the toxins produced by bacteria to inhibit the growth of similar or closely related bacterial strains. |
| Biohydrogenation | It is a process that occurs in the rumen of an animal in which bacteria convert unsaturated fatty acids (USFA) to saturated fatty acids (SFA). |
| Oxidative rancidity | It is a reaction of fatty acids with oxygen, which generally causes unpleasant odors in animals. To prevent these, antioxidants were added. |
| Mycotoxicosis | Any condition or disease caused by fungal toxins, mainly due to contamination of animal feed with mycotoxins. |
| Mycotoxins | Mycotoxins are toxin compounds that are naturally produced by certain types of molds (fungi). |
| Feed Probiotics | Microbial feed supplements positively affect gastrointestinal microbial balance. |
| Probiotic yeast | Feed yeast (single-cell fungi) and other fungi used as probiotics. |
| Feed enzymes | They are used to supplement digestive enzymes in an animal’s stomach to break down food. Enzymes also ensure that meat and egg production is improved. |
| Mycotoxin detoxifiers | They are used to prevent fungal growth and to stop any harmful mold from being absorbed in the gut and blood. |
| Feed antibiotics | They are used both for the prevention and treatment of diseases but also for rapid growth and development. |
| Feed antioxidants | They are used to protect the deterioration of other feed nutrients in the feed such as fats, vitamins, pigments, and flavoring agents, thus providing nutrient security to the animals. |
| Feed phytogenics | Phytogenics are natural substances, added to livestock feed to promote growth, aid in digestion, and act as anti-microbial agents. |
| Feed vitamins | They are used to maintain the normal physiological function and normal growth and development of animals. |
| Feed flavors and sweetners | These flavors and sweeteners help to mask tastes and odors during changes in additives or medications and make them ideal for animal diets undergoing transition. |
| Feed acidifiers | Animal feed acidifiers are organic acids incorporated into the feed for nutritional or preservative purposes. Acidifiers enhance congestion and microbiological balance in the alimentary and digestive tracts of livestock. |
| Feed minerals | Feed minerals play an important role in the regular dietary requirements of animal feed. |
| Feed binders | Feed binders are the binding agents used in the manufacture of safe animal feed products. It enhances the taste of food and prolongs the storage period of the feed. |
| Key Terms | Abbreviation |
| LSDV | Lumpy Skin Disease Virus |
| ASF | African Swine Fever |
| GPA | Growth Promoter Antibiotics |
| NSP | Non-Starch Polysaccharides |
| PUFA | Polyunsaturated Fatty Acid |
| Afs | Aflatoxins |
| AGP | Antibiotic Growth Promoters |
| FAO | The Food And Agriculture Organization of the United Nations |
| USDA | The United States Department of Agriculture |
Need More Details on Market Definition?
Ask a Question
Research Methodology
Mordor Intelligence follows a four-step methodology in all our reports.
- Step-1: IDENTIFY KEY VARIABLES: In order to build a robust forecasting methodology, the variables and factors identified in Step-1 are tested against available historical market numbers. Through an iterative process, the variables required for market forecast are set and the model is built on the basis of these variables.
- Step-2: Build a Market Model: Market-size estimations for the forecast years are in nominal terms. Inflation is not a part of the pricing, and the average selling price (ASP) is kept constant throughout the forecast period.
- Step-3: Validate and Finalize: In this important step, all market numbers, variables and analyst calls are validated through an extensive network of primary research experts from the market studied. The respondents are selected across levels and functions to generate a holistic picture of the market studied.
- Step-4: Research Outputs: Syndicated Reports, Custom Consulting Assignments, Databases & Subscription Platforms

Get More Details On Research Methodology
Download PDF


