
Family Offices Market Size and Share
Market Overview
| Study Period | 2020 - 2031 |
|---|---|
| Market Size (2026) | USD 21.47 Billion |
| Market Size (2031) | USD 29.65 Billion |
| Growth Rate (2026 - 2031) | 6.67% CAGR |
| Fastest Growing Market | Middle East and Africa |
| Largest Market | North America |
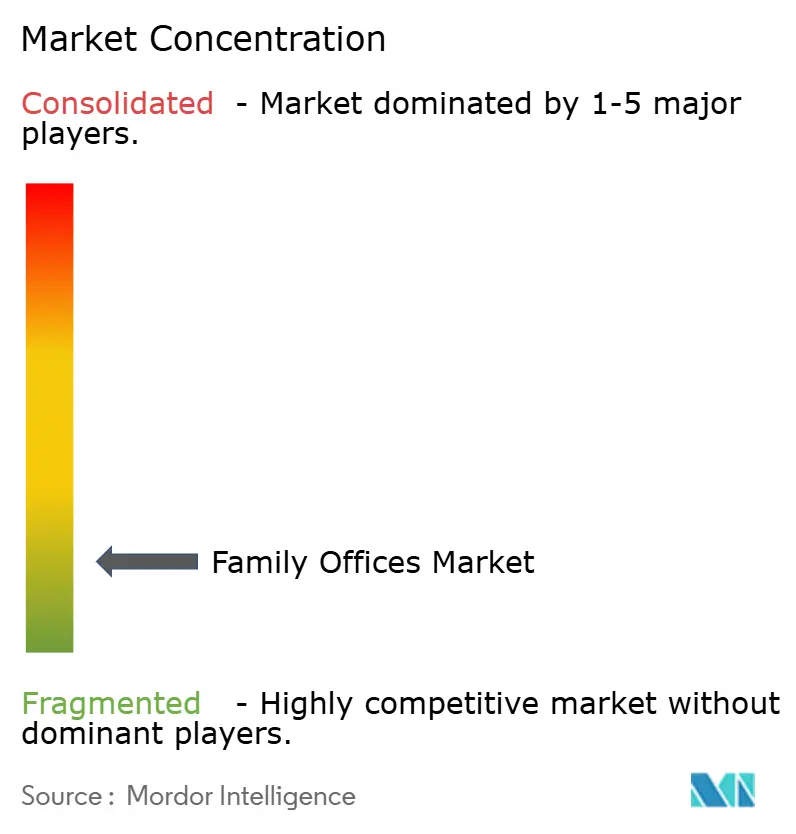
| Market Concentration | Low |
Major Players *Disclaimer: Major Players sorted in no particular order Image © Mordor Intelligence. Reuse requires attribution under CC BY 4.0. | |
Family Offices Market Analysis by Mordor Intelligence
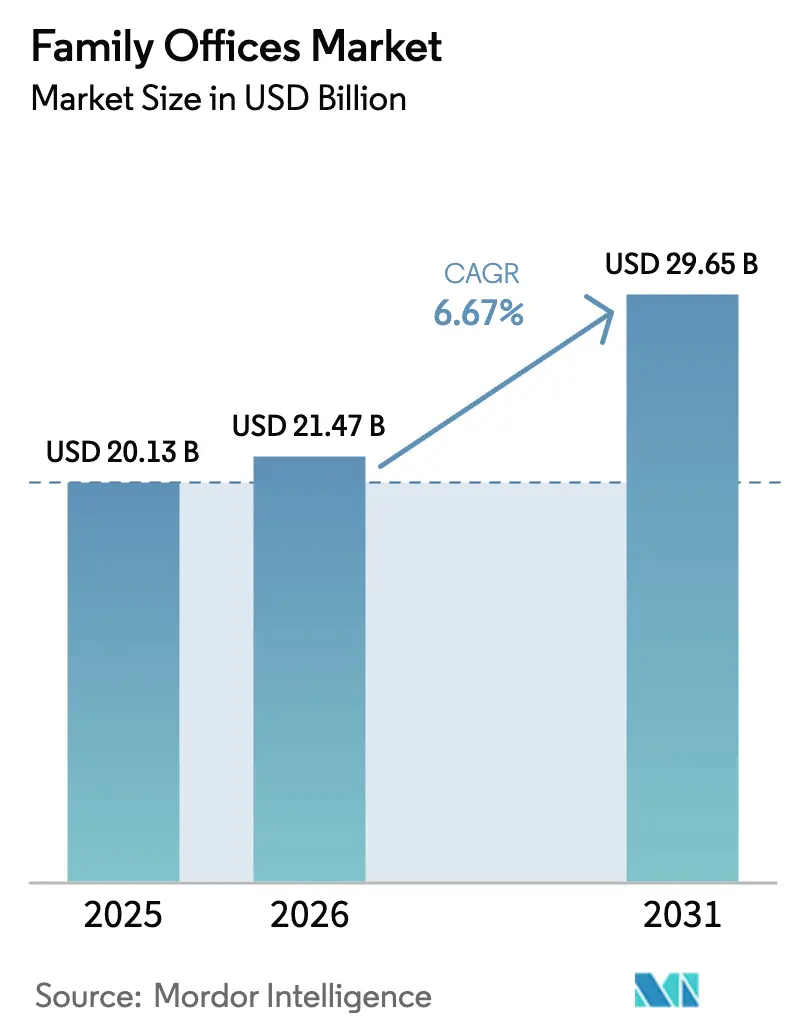
The Family Offices Market size was valued at USD 20.13 billion in 2025 and is estimated to grow from USD 21.47 billion in 2026 to reach USD 29.65 billion by 2031, at a CAGR of 6.67% during the forecast period (2026-2031).
UHNW families are shifting toward dedicated platforms as the global ultra-high-net-worth population surpassed 510,810 individuals in mid-2025 with USD 59.8 trillion in collective wealth and is projected to reach 676,970 by 2030, led by founders in technology, healthcare, and sustainable infrastructure[1]Altrata, “World Ultra Wealth Report 2025,” Altrata, altrata.com. Single Family Offices continue to anchor the family offices market, while Multi-Family Offices are gaining with faster growth due to scale benefits, access to institutional deal flow, and shared compliance capabilities that improve cost-to-serve for families below standalone thresholds. Alternative assets have become the largest portfolio block for many offices as private equity allocations average higher portfolio weights, and 70% of family offices executed direct investments in 2025 to improve fee efficiency and influence outcomes. Regionally, North America holds the largest share in the family offices market, while the Middle East and Africa are expanding fastest as Dubai and Abu Dhabi attract new formations with simplified rules and zero-tax regimes supported by modern financial-center infrastructure.
Key Report Takeaways
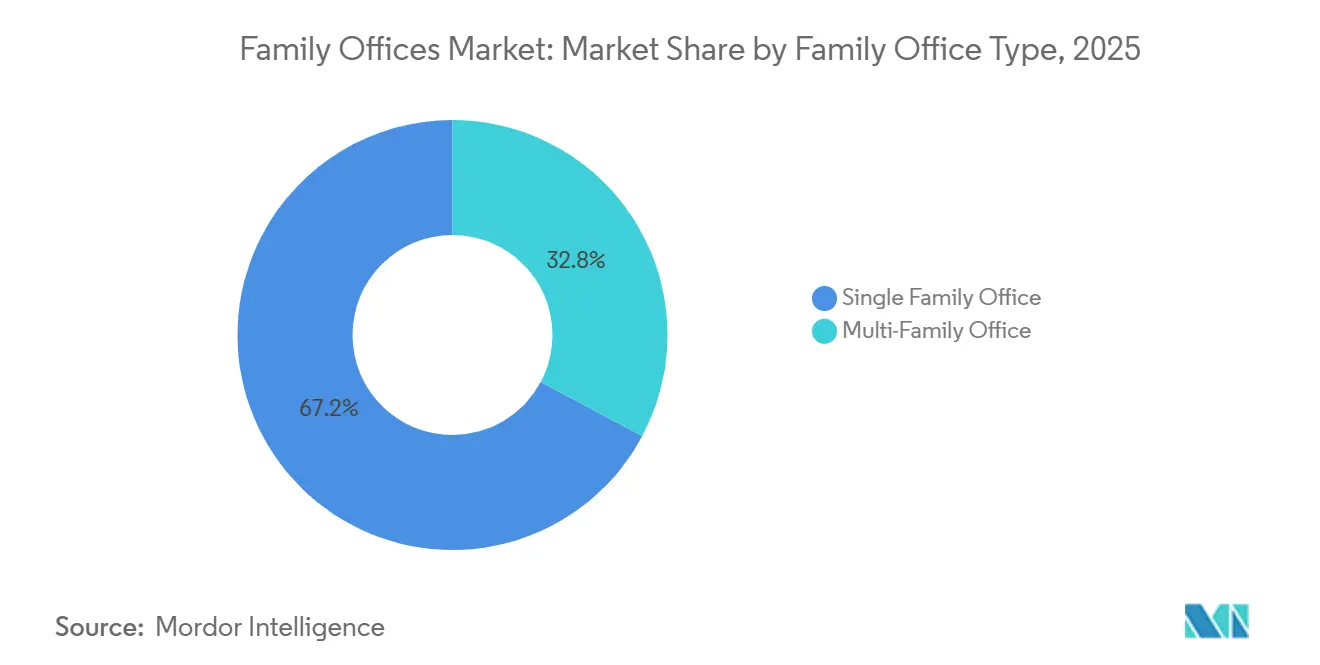
- By family office type, single-family offices led with 67.2% of the family offices market share in 2025. Multi-Family Offices are forecast to expand at a 7.8% CAGR through 2031.
- By asset-class allocation, alternatives accounted for the largest weight at 45.49% in f the family offices market share in 2025. alternatives are projected to grow at a 7.34% CAGR through 2031.
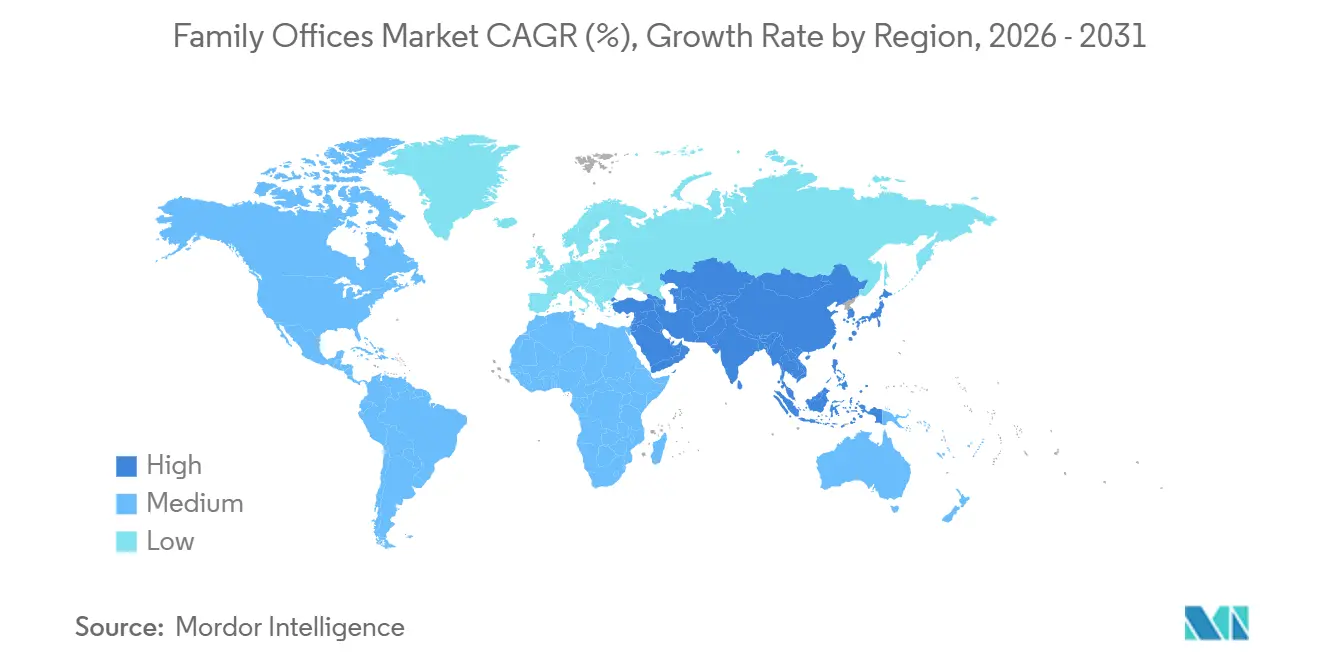
- By geography, North America held a 47.67% share in 2025. The Middle East and Africa are projected to post the highest regional growth at an 8.17% CAGR to 2031.
Note: Market size and forecast figures in this report are generated using Mordor Intelligence’s proprietary estimation framework, updated with the latest available data and insights as of January 2026.
Global Family Offices Market Trends and Insights
Drivers Impact Analysis*
| Driver | (~) % Impact on CAGR Forecast | Geographic Relevance | Impact Timeline |
|---|---|---|---|
| Rising number of UHNW individuals | +1.8% | Global, with North America and Asia-Pacific leading | Short term (≤ 2 years) |
| Demand for bespoke wealth-management solutions | +1.5% | Global, particularly high in Europe and the Middle East | Medium term (2-4 years) |
| Shift toward alternative & private-market assets | +1.4% | Global core, with spillover to emerging hubs (Singapore, Dubai) | Long term (≥ 4 years) |
| Professionalization & institutionalization wave | +0.9% | North America and Europe are mature markets, and Asia-Pacific is an emerging market. | Medium term (2-4 years) |
| Digital-asset custody rails for family offices | +0.7% | Early adoption in the UAE and Singapore, with the U.S. following after regulation | Long term (≥ 4 years) |
| Jurisdictional arbitrage (Singapore, Dubai hubs) | +0.4% | Concentrated in the Middle East and Southeast Asia, with spillover to global mobility | Short term (≤ 2 years) |
| Source: Mordor Intelligence | |||
Rising Number of UHNW Individuals
The global ultra-high-net-worth cohort expanded to 510,810 individuals in mid-2025 with USD 59.8 trillion in wealth, but regional patterns diverged with North America adding more millionaires while parts of Europe contracted on tax and currency pressures. New demand in the family offices market is strongest among first-generation wealth creators, who seek greater control, faster decision cycles, and operational levers to improve performance compared with inherited-wealth families. Asia-Pacific’s rise includes a larger share of first-generation UHNW families prioritizing asset protection and education infrastructure, which supports growth in multi-jurisdictional structures and services across hubs such as Singapore and Dubai[2]Monetary Authority of Singapore, “Fund Tax Incentive Scheme for Family Offices,” MAS, mas.gov.sg. India added a notable cohort of new millionaires in 2024, which supports regional demand for cross-border structuring, investment access, and governance capabilities that align with succession goals. The concentration of wealth among a small UHNW segment keeps competition intense in the family offices market, with mandates tilting toward managers who can deliver co-investments and measurable alpha rather than purely relationship-led models.
Demand for Bespoke Wealth-Management Solutions
Centralized oversight drives formation rationales as families consolidate investment, tax, governance, and administrative services into single platforms for better visibility and coordination across liquid and private holdings. Next-generation heirs in the family offices market expect technology-enabled transparency, co-investment access, and balanced risk-taking, which challenge legacy paternalistic approaches and push platforms to build real-time dashboards and collaborative decision processes. Operating costs vary with scale, and the threshold effects are clear as families below USD 200 million increasingly choose multi-family office models to share fixed costs without losing customization[3]Citi Private Bank, “2025 Global Family Office Report,” Citigroup, privatebank.citibank.com. A broadening service scope that includes philanthropy, family governance, and concierge services is becoming a standard expectation, which favors firms with integrated teams and robust vendor networks. The sustained shift toward tailored platforms continues to expand the family offices market as sophisticated households seek tighter alignment between personal objectives and portfolio outcomes.
Shift Toward Alternative & Private-Market Assets
Alternatives accounted for a large and rising share of portfolios in 2025 as family offices prioritized private equity, private credit, real assets, and secondaries to enhance yield and control. Families in the family offices market plan to increase private equity exposure and redeploy cash toward risk assets as rate and liquidity conditions evolve in 2026, a stance reinforced by continued demand for infrastructure and data center-linked opportunities[4]BlackRock Research Team, “2025 Global Family Office Report,” BlackRock, blackrock.com. Private credit reached a multi-trillion-dollar scale by 2025 and is projected to grow further, offering yields above liquid credit with stronger covenants and superior seniority that appeal to capital preservation and income goals. Family offices also increased secondaries participation to shorten J-curves and diversify vintage-year exposure, which helps reduce liquidity risk at higher private allocations. Governance and cash-flow modeling needs are rising as allocations to private markets increase, which reinforces the need for stronger operations, data, and treasury functions in the family offices market.
Professionalization & Institutionalization Wave
Regulatory scrutiny and cyber risks are accelerating the move to institutional-grade governance, including written policies, formal decision rights, and committee structures. Compliance modernization is a core mandate as the OECD’s updated Common Reporting Standard 2.0 expands disclosure to crypto-assets, CBDC, and beneficial ownership, which increases reporting complexity for cross-border structures starting with 2026 data. Compensation benchmarks reflect competitive hiring as CEO and CIO roles in large family offices approach pay levels in alternative investment firms, supported by co-invest opportunities and long-term incentives to retain scarce talent. Outsourcing plays a bigger role for cybersecurity, technology, and specialized due diligence, where in-house teams may not be economical, helping small and mid-sized platforms match institutional standards. The push to professionalize is now a competitive requirement in the family offices market, not an optional enhancement, as principals demand robust controls that match investment ambition.
Restraints Impact Analysis*
| Restraint | (~) % Impact on CAGR Forecast | Geographic Relevance | Impact Timeline |
|---|---|---|---|
| Legacy core-systems dependence | -0.8% | Global, particularly acute in Europe and older U.S. family offices | Medium term (2-4 years) |
| Complexity of multi-asset global portfolios | -0.6% | Global, with the highest impact in Asia-Pacific and cross-border structures | Long term (≥ 4 years) |
| Talent-war & compensation inflation | -0.9% | North America and Singapore core, with spillover to major financial centers | Short term (≤ 2 years) |
| Heightened tax-transparency enforcement | -0.4% | OECD jurisdictions, particularly impacting offshore structures | Medium term (2-4 years) |
| Source: Mordor Intelligence | |||
Legacy Core-Systems Dependence
Many family offices still rely on spreadsheets and manual aggregation, which introduces reconciliation risks, slower reporting, and audit challenges compared with institutional peers using consolidated platforms. Integration with custodians, administrators, and tax systems is a common pain point, and change management slows adoption of modern software even where benefits are clear. Smaller offices face cost thresholds where enterprise tools require subscription and implementation budgets that compress overall expense ratios, creating pressure to outsource or join multi-family platforms. Compliance reporting needs under CRS 2.0 and related regimes make manual processes more risky and labor-intensive, increasing the operational burden in the family offices market. Where modern tools are deployed, firms report time savings and error reduction, but execution risk in migrations remains a barrier that calls for phased rollouts and stakeholder alignment.
Complexity of Multi-Asset Global Portfolios
Portfolios now combine public markets, multiple private strategies, direct real estate, and operating businesses across legal entities and jurisdictions, which increases complexity and raises data and governance requirements. Private market allocations require capital-call forecasting and valuation oversight that differ from liquid asset workflows and stretch smaller teams. Direct real estate needs property-level accounting and compliance depending on structure and jurisdiction, which deepens the administrative load. Cross-border operations require families to align reporting regimes and comply with overlapping disclosure rules, which adds to the operational demands in the family offices market. Digital asset positions introduce additional reporting and custody needs, so many offices segment these exposures with dedicated providers.
*Our forecasts treat driver/restraint impacts as directional, not additive. The impact forecasts reflect baseline growth, mix effects, and variable interactions.
Segment Analysis
By Family Office Type: Concentrated Wealth Favors Single-Family Structures
Single Family Offices captured 67.21% of the family offices market share in 2025, reflecting the preference of larger households for dedicated teams and bespoke control across investments, governance, and administration. Within this structure, costs are better absorbed at higher AUM levels because full-service teams must cover investment, tax, operations, and security functions for complex families. Multi-Family Offices are projected to expand at a 7.96% CAGR through 2031 as cost-sharing, pooled access to co-investments, and scale leverage across compliance and data systems attract families below standalone thresholds. As succession planning accelerates, Multi-Family Offices gain relevance through institutionalized client service and operational continuity, helping mitigate key-person risk in single-family setups.
Cost thresholds shape structure choices because comprehensive single-family operations only consolidate at a larger scale, while smaller families find the family offices market better served by shared platforms that deliver institutional controls at a lower all-in cost. Compliance obligations under CRS 2.0 and CARF increase the fixed-cost burden for standalone offices, which is one reason multi-client platforms are capturing growth. Technology adoption continues to vary by office age and principal preferences, yet expectations for near-real-time reporting are rising across both models as data aggregation improves. Over time, the blend of in-house leadership with outsourced specialist support is likely to define the balanced operating model in India and globally as governance standards converge in the family offices market.


By Asset-Class Allocation: Alternatives Eclipse Traditional Holdings
Alternative assets accounted for the largest allocation at 45.49% in 2025 and are projected to grow at a 7.34% CAGR through 2031 as families seek illiquidity premia, control rights, and differentiated sources of return that complement public markets. Private equity remains the largest private allocation block, with increasing use of directs and co-investments to reduce fee drag and gain closer oversight of value-creation levers. Private credit reached scale by 2025 and is set to expand further as spreads and covenant protections continue to attract capital from the family offices market seeking resilient income. Real estate allocations are poised to increase as families add living sectors, logistics, and digital infrastructure that align with long-term compounding and wealth preservation goals. The use of secondaries helps shorten duration and smooth capital deployment cycles, making private programs more manageable for smaller teams in the family office market.
Hedge funds, commodities, and cash remain tactical levers that provide liquidity and downside management, especially when redeployment opportunities arise in private markets. Governance demands scale with higher private allocations because valuations, capital calls, and monitoring require structured processes and data fidelity. ESG integration continues to rise among younger principals and inheritors, which influences manager selection and reporting expectations across private equity, credit, and real assets. In India and across Asia, venture capital interest remains elevated alongside infrastructure and real assets as families align capital with technology adoption and long-horizon growth themes in the family offices market.
Geography Analysis
North America remains the largest region by share in 2025 and continues to define the family offices market through deep public and private capital markets, mature governance practices, and robust estate and trust regimes. Families in the United States have increased direct investment activity and private-market allocations, which reinforces demand for seasoned deal teams and operational controls. Changes to federal tax parameters and QSBS provisions in 2025 support continued interest in venture and growth strategies that complement private equity allocations. Canada contributes stability and cross-border optionality with the United States markets, while Mexico’s wealth migration patterns continue to shape cross-border family strategies into Texas and Florida. The region’s scale and infrastructure set the benchmark for the family offices market, while competition from other hubs rises as families prioritize mobility and tax certainty.
Europe maintains a significant installed base of family offices alongside evolving tax and regulatory landscapes that influence domicile and structuring choices. Shifts in non-domicile status and debates over inheritance taxation have pushed some families to consider relocation, which affects where new vehicles and teams are established in the family offices market. Switzerland retains strong appeal through its longstanding private banking and trust expertise, although policy debates are closely watched by principals planning multi-generational frameworks. The EU’s DAC8 directive aligns digital-asset reporting with broader transparency measures, increasing compliance requirements for European offices beginning with 2027 reporting. Across key markets, families are focusing on governance and education for heirs to maintain cohesion through transitions.
Asia-Pacific is the second-largest region by wealth and a focal point of growth with a younger UHNW base and substantial new formation activity centered on Singapore. MAS reduced processing times for family office tax incentives to 3 months in September 2025, supporting a growing pipeline and improved predictability for applicants. India continues to add millionaires and entrepreneurs, which supports demand for cross-border structures, education, and governance programs as families seek scale in the family offices market. Hong Kong and Singapore compete on talent, regulatory clarity, and access to investment ecosystems, while Australia’s rules shape choices for local domiciles despite strong rule-of-law advantages. The Middle East and Africa post the fastest growth rates through 2031, driven by UAE hubs offering tax neutrality, common-law courts, and migration pathways that align with global mobility trends.

Regulatory Landscape
Regulation for family offices continues to tighten around tax transparency, AML/CFT, and investor eligibility, which is pushing operating models toward more formal documentation and reporting. In the United States, the SEC increased the Investment Advisers Act Rule 205-3 qualified client thresholds effective 29 June 2026 (including USD 1.4 million in assets under management with the adviser and USD 2.7 million net worth), requiring updates to onboarding, subscription documents, and suitability checks for advisory relationships tied to private funds.
Asia and Europe are also refining hub frameworks that shape domicile decisions and compliance cost. Singapore updated its licensing exemption framework for Single Family Offices and set a deadline for existing offices to file a Notification of Commencement of Business by 15 June 2027, while Malaysia gazetted the Income Tax (Single Family Office Incentive Scheme) Rules on 3 October 2025 for Forest City Special Financial Zone structures. In the EU, Directive (EU) 2026/470 (adopted 24 February 2026) and the EU AMLA consultation on 16 April 2026 on groupwide AML/CFT technical standards add to the compliance stack for families with holding structures and multi-jurisdictional entities.
Value Chain Analysis
The family offices market value chain begins with UHNW principals and family councils defining governance, objectives, and risk constraints, then moves to selecting an operating model (single-family office, multi-family office, or virtual/outsourced family office). Core delivery covers portfolio construction and manager selection, direct and co-investment execution, consolidated reporting and performance measurement, treasury and cash management, and non-investment services such as tax, estate planning, philanthropy, and concierge. Execution depends heavily on third parties, including custodians and prime brokers, fund administrators, legal and tax advisers, accounting firms, and specialist providers for cybersecurity and data aggregation.
Key friction points cluster around data and controls. Manual consolidation across banks, private funds, and operating assets slows close cycles, increases reconciliation risk, and adds cost to meet new reporting demands, including broader tax transparency and crypto-related disclosures. The compliance layer has become more prominent in the chain, with hub frameworks such as MAS requirements under the revised Singapore SFO framework (effective 15 June 2026) increasing standard filings, and cross-border substance and documentation requirements raising the need for coordinated legal, tax, and operational vendor management. Multi-family offices and outsourced-CIO models gain process leverage by spreading technology, compliance tooling, and specialist due diligence across multiple families.
Competitive Landscape
The family offices market remains fragmented with no single entity holding a double-digit share, and firms are scaling through acquisitions, alliances, and talent strategies to deliver integrated service stacks. Established single-family offices such as Cascade Investment and Walton Enterprises leverage long track records, direct investment engines, and access to top-tier private equity co-investments that smaller platforms cannot match on pricing or allocation size. Leading multi-family offices like ICONIQ Capital and Bessemer Trust differentiate with consolidated reporting, outsourced CIO frameworks, and in-house direct capabilities that meet the expanded scope of modern mandates. Technology-enabled virtual family office models are emerging with API integration across custodians and fund administrators, which helps reduce all-in costs and scale services for families in the USD 50–200 million band. As client expectations rise, firms in the family offices market must demonstrate control, data transparency, and co-investment access to win and retain multi-generational relationships.
Regulatory changes for 2026 and beyond reinforce the advantage of scale as firms amortize compliance and technology investments across larger client bases. CRS 2.0 and CARF implementation require stronger KYC, beneficial ownership, and crypto-asset reporting, which is more cost-efficient for larger multi-family offices and integrated wealth platforms. The family offices market also reflects persistent talent scarcity, so firms compete by offering co-invest rights and long-term incentives across investment teams, especially for CIO-track roles. Large banks and asset managers participate as service providers with specialized custody, lending, and alternative distribution, which helps offices extend capabilities without fully rebuilding internally. Digital reporting standards and cybersecurity are now core differentiators as clients expect consolidated, near real-time portfolio visibility across public, private, and digital assets.
Strategic moves in the family offices market emphasize direct investment sourcing, data modernization, and region-specific buildouts. Multi-family offices are deepening partnerships with top-quartile sponsors to secure co-invest allocations and improve net-of-fee outcomes for clients. Several platforms are expanding their presence in Singapore and Dubai to serve India- and Middle East-linked families that prefer tax-neutral hubs with predictable regulatory timelines. Technology programs are focused on data ingestion, reconciliation automation, and secured environments that reduce operational risk and support more frequent reporting cycles. The net effect is a competitive field where relationship depth must be matched by operational strength and transparent economics to win in the family offices market.
Family Offices Industry Leaders
Walton Enterprises LLC
Cascade Investment
Bezos Expeditions
MSD Capital / DFO Management
Bessemer Trust
- *Disclaimer: Major Players sorted in no particular order

Market Opportunities and Future Outlook
Formalized hub regimes are creating clearer pathways for formation, migration, and ongoing operations, which expands addressable demand for multi-family office platforms and specialist service providers that can industrialize compliance and reporting. Singapore put its revised Single Family Office framework into effect on 15 June 2026 (including a Notice of Commencement of Business requirement), while Hong Kong gazetted the Inland Revenue (Amendment) (Tax Concessions for Funds, Family Investment Holding Vehicles, and Carried Interest) Bill 2026 on 12 June 2026 to enhance the Unified Fund Exemption regime with retrospective effect from the 2025/26 year of assessment. These changes increase the value of turnkey operating infrastructure, including entity administration, KYC/AML, audit-ready reporting, and governance documentation, for families using Singapore and Hong Kong as coordination centers.
On the investment side, direct investing and thematic exposure are shaping how family offices allocate internal resources and external partnerships. S&P Global Market Intelligence reported family office direct investments into companies and real estate increased 123.3% year-over-year in 2025 to USD 12.9 billion across 158 transactions, supporting demand for in-house deal execution, co-invest syndication, and post-deal monitoring capabilities across both single and multi-family models. Corporate research evidence also points to concentration in AI-related themes (including infrastructure and semiconductors) and a visible whitespace in infrastructure allocations, which creates room for product structures and advisory offerings that package access, governance, and cash-flow modeling for long-duration assets.
Recent Industry Developments
- June 2026: Bezos Expeditions made multiple direct investments in AI startups during June 2026, including participation in large funding rounds. The activity highlights continued expansion of family office-led direct investing, increasing competitive pressure on traditional venture and growth equity channels for access and terms.
- May 2026: Cascade Investment disclosed a series of open-market purchases of Republic Services shares between May 11 and May 18, 2026, totaling 987,150 shares. The accumulation underscores how large single-family offices use public markets for concentrated, long-duration positioning alongside private market programs.
- March 2026: Walton Enterprises filed an amended Schedule 13D/A for Walmart Inc., describing dispositions of common stock including distributions to trust beneficiaries and sales for investment, personal, and charitable objectives. The filing illustrates ongoing portfolio and estate planning mechanics that can influence mandate scope for family office administration, tax, and governance support providers.


Research Methodology Framework and Report Scope
Market Definition and Coverage
For this methodology, the family offices market is defined as the annual fee income earned for managing wealth and related services for ultra high net worth families through single, multi, and virtual family office structures.
Scope exclusions: We exclude private bank wealth desks, investment advisers that do not operate as family offices, and software only platforms with no ongoing advisory or management fee revenue.
Segmentation Overview
- By Family Office Type
- Single Family Office
- Multi-Family Office
- By Asset-Class Allocation
- Bonds
- Equities
- Alternatives
- Commodities
- Cash & Cash Equivalents
- By Region
- North America
- United States
- Canada
- Mexico
- South America
- Brazil
- Argentina
- Chile
- Colombia
- Rest of South America
- Europe
- United Kingdom
- Germany
- France
- Spain
- Italy
- Benelux (Belgium, Netherlands, and Luxembourg)
- Nordics (Sweden, Norway, Denmark, Finland, and Iceland)
- Rest of Europe
- Asia-Pacific
- China
- India
- Japan
- South Korea
- Australia
- South-East Asia (Singapore, Indonesia, Malaysia, Thailand, Vietnam, and Philippines)
- Rest of Asia-Pacific
- Middle East and Africa
- United Arab Emirates
- Saudi Arabia
- South Africa
- Nigeria
- Rest of Middle East and Africa
- North America
Data Sources, Market Sizing, and Validation
Desk Research
Desk research is used to map the demand pool and how family offices typically operate, before the key assumptions are tested in interviews. Public sources used include, for example, SEC filings and Investment Adviser Public Disclosure records, IRS publications, IMF and World Bank macro series, OECD tax and wealth related statistics, and central bank releases on cross border investment and portfolio flows.
We also reviewed annual reports and investor presentations from advisory and wealth services groups, association publications, reputable financial press coverage, and academic and policy papers on UHNW wealth trends. Where helpful, paid subscriptions were used only for company financials and intelligence, news and financials screening, and patent databases to check supporting signals around digital tooling. This desk list is not exhaustive, and additional sources were also used for data collection, validation, and clarification.
Primary Interviews and Surveys
Primary work was used to confirm which fee lines are commonly charged, what is typically bundled versus billed separately, and how the service mix shifts by region and office structure. We spoke with senior decision makers and operating leaders across single and multi family offices, plus advisory partners and specialist service providers, and then used follow ups to resolve gaps from desk findings across major regions.
Distribution of primary research fieldwork respondents
| Company type | Respondent position | Region |
|---|---|---|
| Top tier: 33% | CXOs: 12% | APAC: 47% |
| Mid tier: 53% | Functional/Unit leaders: 29% | EMEA: 29% |
| Smaller Players: 14% | Managers: 59% | Americas: 24% |
Market-Sizing & Forecasting
Sizing starts with a top-down build where UHNW household counts and regional wealth pools are used to reconstruct the addressable demand for family office style services, followed by applying penetration and average annual fee yield assumptions by office type. To keep the output grounded, we compare it with selective bottom-up checks such as sampled fee schedules, a few provider revenue disclosures, and an ASP times client count approximation for typical multi family office models, which helps adjust totals if a single input looks overstated.
Key inputs used in the model include the number of UHNW households, investable assets trends, typical fee bands by service type, mix of discretionary versus advisory arrangements, and hiring and operating cost pressure that affects minimum ticket sizes. For forecasting, we run scenario analysis using base, conservative, and aggressive paths tied to wealth growth expectations, regulatory and tax shifts, and regional appetite for outsourcing. When bottom-up inputs are missing in a country, we bridge the gap using region-level fee bands and adoption ranges that were confirmed in interviews.
Data Validation & Update Cycle
Model outputs are triangulated against independent signals such as wealth growth rates, reported advisory revenue trends, and observed changes in family office counts by region, and then checked for currency and unit consistency. Outliers are reviewed by a second analyst, and if a variance cannot be explained by a clear assumption, respondents are re-contacted and the input is reworked.
Reports are refreshed annually, with interim updates made when material events affect the demand pool or fee economics. Before delivery, we complete a final pass so the market numbers reflect the latest available public indicators and interview feedback.
Mordor Intelligence's Global Family Offices Market Size Compared With Other Published Estimates
Published market values for family offices often vary because the scope line between advisory work, internal office operations, and adjacent wealth services is not drawn the same way, and the fee base can be treated differently across regions. Differences also come from how quickly assumptions are refreshed when macro conditions change.
The benchmark table shows a spread that is mainly explained by what is counted as market revenue, and in Mordor Intelligence's model the market is measured as yearly fee income from single, multi, and virtual family offices, expressed in constant 2024 US dollars, while excluding private bank desks and software only platforms.
Benchmark comparison
| Source | Market Size | Gaps in Research Methodology |
|---|---|---|
| Mordor Intelligence | USD 20.13 B (2025) | |
| Global Consultancy A | USD 27.20 B (2022) | Uses an earlier base year and typically bundles lifestyle, education, and broader family wealth support into the same revenue pool, which can lift the total when compared across years. |
| Trade Journal B | USD 20.39 B (2025) | Often relies on headline growth rates and a lighter set of checks on fee yield and adoption, and may use current dollar reporting that moves with short term currency and inflation effects. |
Taken together, the gap is not only about growth expectations, it is also about what gets included as fee income and how currency timing is handled. By keeping the steps traceable to UHNW demand indicators, fee bands, and interview validated adoption ranges, the final number stays easier to reproduce and explain.


Key Questions Answered in the Report
What is the current size and growth outlook for the family offices market?
The family offices market size is USD 21.47 billion in 2026 and is projected to reach USD 29.65 billion by 2031 at a 6.67% CAGR.
Which regions are leading and growing fastest in family offices?
North America holds the largest share at 47.67% in 2025, while the Middle East and Africa post the fastest growth with an 8.17% CAGR projected to 2031.
How are asset allocations changing within family offices?
Alternatives hold the largest allocation at 45.49% in 2025 and are projected to grow at a 7.34% CAGR, with private equity and private credit driving demand.
What structural model is gaining traction among UHNW families?
Multi-Family Offices are gaining with a 7.96% CAGR through 2031 as families below standalone thresholds seek scale benefits and co-invest access.
Which regulatory themes are most important for family offices through 2026?
CRS 2.0 and CARF expand reporting to crypto-assets and beneficial ownership, and enforcement intensity is rising, which increases compliance workloads.
How are talent and technology shaping operations for family offices?
Compensation for senior roles remains competitive, and cybersecurity remains top-of-mind, while data consolidation and institutional reporting standards are now core differentiators.
Page last updated on:


