
Market Overview
| Study Period | 2020 - 2031 |
|---|---|
| Market Size (2026) | USD 338.46 Billion |
| Market Size (2031) | USD 505.88 Billion |
| Growth Rate (2026 - 2031) | 8.37 % |
| Fastest Growing Market | Asia Pacific |
| Largest Market | Asia Pacific |
| Market Concentration | Medium |
Major Players *Disclaimer: Major Players sorted in no particular order Image © Mordor Intelligence. Reuse requires attribution under CC BY 4.0. | |
Factory Automation And Industrial Controls Market Analysis by Mordor Intelligence
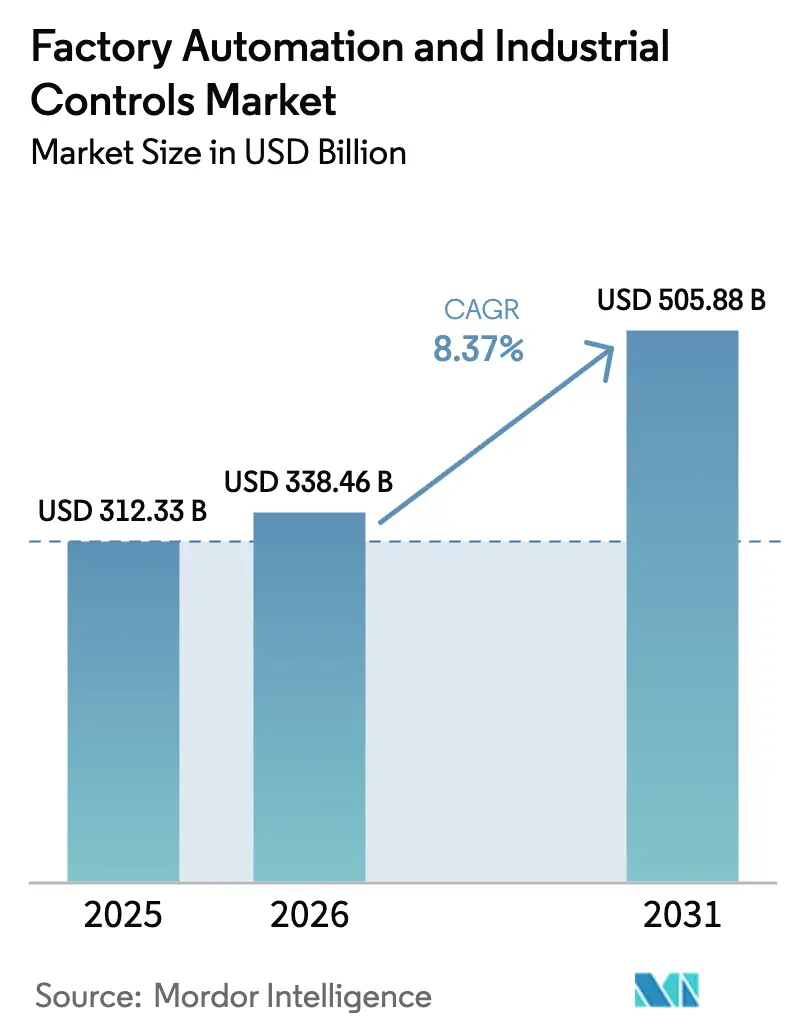
The Factory Automation And Industrial Controls Market size is expected to increase from USD 312.33 billion in 2025 to USD 338.46 billion in 2026 and reach USD 505.88 billion by 2031, growing at a CAGR of 8.37% over 2026-2031. Momentum is shifting from isolated task automation toward data-driven, cyber-physical production lines that enable real-time optimization and quicker product changeovers. Edge-based inference is expanding as the European Union and China mandate on-device artificial intelligence, lifting demand for high-performance controllers and deterministic networking. Labor shortages in Germany and Japan are accelerating investments in collaborative robots and vision systems, shortening historical replacement cycles. Meanwhile, strict energy-efficiency rules, escalating electricity prices, and dual-carbon commitments are compelling manufacturers to upgrade variable-frequency drives, IE4 motors, and intelligent power management platforms. Heightened cyber risks round out the growth equation, steering capital toward secure-by-design controllers that meet IEC 62443 guidelines.
Key Report Takeaways
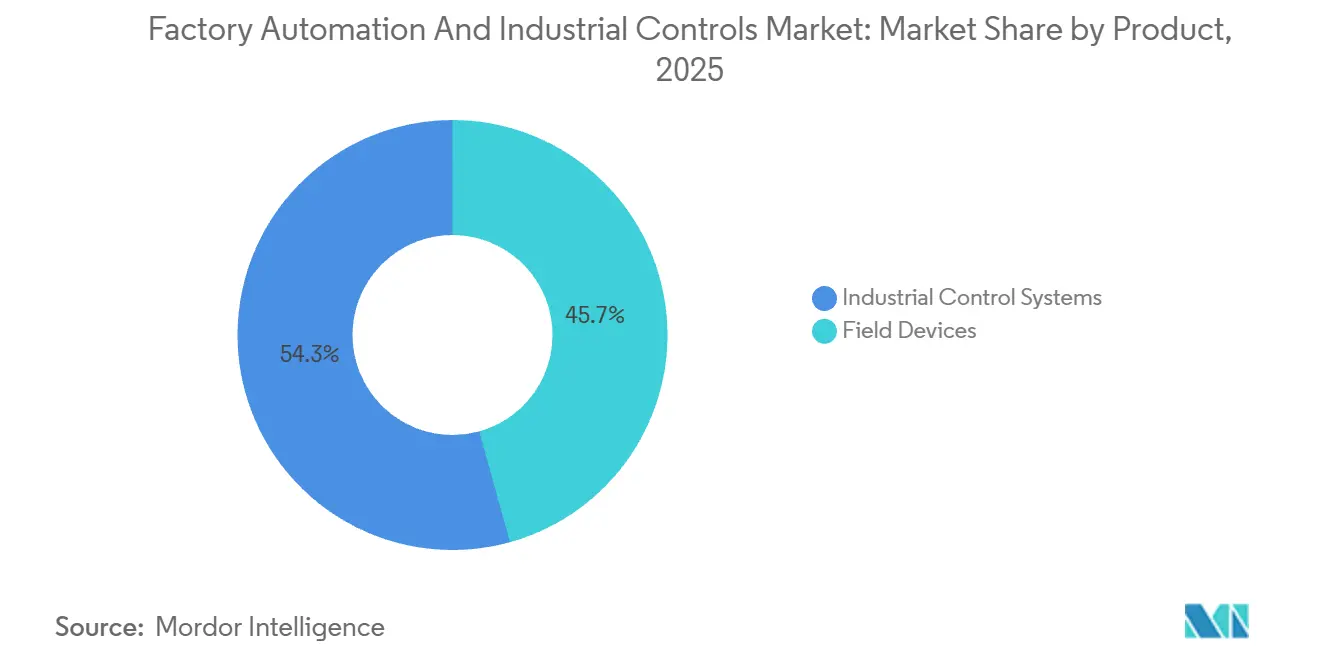
- By product category, industrial control systems held 54.31% of the factory automation and industrial controls market share in 2025, while field devices are forecast to expand at a 9.71% CAGR to 2031.
- By component, hardware accounted for 68.17% of the factory automation and industrial controls market in 2025, and software is advancing at a 10.93% CAGR through 2031.
- By end-user industry, automotive manufacturing led with 23.76% revenue share in 2025; pharmaceuticals are projected to record the highest CAGR at 9.43% through 2031.
- By control system architecture, proprietary ecosystems commanded a 49.54% share in 2025, whereas open and interoperable architectures are poised for a 10.21% CAGR to 2031.
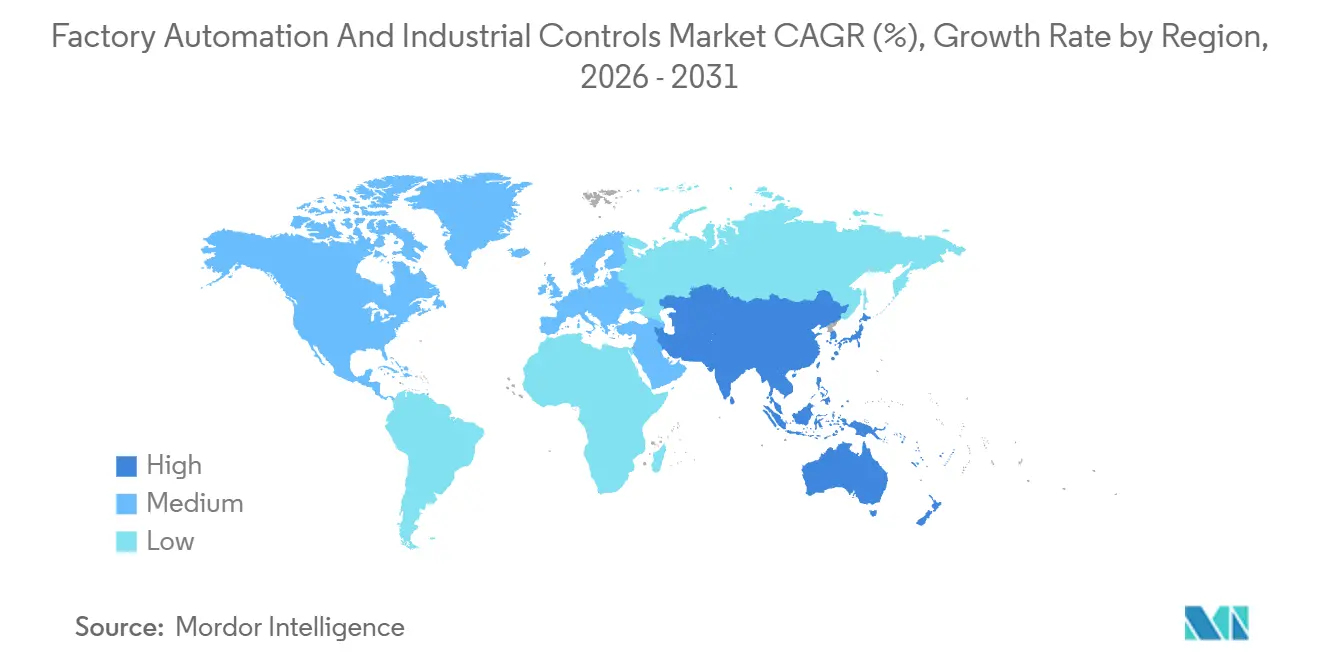
- By geography, Asia Pacific captured 37.68% share of the factory automation and industrial controls market in 2025 and is expected to grow at a 9.56% CAGR through 2031.
Note: Market size and forecast figures in this report are generated using Mordor Intelligence’s proprietary estimation framework, updated with the latest available data and insights as of January 2026.
Market Trends and Insights
Drivers Impact Analysis of Factory Automation And Industrial Controls Market*
| Driver | (~) % Impact on CAGR Forecast | Geographic Relevance | Impact Timeline |
|---|---|---|---|
| Industry 4.0 Adoption Acceleration | +2.1% | Germany, Japan, South Korea, United States | Medium term (2-4 years) |
| Energy-Efficiency Mandates and Cost Pressure | +1.4% | Europe, North America, China | Long term (≥ 4 years) |
| Rising Labor Shortages in Manufacturing | +1.8% | Japan, Germany, United States, Southeast Asia | Short term (≤ 2 years) |
| Government Stimulus for Digital Factories | +1.3% | China, India, Singapore, United States | Medium term (2-4 years) |
| Low-Code / No-Code Automation Platforms | +0.9% | North America, Western Europe | Short term (≤ 2 years) |
| AI-Driven Predictive Quality Control Upgrades | +1.2% | Germany, United States, China, India | Medium term (2-4 years) |
| Source: Mordor Intelligence | |||
Industry 4.0 Adoption Acceleration
Manufacturers are converting legacy “automation islands” into synchronized cyber-physical ecosystems that link machines, logistics, and quality loops in real time, yielding shorter changeovers and higher overall equipment effectiveness. Digital-twin deployments jumped to 68% of surveyed German plants in 2025, up from 41% two years earlier, with typical payback falling below 18 months. Japan budgeted JPY 120 billion (USD 800 million) in grants for small and midsized enterprises to install collaborative robots and IoT sensors, expanding automation beyond mega-plants. The emphasis on retrofit projects is stimulating demand for modular edge gateways, time-sensitive networking, and protocol-agnostic controllers capable of coexisting with 20-year-old equipment. As a result, capital spending is spreading across thousands of mid-tier facilities, cementing a broad, sustainable growth path for the factory automation and industrial controls market.
Energy-Efficiency Mandates and Cost Pressure
The European Union’s Ecodesign Regulation 2024/1781 and updated United States motor standards are pressing manufacturers to adopt IE4-IE5 motors, variable-frequency drives, and advanced power analytics, reducing electricity use by 15-25%. Average industrial power prices in Europe reached EUR 0.28 per kWh (USD 0.30 per kWh) in 2024, more than double pre-2022 levels, putting energy optimization at the center of board-level discussions.[1] Automation vendors are translating the regulations into commercial traction; Schneider Electric reported a 22% rise in EcoStruxure-enabled drives in 2025 as customers raced to certify plants under ISO 50001. The replacement wave is especially strong in energy-intensive segments such as chemicals and metals, lifting recurring software revenue tied to energy dashboards and AI-based load balancing. These factors add durable lift to the factory automation and industrial controls market.
Rising Labor Shortages in Manufacturing
Japan’s manufacturing workforce shrank by 1.2 million between 2019 and 2024, pushing the average factory-floor age to 47 years. German plants faced 320,000 unfilled jobs in 2024, mostly in machining and quality inspection roles. To sustain production, automotive suppliers grew collaborative-robot fleets by more than one-third in 2024, placing flexible cobots alongside human teams on tasks that demand dexterity but little oversight. Autonomous mobile robots, machine vision, and adaptive grippers that can migrate across lines are displacing fixed-path capital. The structural nature of labor shortages elevates the value proposition from cost reduction to business continuity, ensuring multiyear demand for field devices within the factory automation and industrial controls market.
Government Stimulus for Digital Factories
Capital subsidies are removing financial friction from automation projects. The United States CHIPS and Science Act earmarked USD 39 billion in grants and USD 75 billion in loan guarantees, contingent on real-time monitoring and predictive maintenance integration.[2] India disbursed INR 45 billion (USD 540 million) to pharmaceutical manufacturers installing automated bioreactors and continuous plants. China’s dual-circulation policy boosted domestic PLC shipments by 28% in 2024 as firms localized control technology. These programs reward measurable productivity gains, steering adopters toward software-defined architectures that can be upgraded over the air. Subsidies therefore act as both demand accelerator and technology roadmap catalyst, reinforcing long-term expansion of the factory automation and industrial controls market.
Restraints Impact Analysis of Factory Automation And Industrial Controls Market*
| Restraint | (~) % Impact on CAGR Forecast | Geographic Relevance | Impact Timeline |
|---|---|---|---|
| High Upfront CAPEX of Automation Projects | -1.6% | Global, especially South America, Africa, Southeast Asia | Short term (≤ 2 years) |
| Cyber-Security Vulnerabilities in OT Networks | -0.8% | North America, Europe, global critical infrastructure | Medium term (2-4 years) |
| Fragmented Interoperability Standards | -0.7% | Global, multi-vendor brownfield sites | Long term (≥ 4 years) |
| Semiconductor Supply Volatility for Controllers | -1.1% | Global, severe in automotive and electronics | Short term (≤ 2 years) |
| Source: Mordor Intelligence | |||
High Upfront CAPEX of Automation Projects
Integrated MES-SCADA deployments often require USD 2-8 million per site, with paybacks exceeding three years in thin-margin sectors such as food processing. Access to low-cost financing is uneven, particularly in South America and parts of Southeast Asia where interest rates remain above 12%. Although leasing and automation-as-a-service models promise lower entry hurdles, customers remain wary of data ownership and long lifecycle dependencies. ABB disclosed that subscription-based robotics accounted for only 9% of its 2025 robotics revenue, underscoring the early stage of alternative financing. Consequently, capital constraints could dampen near-term adoption across smaller manufacturers, trimming growth of the factory automation and industrial controls market.
Cyber-Security Vulnerabilities in OT Networks
Forty-seven vulnerability advisories targeted SCADA and HMI products in 2024, including flaws in popular platforms that enable remote code execution. A ransomware assault on a European chemical plant halted output for 11 days and cost EUR 35 million (USD 38 million) in damages. Uptake of zero-trust segmentation remains below one-third of manufacturers, keeping the attack surface wide. Compliance with IEC 62443 can add 8-12% to total project cost, elongating approval cycles. Until secure-by-design controllers and encrypted protocols become standard, cybersecurity anxieties will curb speed of adoption in critical infrastructure segments, tempering expansion of the factory automation and industrial controls market.
*Our forecasts treat driver/restraint impacts as directional, not additive. The impact forecasts reflect baseline growth, mix effects, and variable interactions.
Factory Automation And Industrial Controls Market Segment Analysis
By Product:
Field Devices Sustain Double-Digit ExpansionField devices are expected to be the fastest-growing product category over the forecast period and are set to expand at 9.71% through 2031, outpacing industrial control systems that held 54.31% of the factory automation and industrial controls market share in 2025. Robot installations reached 553,000 units in 2024, with automotive and electronics buyers taking 62% of shipments. Machine-vision revenue climbed 18% at Cognex during 2024 on the strength of AI-powered defect detection. These investments illustrate an industry pivot from programmable logic controllers toward intelligent endpoints that carry local analytics and 5G or IO-Link Wireless connectivity.
This transition reshapes value propositions. Controller differentiation now turns on ecosystem compatibility and software toolchains rather than scan-time benchmarks. Human-machine interfaces add augmented-reality overlays that cut batch changeovers by up to 30% in mid-volume lines. Hybrid control architectures mix deterministic PLC loops with cloud analytics, sidestepping full rip-and-replace costs. As older SCADA systems approach obsolescence, upgrade discussions increasingly center on seamless migration paths instead of pure hardware refresh, anchoring multi-cycle revenue for the factory automation and industrial controls market.
By Component:
Software Captures a Growing SliceHardware still represented 68.17% of revenue in 2025, yet software is projected to rise at a 10.93% clip, the highest among components. Subscription models now dominate rollouts, illustrated by Siemens, whose MindSphere and Xcelerator portfolios drove 16% software growth in 2025 while hardware rose only 4%. Emerson’s recurring software topped 22% of automation sales in 2024, delivering gross margins above 70%, versus the mid-30% range for hardware.
Low-code configuration tools such as EcoStruxure Automation Expert 2.0 reduce engineering hours by up to half, broadening user bases to process engineers and operations managers. Services revenue, long dominated by on-site commissioning, is shifting toward remote diagnostics and AI-assisted troubleshooting, which lowers travel costs and carbon footprints. Collectively, these dynamics deepen software’s pull-through effect on controllers and drives, reinforcing hybrid platform strategies across the factory automation and industrial controls market.
By End-User Industry:
Pharmaceuticals Pace the UpswingAutomotive lines maintained 23.76% of 2025 revenue, reflecting long-standing automation density. The pharmaceutical segment, however, is forecast to expand at 9.43% through 2031, buoyed by continuous bioprocessing, real-time release testing, and stringent FDA guidance on process analytical technology.[3] Eli Lilly allocated USD 4.5 billion in 2024 to a fully automated biologics campus that employs digital twins and inline chromatography to trim batch cycles by 40%.
Beyond life sciences, chemical complexes are layering advanced process control onto legacy distributed control systems to shave energy costs amid volatile natural-gas prices. Food-and-beverage processors deploy wash-down-rated robotics to meet traceability mandates, while semiconductor fabs demand vacuum-compatible motion systems with sub-micron accuracy. The spread of sector-specific templates and validated libraries allows vendors to reuse code across plants, curbing commissioning risk and amplifying addressable scope inside the factory automation and industrial controls market.


By Control System Architecture:
Open Standards Progress RapidlyProprietary architectures still accounted for 49.54% of revenue in 2025, yet open frameworks built on OPC Unified Architecture are slated for a 10.21% CAGR through 2031. The OPC Foundation certified more than 15,000 OPC UA server implementations by late 2024, a testament to rising multi-vendor integration. Volkswagen now mandates OPC UA compliance for all new production assets, driving ripple effects across tier-1 suppliers.
Hybrid arrangements that embed proprietary safety loops but expose non-time-critical data through open middleware balance determinism with flexibility. While integration overhead persists, the ability to deploy best-of-breed robots, sensors, and analytics outweighs the cost for most greenfield projects. Accordingly, ecosystem alignment rather than hardware speeds will determine winners in the factory automation and industrial controls market.
Geography Analysis
APAC Factory Automation and Industrial Controls Market
Asia Pacific accounted for 37.68% of the factory automation and industrial controls market in 2025 and is projected to post a 9.56% CAGR through 2031, underscoring its dual role as a manufacturing hub and policy engine. China’s dual-circulation push triggered a 28% rise in domestic PLC and drive shipments in 2024 as producers localized supply chains. India disbursed INR 120 billion (USD 1.44 billion) in production-linked incentives for electronics, pharmaceuticals, and auto components, subject to minimum automation thresholds. Japan granted JPY 120 billion (USD 800 million) to small and mid-sized enterprises to support robot adoption, extending automation beyond the automotive nucleus. South Korea sponsored 3,200 smart-factory projects in 2024, spanning semiconductor, display, and battery facilities.
North America and Europe Factory Automation and Industrial Controls Market
North America remains pivotal despite slower growth, powered by federal incentives that tether funding to Industry 4.0 practices. The CHIPS Act’s USD 39 billion grant pool obliges real-time monitoring and predictive maintenance in new fabs. Mexico and Canada are benefiting via near-shoring, funneling orders to motion-control suppliers. Europe commands mature penetration yet maintains leadership in digital twins and energy-efficient retrofits; 68% of surveyed German plants had adopted at least one digital-twin application by 2025. High power prices propel upgrades to IE5 motors and drives, reinforcing refresh velocity.
MEA and South America Factory Automation and Industrial Controls Market
South America, the Middle East, and Africa collectively trail in spending but register strong point projects tied to extractive industries. Brazil’s Petrobras earmarked USD 2.1 billion for digital oilfield platforms in 2024, including autonomous drilling and SCADA upgrades. Gulf refineries adopt advanced process control to meet energy-intensity targets, while South African miners deploy wireless sensor networks to improve asset uptime. Although volumes are smaller, the installed base is younger, providing an opening for open-standard architectures and cloud-native analytics to leapfrog legacy solutions. Collectively, geographic diversification underpins a resilient trajectory for the factory automation and industrial controls market.
Regulatory Landscape
Regulation and standards are tightening around machine safety, cybersecurity, and energy efficiency, directly shaping controller, drive, and software specifications. In the European Union, the Machinery Regulation (EU) 2023/1230 updates essential health and safety requirements and adds explicit provisions relevant to AI-enabled machinery and cybersecurity, with application from January 20, 2027; Member States must also notify the European Commission of penalty rules by October 2026, which increases compliance urgency for OEMs and integrators selling into Europe.
For cybersecurity governance in industrial automation and control systems, ISA/IEC 62443 remains a primary reference for secure-by-design practices, while NIST continues to formalize OT security guidance for manufacturing operators and solution providers. Notably, NIST published IR 8183 Rev. 2 (Cybersecurity Framework 2.0 Manufacturing Profile) in September 2025, and released the initial public draft of SP 1800-41 in May 2026 focused on response and recovery in ICS environments, reinforcing the shift toward auditable risk management across OT networks.
Value Chain Analysis
The value chain spans component suppliers (semiconductors, power modules, sensors), automation OEMs (PLCs, DCS/SCADA, drives, robotics, vision), software and platform providers (MES, HMI, industrial data and AI layers), system integrators/engineering firms, and distribution and lifecycle services (commissioning, upgrades, remote support). Semiconductor availability and allocation behavior remains a key upstream constraint for controller and drive hardware, with reported lead-time extension for certain PLC module microcontroller families from roughly 8-12 weeks to 20-26 weeks in early 2026 and higher minimum order quantities for some power components, pushing OEMs toward multi-sourcing, redesigns, and longer planning cycles.
Downstream, the value chain is broadening as connectivity and AI infrastructure providers embed deeper into factory architectures. Examples in 2026 include T-Systems operationalizing an Industrial AI Cloud facility in Munich with large-scale GPU compute for industrial workloads, alongside telecom-led initiatives such as AI-RAN and physical AI trials (for robotics operations and shipyard automation) that pair low-latency connectivity with automation deployment services; these moves expand the ecosystem around industrial controls beyond traditional automation vendors and integrators.
Competitive Landscape
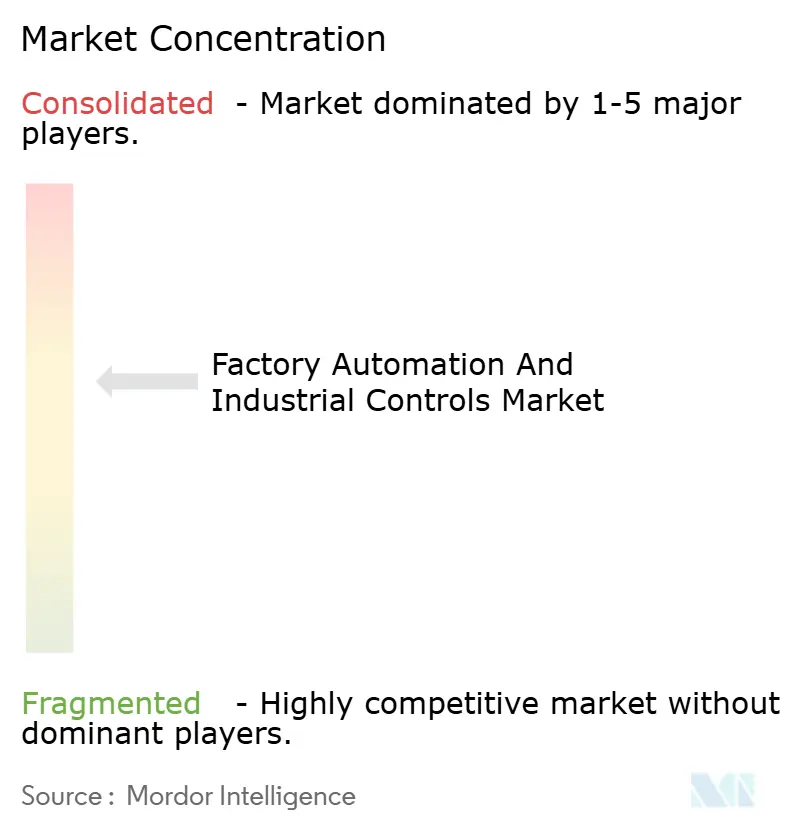
The factory automation and industrial controls market is moderately concentrated; the top ten suppliers account for roughly 55-60% of global revenue. No company exceeds 12% share, reflecting the domain’s sweep across discrete and process industries, hardware, software, and services. Siemens, ABB, Rockwell Automation, and Schneider Electric are leveraging installed bases to pivot toward high-margin software, even as Chinese peers such as Hollysys and Delta Electronics offer comparable PLCs at 30-40% lower prices. Emerson’s USD 8.2 billion acquisition of NI in 2024 tied laboratory test to plant-floor optimization, illustrating vertical integration into data and AI layers.
Younger entrants challenge incumbents with API-first platforms. Beckhoff’s PC-based controllers run on x86 processors under real-time Linux, winning orders in packaging cells that value computational headroom over proprietary chipsets. Certification of 1,200-plus OPC UA products lowers switching costs and boosts multi-vendor ecosystems.[4] Patent filings underscore the shift toward software; Siemens registered 87 AI-related automation patents in 2024, compared with 52 security-focused filings at Rockwell Automation.
Strategic differentiation now tilts to breadth of ecosystem, cloud partnerships, and domain templates rather than sheer hardware performance. Vendors that fail to supply end-to-end lifecycle solutions risk relegation to component suppliers. Conversely, firms able to unite edge devices, AI, cybersecurity, and lifecycle services are best positioned to command premium pricing and sticky recurring revenue inside the factory automation and industrial controls market.
Factory Automation And Industrial Controls Industry Leaders
-
ABB Limited
-
Siemens AG
-
Rockwell Automation Inc.
-
Schneider Electric SE
-
Mitsubishi Electric Corp.
- *Disclaimer: Major Players sorted in no particular order
Factory Automation And Industrial Controls Market Companies Covered in this Report
- ABB Ltd
- Siemens AG
- Rockwell Automation Inc.
- Schneider Electric SE
- Mitsubishi Electric Corporation
- Honeywell International Inc.
- Emerson Electric Co.
- Omron Corporation
- Yokogawa Electric Corporation
- GE Vernova Inc.
- Texas Instruments Inc.
- Bosch Rexroth AG
- Fanuc Corporation
- Keyence Corporation
- Advantech Co. Ltd.
- Beckhoff Automation GmbH
- Delta Electronics Inc.
- Lenze SE
- WAGO Kontakttechnik GmbH
- Hollysys Automation Technologies
Read Analysis of Factory Automation And Industrial Controls Companies
Market Opportunities and Future Outlook
A primary whitespace is the migration from isolated automation projects to interoperable, software-defined architectures anchored in deterministic networking and portable control logic, which reduces single-vendor lock-in and simplifies brownfield modernization. The publication of IEC/IEEE 60802-2026 in June 2026 (Time-Sensitive Networking profiles for industrial automation) provides a concrete interoperability anchor for multi-vendor, time-critical industrial Ethernet designs, supporting deployments where synchronized motion, vision, and safety-adjacent data flows require predictable latency.
Heavy-industry capacity additions and modernization programs create immediate pull-through for industrial controls, electrified drives, safety systems, and plant software across greenfield and retrofit scopes. In India, publicized steel and metals investments in 2026 (including JSW Steel beginning construction on an integrated steel plant in Andhra Pradesh using EAF technology, and Tata Steel outlining FY2027 capex focused on expansion and technology adoption) expand the addressable base for DCS/PLC, drives, and energy-management software, while discrete projects such as Kalyani Ispat contracting SMS Group for a high-speed bar and wire rod mill (ordered in February 2026) illustrate how equipment packages increasingly bundle advanced automation, instrumentation, and quality control toolchains.
Recent Industry Developments in Factory Automation And Industrial Controls Market
- June 2026: Schneider Electric entered a definitive agreement to acquire Cognite Holding B.V. for USD 3.1 billion, strengthening its industrial data and AI stack alongside AVEVA and EcoStruxure portfolios. The transaction aligns plant-floor automation with contextualized data operations, supporting use cases such as predictive maintenance and digital twins across process and discrete industries.
- December 2025: Siemens announced a EUR 1.2 billion expansion of its Amberg Electronics Plant to increase output of edge controllers and industrial PCs, with a stated goal of reducing lead times by 30% by 2027. Additional capacity at a flagship automation manufacturing site supports faster delivery for OEMs and integrators facing tighter project schedules and controller availability constraints.
- October 2024: Rockwell Automation and Microsoft formed a partnership to connect FactoryTalk with Azure AI to scale analytics and AI-enabled manufacturing applications. The collaboration deepens IT/OT integration pathways for customers standardizing on cloud-based data platforms while retaining deterministic control at the edge.
Factory Automation And Industrial Controls Market Report Scope and Research Methodology
Market Definition and Coverage
This market covers the revenues earned from automation and industrial control hardware, software, and services used to sense, control, monitor, and optimize factory and process operations across industries.
Scope exclusions: Standalone enterprise IT platforms, non-industrial building automation, and aftermarket repair parts are excluded.
Segments Covered in This Report
- By Product
- Industrial Control Systems
- Distributed Control System (DCS)
- Programmable Logic Controller (PLC)
- Supervisory Control and Data Acquisition (SCADA)
- Product Lifecycle Management (PLM)
- Human-Machine Interface (HMI)
- Manufacturing Execution System (MES)
- Enterprise Resource Planning (ERP)
- Other Industrial Control Systems
- Field Devices
- Machine Vision Systems
- Industrial Robotics
- Sensors and Transmitters
- Motors and Drives
- Other Field Devices
- Industrial Control Systems
- By Component
- Hardware
- Software
- Services
- By End-User Industry
- Automotive
- Chemical and Petrochemical
- Utility
- Pharmaceutical
- Food and Beverage
- Oil and Gas
- Electronics and Semiconductor
- Aerospace and Defense
- Other End-User Industries
- By Control System Architecture
- Proprietary / Vendor-Specific
- Open / Interoperable
- Hybrid Architecture
- By Geography
- North America
- United States
- Canada
- Mexico
- South America
- Brazil
- Rest of South America
- Europe
- Germany
- United Kingdom
- France
- Italy
- Spain
- Nordics
- Rest of Europe
- Middle East
- Saudi Arabia
- United Arab Emirates
- Rest of Middle East
- Africa
- South Africa
- Nigeria
- Rest of Africa
- Asia-Pacific
- China
- Japan
- South Korea
- India
- Singapore
- Australia
- Rest of Asia-Pacific
- North America
Data Sources, Market Sizing, and Validation
Desk Research
Desk research was used to set the boundaries of what is counted and to build the first set of demand and supply indicators by region. We relied on public sources such as national industrial production and manufacturing output series (for example, from the World Bank and national statistics offices), trade and tariff data (such as UN Comtrade), and standardization and safety references (such as IEC publications) to understand adoption requirements.
We also reviewed association and policy material that tracks factory digitization and automation readiness, along with company annual reports, investor presentations, and credible press coverage that discusses order trends and capital spending cycles. Where needed, paid subscriptions were used for company financials and intelligence, news and financials, and patent databases to confirm product exposure, product launch cadence, and IP direction. The desk sources listed here are illustrative, and many other public references were also used to collect data, validate figures, and clarify gaps.
Primary Interviews and Surveys
Primary discussions were used to pressure-test the model assumptions that are hard to observe in public data, especially pricing, replacement cycles, and the split between discrete and process automation demand. We spoke with stakeholders across suppliers, system integrators, distributors, and large end users, then checked that assumptions stayed consistent across APAC, EMEA, and the Americas before finalizing the totals.
Distribution of primary research fieldwork respondents
| Company type | Respondent position | Region |
|---|---|---|
| Top tier: 28% | CXOs: 15% | APAC: 46% |
| Mid tier: 57% | Functional/Unit leaders: 41% | EMEA: 32% |
| Smaller Players: 15% | Managers: 44% | Americas: 22% |
Market-Sizing & Forecasting
Sizing starts with a top-down build that reconstructs the addressable spend from manufacturing output and capex intensity by region, then allocates that spend across core automation and control categories based on adoption patterns seen in interviews. To keep totals realistic, selective bottom-up checks are used, such as sampled ASP x shipment volume for key devices and supplier revenue exposure roll-ups, which are then used to adjust outliers.
Inputs that mattered most included manufacturing production index trends, industrial electricity and energy-efficiency investment signals, automation penetration in major end-user industries, average refresh cycles for controls and drives, and pricing progression for software and services bundles. When a variable was not available at a consistent country level, we used region-level proxies and validated the direction with channel feedback, then documented the assumption before it entered the model.
For forecasting, scenario analysis was applied because the market is closely tied to factory capex cycles and policy-driven efficiency upgrades, which can shift quickly. Scenarios were anchored on consensus views from industry practitioners on automation backlog, expected commissioning pace, and the timing of production expansions.
Data Validation & Update Cycle
Outputs were checked against independent signals such as industrial production growth, trade movement for automation-related equipment, and disclosed order commentary in public filings, followed by a review of any major variances at the region and category level. When the model showed unusual jumps, we revisited the underlying adoption or pricing assumption and re-contacted experts if the reason was not clear.
A multi-step internal review is completed before sign-off so the logic, math, and scope interpretation stay consistent across the report. The report is refreshed annually, and interim updates are made when there are material events that can shift demand or pricing. Before delivery, the analyst team performs a final pass to ensure clients receive the latest updated view.
Mordor Intelligence's Global Factory Automation and Industrial Controls Market Market Sizing Compared With Other Published Estimates
Published market sizes for factory automation and industrial controls often differ because firms do not always count the same spend pools, and some include adjacent enterprise software layers or exclude services tied to commissioning and lifecycle support. Differences also show up when pricing is treated as flat versus being updated for software mix changes and service attach rates.
Import and export signals for automation equipment, together with disclosed order momentum in automation product lines, are used as external checks that keep Mordor Intelligence's estimate aligned to factory-floor control and automation revenue rather than broader digital transformation budgets.
Benchmark comparison
| Source | Market Size | Gaps in Research Methodology |
|---|---|---|
| Mordor Intelligence | USD 312.33 B (2025) | |
| Global Consultancy A | USD 180.72 B (2025) | Uses a narrower component basket in its definition and appears to undercount software and service revenues that are bundled with controls and automation deployments in many projects. |
| Industry Publisher B | USD 152.33 B (2025) | Mixes factory automation with select enterprise layers and then applies a smaller addressed manufacturing spend pool, which can compress the market value versus a floor-level automation and controls scope. |
The spread mainly comes from what is included around the core control stack and how services and software are treated in value capture. By keeping inclusions tied to observable deployment and revenue signals and then validating the result with independent indicators, the final number stays traceable to clear steps that can be repeated year to year.
Key Questions Answered in the Report
What is the projected value of the factory automation and industrial controls market in 2031?
The market is expected to reach USD 505.88 billion by 2031, growing at an 8.37% CAGR.
Which region is forecast to grow fastest to 2031?
Asia Pacific is set to expand at a 9.56% CAGR, driven by policy incentives in China, India, and Japan.
Which product segment will outpace others over the forecast period?
Field devices, including robots and machine-vision systems, are projected to rise at 9.71% per year through 2031.
Why are pharmaceuticals adopting automation faster than other industries?
Continuous manufacturing mandates, real-time release testing, and stringent FDA guidance are boosting automation in drug production, resulting in a 9.43% CAGR.
How are energy-efficiency regulations influencing market growth?
Rules such as Ecodesign 2024/1781 and U.S. motor standards push upgrades to IE4-IE5 motors and intelligent drives, lowering energy use by up to 25% and accelerating replacement cycles.
What cybersecurity challenges affect adoption of industrial controls?
Increasing ransomware and SCADA vulnerabilities add 8-12% to project costs and lengthen approval timelines, making secure-by-design controllers essential.