
Market Overview
| Study Period | 2020 - 2031 |
|---|---|
| Market Size (2026) | USD 374.92 Billion |
| Market Size (2031) | USD 465.59 Billion |
| Growth Rate (2026 - 2031) | 4.42 % |
| Fastest Growing Market | Asia-Pacific |
| Largest Market | Asia-Pacific |
| Market Concentration | Low |
Major Players *Disclaimer: Major Players sorted in no particular order Image © Mordor Intelligence. Reuse requires attribution under CC BY 4.0. | |
Fabricated Metal Products Market Analysis by Mordor Intelligence
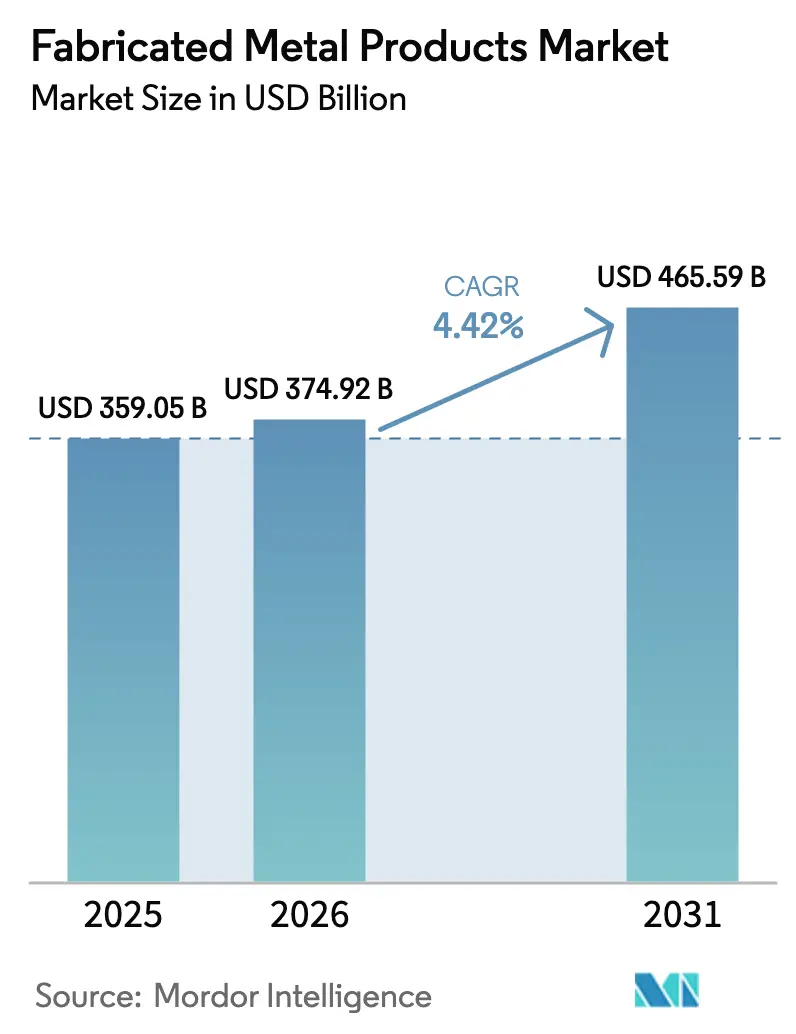
The Fabricated Metal Products Market size was valued at USD 359.05 billion in 2025 and estimated to grow from USD 374.92 billion in 2026 to reach USD 465.59 billion by 2031, at a CAGR of 4.42% during the forecast period (2026-2031). Reshoring of manufacturing to high-cost economies, incentives tied to the U.S. Inflation Reduction Act, and China’s ultra-high-voltage grid build-out are the principal forces sustaining this expansion. Corporate buyers are prioritizing lead-time certainty over pure labor arbitrage, which redirects capital expenditure toward domestic or near-shore fabrication capacity. Lightweighting trends in transportation, paired with an intensified pipeline of renewable-energy projects, are widening the application base for precision-engineered components, allowing the fabricated metal products market to monetize value-added design, machining, and finishing expertise. Competitive behavior remains shaped by a mix of regional customer-proximity requirements and step-change technology investments in automation, digital twins, and additive manufacturing, all of which elevate the productivity ceiling and compress delivery cycles for custom parts.
Key Report Takeaways
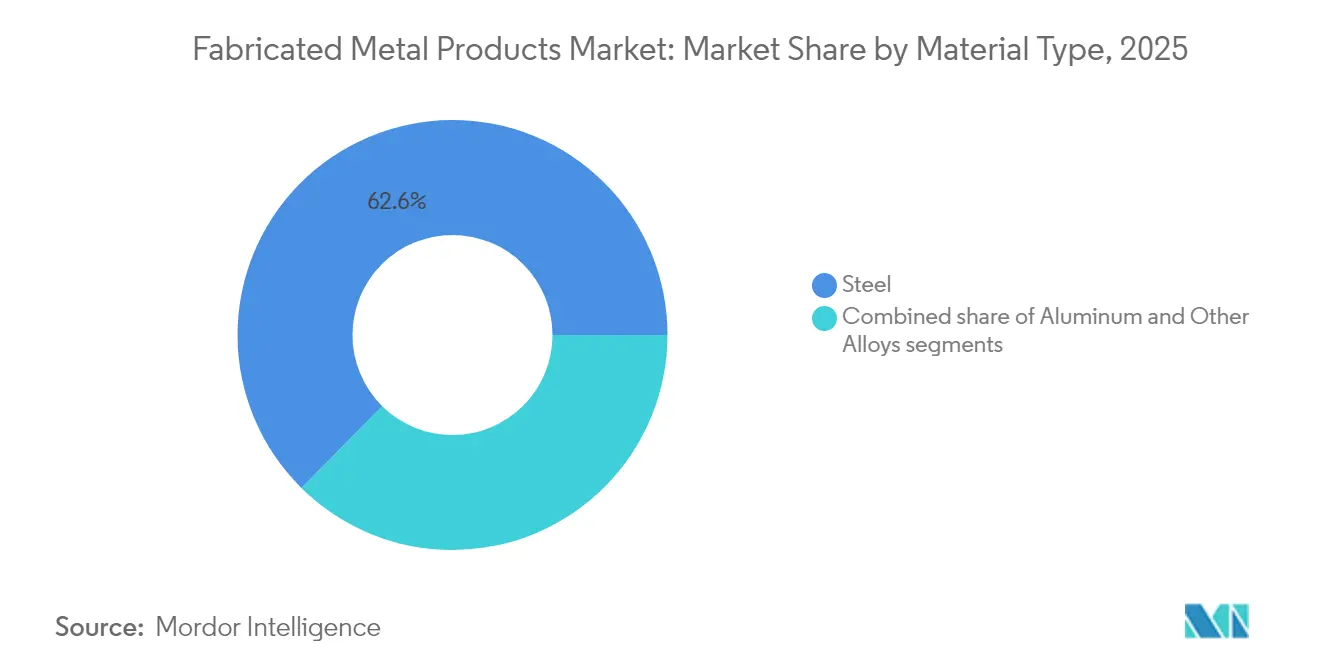
- By material type, steel dominated with 62.60% of fabricated metal products market share in 2025, whereas aluminum is projected to expand at a 5.66% CAGR through 2031.
- By fabrication process, machining commanded a 41.85% share of the fabricated metal products market size in 2025, while additive manufacturing and stamping are advancing at a 6.62% CAGR to 2031.
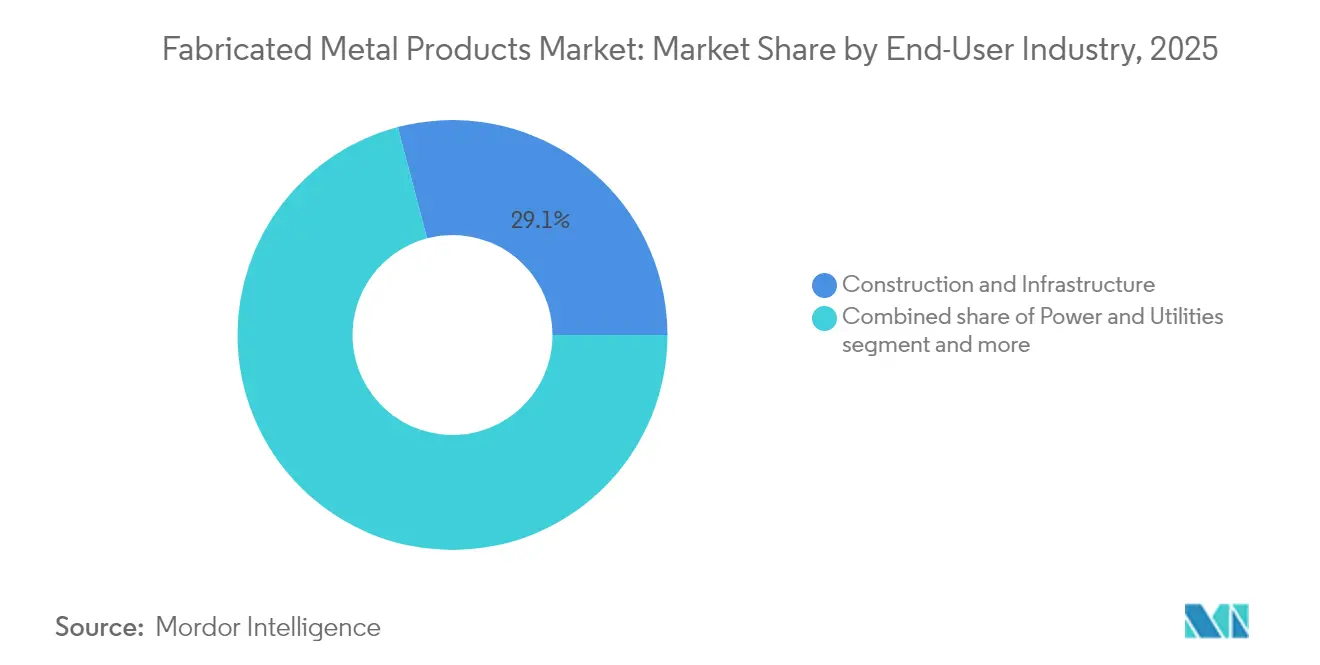
- By end-user industry, construction and infrastructure led with 29.10% revenue share in 2025; the power and utilities segment is forecast to grow at 6.12% CAGR through 2031.
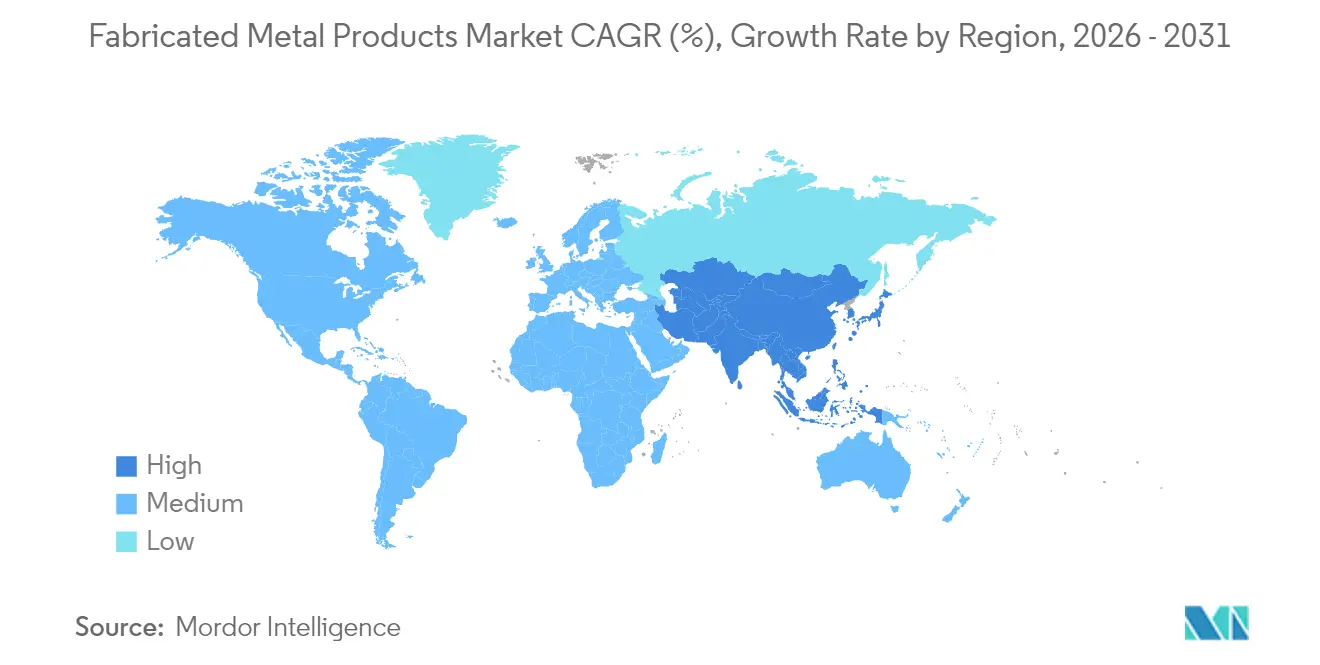
- By geography, Asia-Pacific captured 48.35% of the fabricated metal products market share in 2025 and is poised to post the fastest 4.71% CAGR during the outlook period.
Note: Market size and forecast figures in this report are generated using Mordor Intelligence’s proprietary estimation framework, updated with the latest available data and insights as of 2026.
Market Trends and Insights
Drivers Impact Analysis of Fabricated Metal Products Market*
| Drivers | (~) % Impact on CAGR Forecast | Geographic Relevance | Impact Timeline |
|---|---|---|---|
| Surge in demand from construction sector for structural components | +1.2% | Global, with strongest impact in Asia-Pacific and North America | Medium term (2-4 years) |
| Growth in renewable-energy installations requiring fabricated metal parts | +0.9% | Global, concentrated in APAC, North America, Europe | Long term (≥ 4 years) |
| Resurgence of manufacturing activity & reshoring initiatives | +0.8% | North America & EU, spillover to Mexico | Short term (≤ 2 years) |
| Technological advances in CNC & additive manufacturing | +0.6% | Global, early adoption in North America and Europe | Medium term (2-4 years) |
| Adoption of digital twins enabling design-to-fab integration in SMEs | +0.4% | North America & EU, gradual APAC adoption | Long term (≥ 4 years) |
| Rising use of modular prefabricated data-center skids | +0.3% | Global, concentrated in North America and Asia-Pacific | Short term (≤ 2 years) |
| Source: Mordor Intelligence | |||
Surge in Demand from the Construction Sector for Structural Components
Precision-engineered structural steel, architectural metalwork, and modular building elements keep the construction sector the single largest off-take channel for the fabricated metal products market. Infrastructure stimulus in the United States, India, and Indonesia is synchronizing with urbanization in Southeast Asia, lifting order backlogs for beams, trusses, and cold-formed sections. Contractors are shortening project cycles, prompting higher reliance on prefabricated assemblies that arrive ready for bolt-up, thereby raising fabrication complexity and margins. Strict seismic and energy-efficiency codes mandate tighter tolerances and certified weld procedures, which play to the strengths of technologically sophisticated shops able to validate quality with non-destructive testing. Although construction spending can be cyclical, demographic pressures for housing and transport renewal underpin a multi-year demand runway that offsets intermittent slowdowns.
Growth in Renewable-Energy Installations Requiring Fabricated Metal Parts
Wind, solar, and grid-reinforcement projects accelerate the need for precision tower sections, racking systems, and copper-intensive electrical hardware. The International Energy Agency expects solar additions to top 60% of new global renewable capacity in 2025, and each megawatt of photovoltaic capacity anchors roughly 5.5 tons of copper conductors. China’s State Grid tender for 1.757 million tons of steel lattice towers in 2025 dwarfs the previous year’s 460,000 tons, translating into continuous throughput for heavy-section beam and angle-line fabrication shops. Offshore wind construction depends on XL monopiles and nacelle housings that must absorb extreme dynamic loads, rewarding fabricators proficient at multi-pass submerged-arc welding. Battery-energy-storage sites further widen the scope, calling for thermally managed enclosures built from aluminum sheet and stainless structural members[1].
Resurgence of Manufacturing Activity & Reshoring Initiatives
Reshoring is structurally lifting domestic order books as original-equipment manufacturers calculate the total cost of ownership, inclusive of logistics risk, tariff exposure, and working capital tied up in maritime transit. Between 2010 and 2023, 1.898 million cumulative jobs were announced for U.S. returns, accompanied by USD 234 billion annual manufacturing construction outlays as of May 2024. Equipment-heavy projects, such as Sumitomo Drive Technologies’ USD 22 million robotic welding line, showcase how automation neutralizes local wage differentials while trimming lead times. Federal legislation like the CHIPS and Science Act offers tax credits on capital goods, catalyzing incremental demand for fabricated semiconductor-tool frames, clean-room enclosures, and utility skids. Spillover effects reach Mexican border states, where maquiladoras absorb logistics-sensitive sub-assemblies for next-day delivery to U.S. integrators[2].
Technological Advances in CNC & Additive Manufacturing
Advances in conversational CNC controls, tool-path automation, and real-time spindle monitoring are compressing setup times and reducing scrap, thereby improving capacity utilization. Plasma gas atomization now produces titanium powders at up to 1,500 kg/h, cutting additive raw-material costs and clearing a path for aerospace-grade 3D-printed brackets and manifolds. Alloy Enterprises’ Stack Forging shortens prototype-to-production cycles to four weeks for aluminum heat-sinks, illuminating how new build-process paradigms democratize complex geometry creation. Metal printers integrated with in-situ inspection close the feedback loop, ensuring dimensional accuracy before parts leave the chamber. Mid-tier shops increasingly access these capabilities via service-bureau partnerships or equipment leasing, bypassing the high capital hurdle while testing market appetite for printed parts.
Restraints Impact Analysis of Fabricated Metal Products Market*
| Restraints | (~) % Impact on CAGR Forecast | Geographic Relevance | Impact Timeline |
|---|---|---|---|
| Volatility in steel & aluminum prices | -0.7% | Global, most severe in import-dependent regions | Short term (≤ 2 years) |
| Skilled-welder shortage amid retirement cliff | -0.6% | North America & EU, emerging in developed APAC | Long term (≥ 4 years) |
| High CAPEX for advanced fabrication equipment | -0.5% | Global, particularly challenging for SMEs | Medium term (2-4 years) |
| Scope-3 emissions reporting pressure on fabricators | -0.3% | EU and North America, expanding to APAC | Medium term (2-4 years) |
| Source: Mordor Intelligence | |||
Volatility in Steel & Aluminum Prices
Hot-rolled coil hovered in the USD 700s per ton through late 2024, propped up by Chinese stimulus yet capped by slack Western demand and bloated service-center inventories. The U.S. antidumping duty on aluminum extrusions from 14 jurisdictions removed 400,000 tons of imports, amplifying domestic price swings and squeezing job-shop margins. While larger fabricators employ futures hedges or cost-plus contracts to mute volatility, small and medium enterprises struggle to pass surcharges through, delaying acceptance of long-term purchase orders. Project owners, wary of budget overruns, sometimes postpone steel-intensive builds, producing uneven utilization rates across the fabricated metal products market. Digital procurement platforms and transparent indexation mechanisms ease, not erase, input uncertainty, leaving price gyrations as a persistent constraint.
Skilled-Welder Shortage Amid Retirement Cliff
Roughly 21.4% of the current welder workforce in the United States is at least 55 years old, and the American Welding Society foresees an annual shortage of 90,000 hands through 2027. Miller Fabrication Solutions revived its four-week internal academy in 2024, graduating 11 workers after a COVID-era pause, but aggregate throughput lags demographic attrition. Vocational pipelines cannot scale fast enough, fueling wage inflation as small shops sweeten benefit packages to keep headcount. Robotic welding cells, once the domain of Tier-1 automotive suppliers, have migrated to medium-volume structural shops; however, integration demands capital and programming expertise that many operators lack. The labor imbalance nudges the fabricated metal products market toward platform technologies that simplify teach-pendant tasks and enable a single technician to oversee multiple cobot stations[3].
*Our forecasts treat driver/restraint impacts as directional, not additive. The impact forecasts reflect baseline growth, mix effects, and variable interactions.
Fabricated Metal Products Market Segment Analysis
By Material Type:
Lightweight Metals Re-shape the MixSteel held 62.60% of the fabricated metal products market share in 2025, underpinned by its low cost-to-strength ratio for automotive frames, I-beams, and heavy machinery housings. Yet aluminum revenues are climbing at a 5.66% CAGR, positioning the lighter metal as the quickest-expanding contributor to the fabricated metal products market size over the outlook. Demand stems from electric-vehicle chassis, aerospace fuselage panels, and photovoltaic racking, where weight savings translate into fuel economy or easier field installation. Plasma-based powder atomization lowered titanium input prices, opening turbine and medical-implant niches, while copper volumes surge alongside high-ampere renewable circuits. Environmental scorecards guide buyers toward stainless alloys boasting 95% recycled content and 1.52 kg CO2e per kg footprints, tightening the link between material choice and Scope-3 pledges.
Downstream, alloy substitution strategies respond to commodity price gyrations and seismic code revisions. Steel producers ramp electric-arc-furnace capacity to widen scrap recycling loops, whereas extruders court solar OEMs with corrosion-resistant 6000-series profiles. Separate from cost calculus, titanium’s biocompatibility and high specific strength unlock orthopedic implant and space-qualified applications that command premium margins. Copper’s conductive superiority keeps it indispensable for EV busbars and inverter heat-sinks despite price spikes, pushing fabricators to optimize yield through nesting algorithms and remelt partnerships. Life-cycle assessment tools embedded in digital twins let engineers simulate carbon intensity at the quotation stage, helping the fabricated metal products market transform sustainability compliance into a sales lever.

By Fabrication Process:
Automation Elevates Legacy TechniquesMachining represented 41.85% of the fabricated metal products market size in 2025, buoyed by multi-axis CNC mills and lathes that hit micron-level tolerances for aerospace fixtures and semiconductor tooling. Additive manufacturing combined with progressive stamping, grouped under “Others,” is racing ahead at 6.62% CAGR, proving the agility of near-net-shape printing for intricate ducts and topology-optimized brackets. High-speed machining centers integrated with tool-condition monitoring slash cycle times and extend insert life, enabling a single operator to supervise multiple spindles. Servo presses in stamping lines fine-tune stroke profiles, lessening spring-back in advanced high-strength steel parts and cutting rework.
Casting and forging remain vital for heavy-section engine blocks and gear blanks, but cede prototype work to binder-jet and directed-energy-deposition platforms that iterate designs without tooling cost. Robotic welding bridges the skills gap by automating multi-pass joints, especially in subsea and pressure-vessel fabrication. Meanwhile, laser tube-cutting cells pair with bending robots to produce modular frame kits in one continuous flow, shrinking work-in-progress inventory. Consolidators such as Nano Dimension’s USD 115 million swoop on Markforged and subsequent Desktop Metal tie-up illustrate how capital marshaled through mergers acquires intellectual property, broadens powder portfolios, and cross-sells hybrid print-and-machine workflows.
By End-user Industry:
Energy Transition Re-orders PrioritiesConstruction and infrastructure retained the heaviest weighting at 29.10% of the fabricated metal products market size in 2025 on the back of road, rail, and public-building programs. Yet the power and utilities domain is set to post a 6.12% CAGR, propelled by wind-tower flanges, solar trackers, and grid-stiffening hardware. High-temperature hydrogen pipelines, battery-energy-storage cabinets, and substation bus frameworks all lean on code-compliant welds and corrosion-resistant alloys. Manufacturing, automotive, and aerospace sustain baseline demand through capacity expansions; electric-vehicle platforms shift bill-of-materials toward aluminum extrusions and battery enclosures, tightening collaboration with multi-process job shops.
Oil and gas still commission wellhead skids, pressure vessels, and LNG modules, though long-term share inches downward under decarbonization agendas. Data-center developers procure prefab power-distribution skids and hot-aisle containment, rewarding fabricators versed in tight-tolerance stainless panel bending and powder-coating. Across segments, digitized order portals and real-time shop-floor dashboards let buyers track cut-list progress and material certifications, improving transparency and trust between OEMs and the fabricated metal products market.
Geography Analysis
APAC Fabricated Metal Products Market
Asia-Pacific’s 48.35% stake in the fabricated metal products market share during 2025 aligns with its role as both a manufacturing powerhouse and an infrastructure build-site. China’s 1.757 million tons UHV tower tender anchors mill output, while India’s Smart Cities Mission funds multi-modal terminals, metro rails, and flyovers that demand high tonnage of rolled and welded sections. Southeast Asian countries like Vietnam capture re-shored electronics assemblies, catalyzing demand for precision sheet-metal chassis, server racks, and heat-sinks. Japan and South Korea, though mature, feed exports of high-precision semiconductor equipment frames and robotic sub-assemblies, capitalizing on lean production systems that blend machining, grinding, and metrology under one roof. Intra-Asia trade corridors shorten transit loops, allowing mill-direct deliveries of coil and bar to regional fabricators, fortifying competitiveness within the fabricated metal products market.
The Americas and EMEA Fabricated Metal Products Market
North America’s outlook is reinforced by more than USD 2 trillion federal stimulus earmarked for clean energy, advanced chips, and transport corridors. U.S. manufacturing construction hit USD 234 billion annualized in May 2024, a 217% surge versus 2019, indicating multi-year backlogs for mezzanines, HVAC plenums, and structural frames. Canada’s Critical Minerals Strategy funnels capital into battery-materials processing plants, inflating orders for stainless reactors and alloy-steel conveyance systems. Mexico gains from near-shoring of white-goods assembly and Tier-2 automotive sub-assemblies, spurring investments in tube-laser lines and robotic MIG cells. Cross-border supply chains leverage USMCA duty-free rules while retaining geographic proximity that minimizes logistics risk for fabricated sub-components. Europe grapples with energy-price volatility yet compensates via high-value niches in offshore wind monopiles, hydrogen electrolyzers, and medical-device housings. Germany’s Mittelstand excels at thin-gauge stainless forming, whereas Italy pivots toward boutique machining for luxury automotive. The EU’s carbon-border adjustment mechanism privileges mills employing electric-arc furnaces and high scrap ratios, influencing procurement toward low-carbon steel. Nordic producers exploit hydropower to smelt greener aluminum billets destined for offshore solar-farm structures. Middle East and Africa ride public-works megaprojects, Riyadh Metro and Egypt’s New Administrative Capital, requiring bridge girders and architectural façades. South America’s mining conveyor upgrades and floating LNG hubs sustain demand for heavy-duty plate and tubular fabrications despite macro-volatility, underscoring the geographic breadth of the fabricated metal products market.
Regulatory Landscape
Environmental compliance is a key regulatory driver for fabrication and finishing operations, especially where welding, machining, abrasive blasting, and coating processes generate hazardous air pollutants. In the United States, EPA National Emission Standards for Hazardous Air Pollutants under 40 CFR Part 63 Subpart XXXXXX cover nine metal fabrication and finishing source categories, with compliance obligations tied to pollutants such as cadmium, chromium, lead, manganese, nickel, and related process steps. Affected facilities must submit a notification of compliance status within 120 days of startup for regulated operations.
Outside air permitting, the regulatory agenda is shaped by manufacturing-sector rulemaking pipelines and state-level implementation guidance. The Fabricators and Manufacturers Association (FMA) flagged additional proposed and final EPA rules impacting manufacturers across 2026 (with activity referenced through July 2026). State environmental agencies, such as the Indiana Department of Environmental Management guidance for the sector, translate federal requirements into practical compliance pathways that influence equipment choices like filtration, capture systems, and lower-emission finishing technologies.
Value Chain Analysis
The value chain starts with upstream ferrous and nonferrous inputs, including steel coil, plate, bar, tube, aluminum sheet and extrusions, and specialty alloys, followed by distribution and service centers that provide inventory, cutting, and kitting to smooth lead times for fabricators. World Steel Association reporting highlights the weight of upstream materials in total steel value creation. The sector's shift toward electric-arc-furnace-based production links scrap availability and domestic melt capacity more tightly to downstream fabrication clusters that prioritize supply security and shorter replenishment cycles.
Midstream fabricated metal producers convert inputs through machining, welding and tubing, stamping, forming, casting/forging, and finishing (coating, heat treatment, and surface engineering), supported by tooling, automation, software, and metrology providers. Downstream demand is dominated by project- and OEM-driven buying in construction and infrastructure, power and utilities, manufacturing, and transportation. Procurement increasingly bundles fabrication with documentation such as material traceability, weld procedure qualification, and inspection records, along with delivery coordination. Vertical integration remains visible among major steel groups connecting steelmaking with downstream value-added offerings, while service-center platforms expand fabrication and processing footprints to capture more of the cut-to-installed component spend.
Competitive Landscape
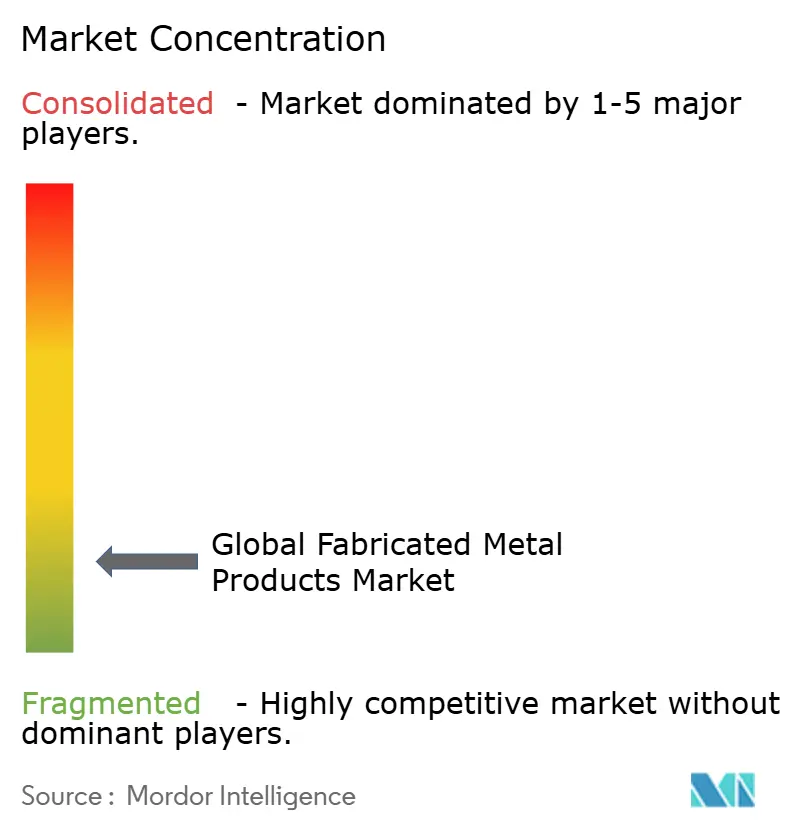
The competitive fabric remains fragmented: thousands of regionally anchored specialists cater to proximity-sensitive customers, while a handful of roll-up platforms pursue scale through acquisition. Mayville Engineering Company topped The Fabricator’s 2024 leaderboard at USD 588.4 million revenue, but that figure equates to less than 0.2% of the worldwide fabricated metal products market size, illustrating how unconcentrated the arena is. Cadrex at USD 485 million and BTD at USD 360 million round out the top tier, yet neither has the geographic span to serve all global OEM footprints. Private-equity involvement is heating up: Arlington Capital Partners formed Keel Holdings by fusing Pegasus Steel, Metal Trades LLC, and Merrill Technologies Group into a nine-plant, 1 million sq ft defense-focused network. Deal rationales center on cross-selling, procurement leverage, and shared automation best practices.
Technology is a decisive wedge. Shops deploying industrial IoT for machine-health monitoring reduce downtime by up to 20% and feed predictive analytics that derisk tight-deadline contracts. Additive manufacturing capability bolsters bid competitiveness on low-volume, complex-geometry parts, scaring off rivals tied to hard-tooling economics. The U.S. Bureau of Industry and Security’s export-license framework for additive systems can hinder overseas competitors, effectively granting U.S. operators a home-market technology moat. Mid-cap acquirers also chase niche process know-how, explosion-welding of clad plate, friction-stir-welding of aluminum railcar bodies, or electropolishing of biomedical devices, to differentiate on quality rather than price. End-market specialization, from modular data-center skids to cryogenic fuel tanks, enables value-based rather than tonnage-based pricing within the fabricated metal products market.
Sustainability credentials are gaining weight in RFQ scoring. Fabricators integrating renewable electricity, high-recycled-content feedstock, and verifiable Scope-3 data satisfy OEM decarbonization roadmaps, potentially commanding preferred-supplier status. Equipment makers pitch energy-efficient laser cutters able to reduce kWh per linear foot cut by double-digit percentages, while powder-bed printers reclaim almost all unused metal, slashing material waste. Advancement in virtual weld simulation trims physical prototypes, saving cost and embodied carbon. Together, these shifts alter the basis of competition from purely capacity to a triad of agility, technology, and sustainability, reshaping the hierarchy inside the fabricated metal products market.
Fabricated Metal Products Industry Leaders
-
ArcelorMittal
-
Nucor Corporation
-
China Steel Corporation
-
Howmet Aerospace
-
Parker-Hannifin Corporation
- *Disclaimer: Major Players sorted in no particular order
Fabricated Metal Products Market Companies Covered in this Report
- ArcelorMittal
- Nucor Corporation
- China Steel Corporation
- Howmet Aerospace
- Parker-Hannifin Corporation
- Ametek Inc.
- Ball Corporation
- Generac Holdings Inc.
- Inner Mongolia Baotou Steel Union Co., Ltd.
- Toyota Tsusho Corporation
- Voestalpine AG
- United States Steel Corporation
- JFE Holdings Inc.
- Thyssenkrupp AG
- BlueScope Steel Ltd.
- Reliance Steel & Aluminum Co.
- O’Neal Manufacturing Services
- Mayville Engineering Company Inc.
- BTD Manufacturing
Market Opportunities and Future Outlook
White space is forming around low-carbon and traceable steel and aluminum used in construction-intensive fabricated assemblies, as buyers translate Scope-3 reporting pressure into RFQ requirements for recycled content, emissions documentation, and certified processes. ArcelorMittal formalized this shift through its June 2026 multi-year supply framework agreement, which provides XCarb structural steel for Amazon facilities and AWS data centers in Europe and the UK, reinforcing demand for fabricators that can pair low-carbon input materials with documented finishing quality and predictable delivery.
Opportunity also extends to higher-performance coated steels and more regionalized supply that reduces lead-time risk for structural and rebar-intensive projects. The May 2026 opening of Nucor's Lexington, North Carolina rebar micro mill (430,000 tons annual capacity) strengthens near-market rebar availability for downstream fabrication and placement cycles, while ArcelorMittal Nippon Steel India’s June 2026 launch of Zagnelis Protect highlights OEM pull for differentiated zinc-aluminum-magnesium coatings that extend durability in automotive and industrial environments. In parallel, worldsteel and OECD 2026 outlooks point to activity concentration in India, Southeast Asia, and parts of the Middle East and North Africa, aligning whitespace for capacity, quality systems, and multi-process capabilities close to fast-moving infrastructure and industrial build programs.
Recent Industry Developments in Fabricated Metal Products Market
- June 2026: ArcelorMittal entered a strategic collaboration with AWS to accelerate industrial automation and signed a multi-year Supply Framework Agreement to provide XCarb structural steel for Amazon facilities and AWS data centers in Europe and the UK. The collaboration signals a shift toward digitized, near-shore automation and sustainable steel sourcing for large scale facilities. The arrangement could reshape European supply chains for XCarb steel by aligning production capacity with high profile cloud and logistics needs.
- June 2026: ArcelorMittal Nippon Steel India launched Zagnelis Protect, a premium Zinc-Aluminium-Magnesium coated steel brand for automotive applications. The new coating strengthens material differentiation in automotive steel sourcing and may enable pricing power through enhanced durability and corrosion resistance. The move could support OEM qualification and broaden domestic supplier options for automotive programs.
- May 2026: Nucor Corporation officially opened a 440 million rebar micro mill in Lexington, North Carolina, adding 430,000 tons of annual rebar capacity. The expansion enhances domestic supply security and near shore fabrication capabilities for construction projects. The facility supports regional project demand and may help Nucor gain share in the U.S. rebar market.
Fabricated Metal Products Market Report Scope and Research Methodology
Market Definition and Coverage
For this study, the fabricated metal products market covers finished and semi-finished metal components made by cutting, forming, machining, welding, and similar shop-floor processes, and sold into industrial and construction value chains across all major regions.
Scope exclusions: We exclude primary metal production and basic raw material sales (such as crude steel and primary aluminum), and we also exclude stand-alone metalworking machinery and tools.
Segments Covered in This Report
- By Material Type
- Steel
- Aluminum
- Other Alloys (Titanium, Copper, etc.)
- By Fabrication Process
- Casting
- Forging
- Machining
- Welding & Tubing
- Others (Stamping, Additive Manufacturing)
- By End-user Industry
- Manufacturing
- Power & Utilities
- Construction & Infrastructure
- Oil & Gas
- Automotive
- Aerospace & Defense
- Other Industries
- By Geography
- North America
- United States
- Canada
- Mexico
- South America
- Brazil
- Argentina
- Peru
- Rest of South America
- Europe
- United Kingdom
- Germany
- France
- Italy
- Spain
- BENELUX (Belgium, Netherlands, and Luxembourg)
- NORDICS (Denmark, Finland, Iceland, Norway, and Sweden)
- Rest of Europe
- Asia-Pacific
- China
- India
- Japan
- Australia
- South Korea
- ASEAN (Indonesia, Thailand, Philippines, Malaysia, Vietnam)
- Rest of Asia-Pacific
- Middle East and Africa
- Saudi Arabia
- United Arab Emirates
- Qatar
- Kuwait
- Turkey
- Egypt
- South Africa
- Nigeria
- Rest of Middle East and Africa
- North America
Data Sources, Market Sizing, and Validation
Desk Research
Desk research was used to set the outer limits of the market, align terminology, and build an initial view of regional demand drivers. We leaned on public production, industrial output, and trade signals that map well to fabricated goods moving across borders and into end uses. Examples of inputs include public sources such as the United Nations Industrial Development Organization (industrial statistics), the US Census Bureau (manufacturing and construction series), Eurostat (industrial production and trade), the World Steel Association (steel demand indicators), and the International Energy Agency (power and renewables build-out signals).
We also reviewed company annual reports, investor presentations, and reputable press to understand capacity moves, pricing behavior, and end-market exposure by geography. Where public filings were thin, we supplemented with paid subscriptions for company financials and news, patent databases for process shifts, and shipment-level import and export data to sanity-check regional flows. The desk research sources listed here are illustrative only, and many other public and subscription sources were used to collect, validate, and clarify data points.
Primary Interviews and Surveys
Primary work was used to pressure-test the desk model and translate broad indicators into realistic assumptions on utilization, order patterns, and price realization across regions. We spoke with manufacturers, distributors, fabricators, and large buyers, then cross-checked differences between APAC, EMEA, and the Americas so the same variable was not applied uniformly everywhere. When inputs conflicted, follow-ups were run with additional respondents until the assumption set stabilized for the final model.
Distribution of primary research fieldwork respondents
| Company type | Respondent position | Region |
|---|---|---|
| Top tier: 38% | CXOs: 18% | APAC: 42% |
| Mid tier: 41% | Functional/Unit leaders: 27% | EMEA: 35% |
| Smaller Players: 21% | Managers: 55% | Americas: 23% |
Market-Sizing & Forecasting
Sizing starts with a top-down build where manufacturing output and trade data are used to reconstruct the pool of fabricated metal demand by region, and then the totals are adjusted using end-use intensity checks for construction, machinery, transport equipment, and energy projects. To keep the totals practical, we corroborate them with selective bottom-up approximations from sampled supplier revenues, channel checks, and simple ASP-times-volume logic for common fabricated categories, and then tune totals where the two views do not reconcile.
Several model inputs shaped the results repeatedly because they move the market in visible ways. These include regional industrial production indices, construction spending trends, steel consumption patterns that feed fabrication throughput, import and export flows of fabricated goods, and utilization changes when order lead times tighten or loosen. For forecasting, scenario analysis was used, with year-by-year assumptions set for raw material pass-through, capacity additions, and end-market growth paths, then reviewed with industry experts to bound aggressive and conservative cases before finalizing the base case. Where bottom-up evidence was incomplete for smaller or more fragmented categories, we filled gaps using proxy intensity ratios tied to industrial output and validated against trade and production direction.
Data Validation & Update Cycle
Validation is handled through a set of structured checks so the final numbers do not rely on a single signal. Model outputs are compared with independent metrics like regional manufacturing value-add direction, trade balance shifts, and visible construction and industrial capex cycles, and then outliers are investigated until the underlying driver is clear. Before sign-off, results go through multi-step analyst reviews that check for currency conversion timing issues, unusual regional splits, and sudden jumps that are not explained by real demand.
Reports are refreshed annually, and interim updates are made when material events occur, such as major policy changes, sharp input cost swings, or meaningful capacity announcements. Before delivery, a final pass is completed so the dataset, assumptions, and narrative reflect the latest available information.
Mordor Intelligence's Global Fabricated Metal Products Market Size Versus Other Published Estimates
Published market values for fabricated metal products can differ even when the topic looks similar, since each estimate depends on how the value chain is defined and how pricing and regional coverage are handled. Differences also come from how trade is treated, how quickly assumptions are refreshed, and whether the model is anchored to production-linked indicators or mainly to company revenue mapping.
In practice, the biggest gap drivers are usually scope choices such as including metalworking machinery, basic metal production, or downstream installation services, which can lift totals even though they are not fabrication output. Another common driver is pricing logic, where some estimates apply a blended price curve across regions, or use an older currency and inflation timing, which can distort year-to-year comparisons when steel price pass-through is uneven.
Benchmark comparison
| Source | Market Size | Gaps in Research Methodology |
|---|---|---|
| Mordor Intelligence | USD 359.05 B (2025) | |
| Global Consultancy A | USD 522.50 B (2025) | This figure appears to use a wider scope that can fold in adjacent metal manufacturing and broader fabricated categories, which inflates totals versus a fabrication-only build and also uses a different study window. |
| Trade Journal B | USD 305.40 B (2025) | This view looks closer to a narrower cut that can exclude several higher-value fabricated outputs and apply more conservative price realization assumptions, which lowers the 2025 total compared with a multi-region pass-through approach. |
The spread is mainly explained by what gets counted as fabrication output and how regional price pass-through is timed, rather than by disagreements on general industrial growth. By tying totals to production and trade signals, then checking them with end-use intensity and interview-led utilization logic, the 2025 value stays traceable to repeatable steps described by Mordor Intelligence.
Key Questions Answered in the Report
What is the 2026 value of the fabricated metal products market?
The fabricated metal products market size is USD 374.92 billion in 2026.
How fast is demand for aluminum fabrications expected to grow?
Aluminum components are forecast to post a 5.66% CAGR through 2031, the fastest among material segments.
Which region leads both in share and growth?
Asia-Pacific holds 48.35% of fabricated metal products market share in 2025 and is projected to advance at a 4.71% CAGR.
What role does renewable energy play in future demand?
Wind, solar, and grid-modernization investments add roughly 0.9 percentage points to overall CAGR by driving tower, racking, and conductor demand.