
Enterprise Augmented Reality Market Size and Share
Market Overview
| Study Period | 2020 - 2031 |
|---|---|
| Market Size (2026) | USD 146.05 Billion |
| Market Size (2031) | USD 528.79 Billion |
| Growth Rate (2026 - 2031) | 29.35 % |
| Fastest Growing Market | Asia-Pacific |
| Largest Market | North America |
| Market Concentration | Medium |
Major Players *Disclaimer: Major Players sorted in no particular order Image © Mordor Intelligence. Reuse requires attribution under CC BY 4.0. | |
Enterprise Augmented Reality Market Analysis by Mordor Intelligence
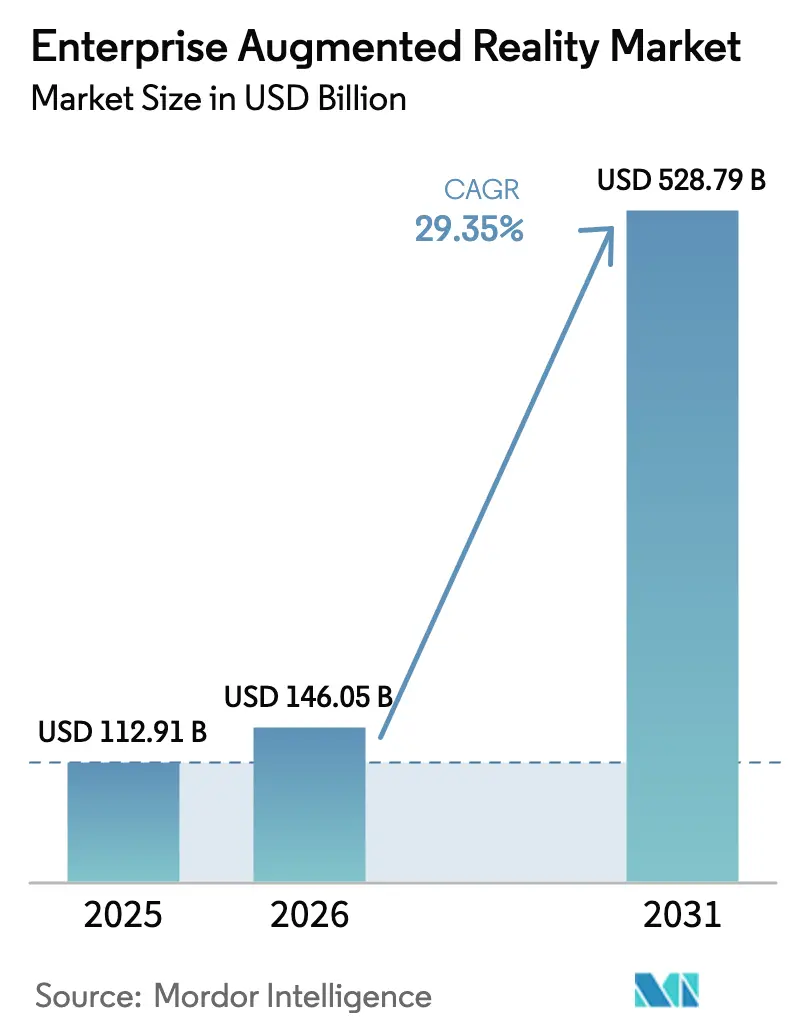
The enterprise augmented reality market size was valued at USD 112.91 billion in 2025 and estimated to grow from USD 146.05 billion in 2026 to reach USD 528.79 billion by 2031, at a CAGR of 29.35% during the forecast period (2026-2031). Hardware currently delivers 62.3% of global revenue, yet service-centric business models are expanding fastest as enterprises shift capital from devices to outcome-based engagements. The acceleration is powered by widespread 5G roll-outs, AR-cloud architectures, and RISC-V chipsets that lower total cost of ownership while providing the ultra-low latency required for mission-critical use cases. Discrete manufacturers and energy operators are scaling proven pilots into plant-wide deployments because real-time visual guidance consistently trims errors, downtime, and training cycles. Competitive intensity remains moderate; platform players are deepening software ecosystems while newer entrants leverage cost-efficient optics and proprietary SLAM stacks to secure design wins.
Key Report Takeaways
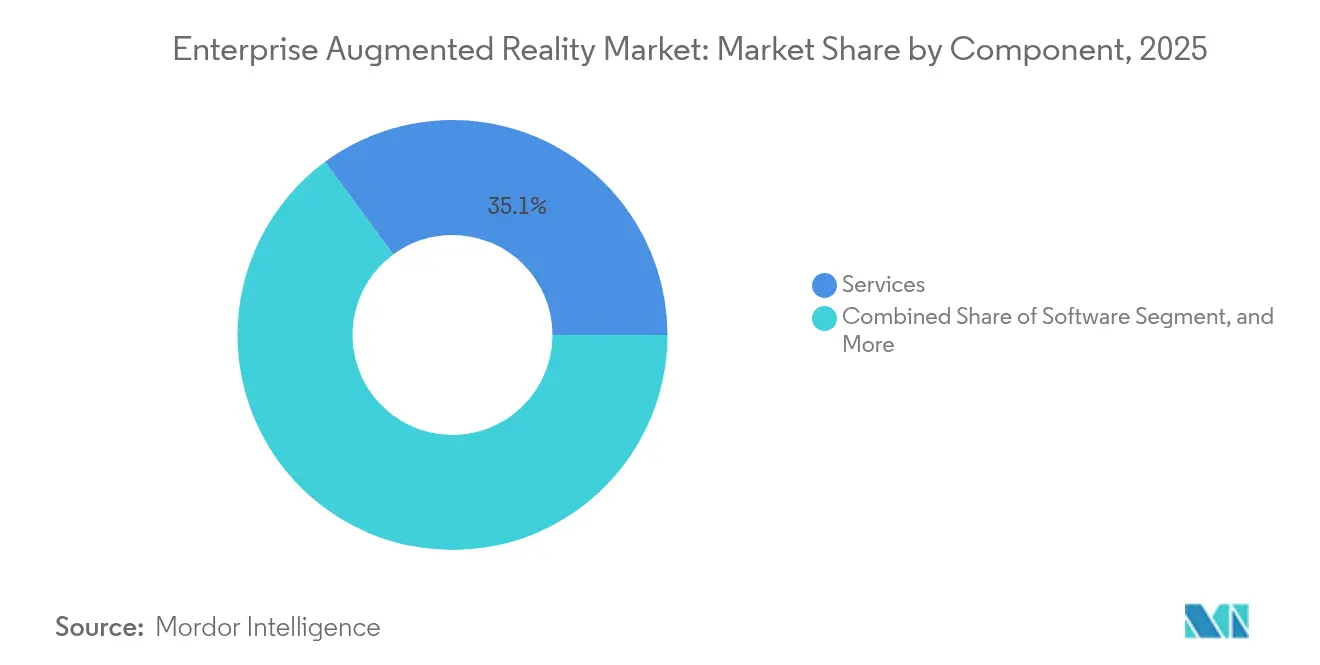
- By component, Hardware held 61.45% of the enterprise augmented reality market share in 2025, while Services is forecast to grow at 33.20% CAGR through 2031.
- By device type, Head-mounted displays led with 51.85% revenue share in 2025; Projection/Spatial systems are projected to expand at a 36.10% CAGR to 2031.
- By deployment, On-premise implementations represented 61.90% of 2025 spending; Cloud/AR-as-a-Service is forecast to rise at 34.90% CAGR to 2031.
- By application, Remote Assistance & Collaboration accounted for 27.15% of the enterprise augmented reality market size in 2025; Workflow & Quality Control is advancing at a 35.80% CAGR to 2031.
- By end-user industry, Industrial Manufacturing captured 30.05% share of the enterprise augmented reality market size in 2025, while Energy & Utilities is expected to post a 32.40% CAGR through 2031.
Note: Market size and forecast figures in this report are generated using Mordor Intelligence’s proprietary estimation framework, updated with the latest available data and insights as of 2026.
Market Trends and Insights
Drivers Impact Analysis of Enterprise Augmented Reality Market*
| Driver | (~) % Impact on CAGR Forecast | Geographic Relevance | Impact Timeline |
|---|---|---|---|
| Rapid ROI-proof industrial pilot programs | +4.2% | Global, with concentration in North America & EU | Short term (≤ 2 years) |
| Smartphone-class RISC-V processors slashing device BOM | +3.8% | Global, led by APAC manufacturing hubs | Medium term (2-4 years) |
| Mainstream shift to head-mounted AR for frontline work | +5.1% | North America & EU industrial corridors | Medium term (2-4 years) |
| 5G/Private-LTE enabling ultra-low-latency AR streaming | +4.7% | Global, with early deployment in developed markets | Long term (≥ 4 years) |
| ESG-linked capex credits for AR training gear | +2.3% | EU & North America, expanding to APAC | Long term (≥ 4 years) |
| OSHA digital-twin mandates for high-risk plants | +3.1% | North America, with spillover to global operations | Medium term (2-4 years) |
| Source: Mordor Intelligence | |||
Rapid ROI-proof Industrial Pilot Programs
Enterprises move beyond proofs of concept because pilot projects consistently deliver hard savings and productivity lifts. Ford’s Dearborn engine plant documented measurable quality gains after equipping technicians with HoloLens 2, training 25 workers initially and planning to scale to 100 by year-end.[1] Similar warehouse programs pushed order-picking accuracy to 99.9% at Coca-Cola operations.[2] These publicly reported successes shorten internal approval cycles and justify multi-site roll-outs, accelerating the enterprise augmented reality market’s penetration curve.
Smartphone-class RISC-V Processors Slashing Device BOM
Open-source RISC-V chipsets provide smartphone-level compute at materially lower bill-of-materials. XREAL’s X1 processor removed the need for tethered devices, letting the firm price its smart glasses at USD 499–599 and still sustain gross margins.[3] Lower costs broaden the addressable user base and allow fleet-sized procurements, a critical lever for scaling the enterprise augmented reality market in cost-sensitive industrial segments.
Mainstream Shift to Head-mounted AR for Frontline Work
Improved ergonomics, larger FoV, and all-day battery life have made head-mounted AR practical for frontline technicians. Peer-reviewed research indicated productivity jumps of up to 15% without compromising worker safety. As wearables integrate seamlessly with PPE and corporate IT, hands-free workflows replace handheld screens, lifting adoption barriers and deepening per-user consumption of AR content.
5G/Private-LTE Enabling Ultra-low-latency AR Streaming
Edge-to-cloud rendering over dedicated 5G slices reduces on-device compute and unlocks photorealistic overlays. Google Cloud’s Immersive Stream for XR showcases download-free experiences that run on thin clients. Nuclear facilities in the Czech Republic now run latency-sensitive AR inspections over private 5G, improving safety in constrained environments. Reliable sub-20 ms round-trip times are pivotal for real-time guidance and digital twins, underpinning long-term growth of the enterprise augmented reality market.
Restraints Impact Analysis of Enterprise Augmented Reality Market*
| Restraint | (~) % Impact on CAGR Forecast | Geographic Relevance | Impact Timeline |
|---|---|---|---|
| Edge-compute security gaps | -2.8% | Global, with heightened concern in regulated industries | Short term (≤ 2 years) |
| Legacy MES/PLM integration costs | -3.4% | North America & EU manufacturing centers | Medium term (2-4 years) |
| Short-staffed optical-waveguide supply chain | -2.1% | Global, concentrated in APAC production hubs | Medium term (2-4 years) |
| Growing patent-troll litigation on SLAM IP | -1.7% | North America & EU legal jurisdictions | Long term (≥ 4 years) |
| Source: Mordor Intelligence | |||
Edge-compute Security Gaps
Distributing processing across headsets, on-premise gateways, and cloud nodes widens the attack surface, a concern for plants handling proprietary processes or hazardous materials. Many IT teams lack AR-specific security playbooks, resulting in delayed roll-outs until zero-trust architectures are proven. Compliance audits add further overhead, temporarily dampening some demand curves within the enterprise augmented reality market.
Legacy MES/PLM Integration Costs
Brownfield factories often run decades-old MES and PLM suites that were never architected for spatial data. Retrofitting those systems to stream work instructions into AR devices can exceed hardware budgets and demands scarce integration talent. Without standardized APIs, CIOs face vendor lock-in and multi-year roadmaps, slowing conversion of intent into purchase orders.
*Our forecasts treat driver/restraint impacts as directional, not additive. The impact forecasts reflect baseline growth, mix effects, and variable interactions.
Enterprise Augmented Reality Market Segment Analysis
By Component:
Services Drive TransformationThe Services segment is projected to expand at 33.20% CAGR from 2026-2031, overtaking pure product revenue as firms lean on integrators for rollout, user training, and uptime SLAs. Services partners convert early hardware pilots into plant-wide deployments, a trend that underpins the enterprise augmented reality market’s shift toward outcome-based contracting. Innovations such as AI-generated work instructions automate content creation and cut deployment cycles.
The component mix evolution signals maturation: once fleets of headsets are installed, value migrates to analytics, refresh cycles, and continuous improvement consulting. Vendors are bundling software subscriptions with on-site change-management to lock in recurring revenue and deepen client intimacy, reinforcing long-run stickiness across the enterprise augmented reality market.

By Device Type:
Projection Systems EmergeHead-mounted units retained 51.85% share in 2025, but projection and spatial systems are sprinting at 36.10% CAGR as factories deploy shared 3D workspaces for collaborative tasks. Projection eliminates wearability concerns and is favored for operator training bays, additive-manufacturing cells, and quality cabins where teams gather around a common reference. Industry 4.0 pilots confirm that spatial setups shorten design reviews and cut rework loops.
Lightweight optics research is simultaneously reducing headset weight to under 200 g, widening suitability for shift-long use. Enterprises therefore adopt a multimodal toolkit: individual technicians wear head-mounted displays, while supervisors engage with large-scale projection, collectively accelerating device diversity across the enterprise augmented reality market.
By Deployment:
Cloud Services SurgeOn-premise solutions accounted for 61.90% of 2025 revenue because CIOs initially favored tight data custody. However, cloud-native offerings are growing at 34.90% CAGR as hyperscalers launch GPU-accelerated XR services with enterprise controls. Google Cloud’s Immersive Stream delivers zero-install sessions across multisite fleets, slashing local hardware spend.
Infinite Reality’s USD 3 billion investment and Zappar acquisition underscore momentum toward vertically integrated cloud plus content ecosystems. As bandwidth costs fall and zero-trust postures mature, cloud will capture an outsized share of incremental dollars in the enterprise augmented reality market.
By Application:
Workflow Control AcceleratesRemote Assistance & Collaboration represented 27.15% of 2025 demand, yet Workflow & Quality Control is pacing at a 35.80% CAGR as manufacturers embed AR into takt-time operations. Real-time overlay of torque specs, part numbers, and IoT sensor data slashes errors before first pass yield. Automotive OEMs such as BMW run mixed-reality reviews that compress design-to-tooling cycles.
Design, training, and maintenance continue to show robust gains, but the pivot to line-side quality control elevates AR from supportive to indispensable. The enterprise augmented reality market’s growth therefore tilts toward process-critical licenses where downtime impacts are measurable and C-suite visibility is high.

By End-User Industry:
Energy & Utilities Lead GrowthIndustrial Manufacturing held 30.05% share in 2025, yet Energy & Utilities is forecast for 32.40% CAGR because digital twins and remote inspections mitigate risk in hazardous plants. Czech nuclear operators’ success with 5G-enabled AR strengthens the case for similar adoption in oil, gas, and chemical complexes.
Automotive, aerospace, and healthcare add scale through assembly guidance, cabin configuration, and surgical visualization respectively. Retail, logistics, and agriculture remain in earlier phases but exhibit clear ROI in pick accuracy and agronomic scouting, indicating continued whitespace for the enterprise augmented reality market.
Geography Analysis
North America Enterprise Augmented Reality Market
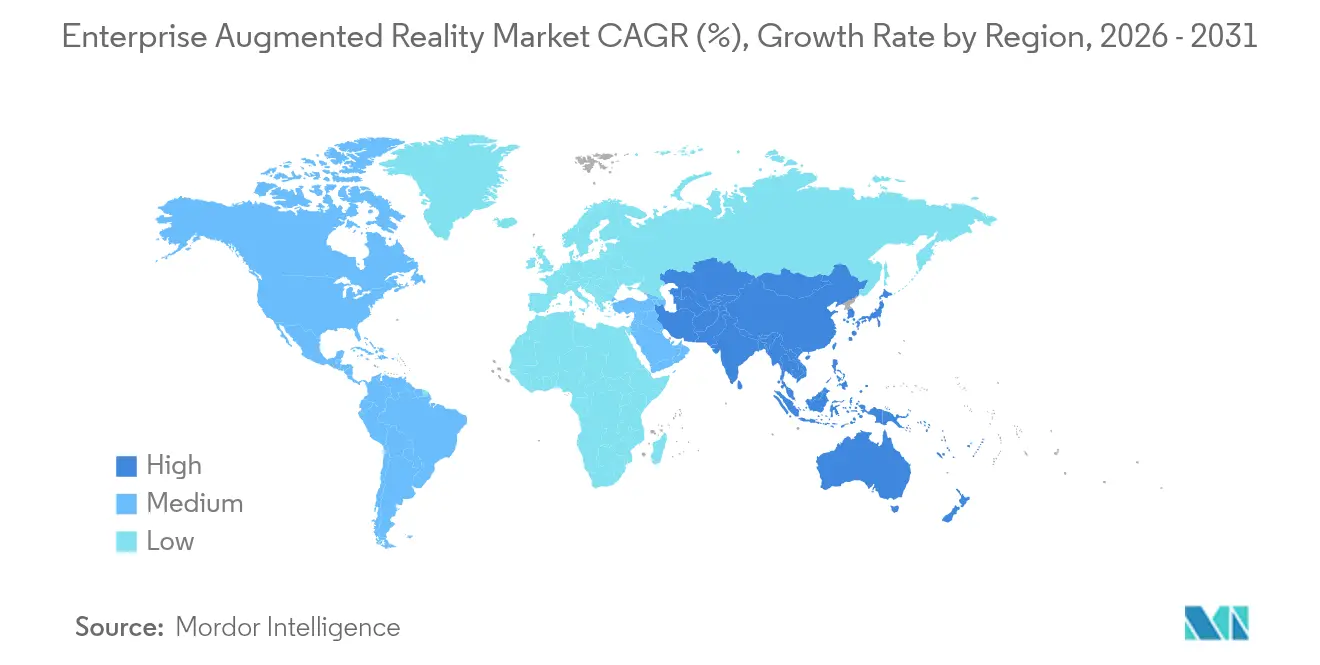
North America delivered 35.75% of 2025 revenue on the back of mature IT budgets, defense-grade mandates, and OSHA’s inclusion of UL 8400 AR/VR equipment safety standards. Microsoft’s collaboration with Anduril on the Integrated Visual Augmentation System illustrates government pull-through into commercial sectors. The region’s robust developer ecosystem accelerates bespoke application creation, reinforcing leadership across the enterprise augmented reality market.
APAC Enterprise Augmented Reality Market
Asia-Pacific is the fastest-growing theatre at 31.10% CAGR. China alone is expected to ship 2.75 million smart-glasses units in 2025, more than doubling year on year. XREAL’s 51% share of global AR eyewear shipments highlights regional ascendancy in optics manufacturing. Government incentives tied to factory digitalization and 5G coverage blanket industrial corridors, pulling local integrators and hyperscale cloud providers into tight alignment.
Europe Enterprise Augmented Reality Market
Europe posts steady gains, anchored by Industry 4.0 roadmaps, ESG-linked capex, and stringent worker-safety directives. Automotive clusters in Germany and France adopt collaborative AR to de-risk model transitions, while offshore wind farms deploy spatial twins for maintenance sequencing. The continent emphasizes interoperability standards, giving rise to cross-vendor consortia that could shape global frameworks and influence procurement across the enterprise augmented reality market.
Regulatory Landscape
Enterprise augmented reality deployments are increasingly shaped by procurement guidance and interoperability and safety standards rather than AR-specific licensing regimes. In June 2025, the US Department of Homeland Security (Science and Technology Directorate) published an AR/VR notional requirements list for procurements aimed at non-proprietary specifications for public-safety buyers, which reinforces baseline expectations for device selection, content compatibility, and manageability.
Standards activity accelerated through 2025-2026 across ISO/IEC and ETSI, with work concentrating on definitions, information modeling, and scene or world interoperability. Examples include ISO/IEC 9234:2025 for information modeling in VR/AR/MR education and training systems, and ETSI ISG ARF publications that set interoperability requirements and APIs for spatial computing (including ETSI GR ARF 012 V2.1.1, published in February 2026). These efforts shape enterprise AR purchasing criteria around interoperability, security posture, and vendor lock-in mitigation across deployments.
Value Chain Analysis
The enterprise augmented reality value chain begins with component and subsystem suppliers, including optics (such as waveguides and display engines), sensors, compute or SoCs, and batteries. Device OEMs and ODMs then build head-mounted displays, handheld endpoints, and projection or spatial systems. Above the device layer, software providers supply spatial computing runtimes, AR content authoring and workflow tools, remote assistance modules, and cloud or edge rendering back-ends, while systems integrators package these capabilities into end-user solutions aligned to MES/PLM/ERP environments. Trade bodies and standards organizations (for example, the Augmented Reality for Enterprise Alliance and ETSI ISG ARF) also influence the stack by shaping reference architectures and open APIs that reduce friction between hardware, world mapping, and application layers.
Distribution and deployment typically move through enterprise sales, channel partners, and industrial IT/OT integrators that manage site readiness, connectivity, identity and device management, and change-management services. On the supply side, constraints highlighted in the market context, including tight availability of specialized optics inputs (high-index glass and micro-LED emitters) and limited optical-waveguide capacity, add lead-time risk and encourage strategic sourcing and manufacturing partnerships. As services expand in large rollouts, the integrator and managed-services layer captures more value through device lifecycle management, security hardening, and application maintenance across multisite fleets.
Competitive Landscape
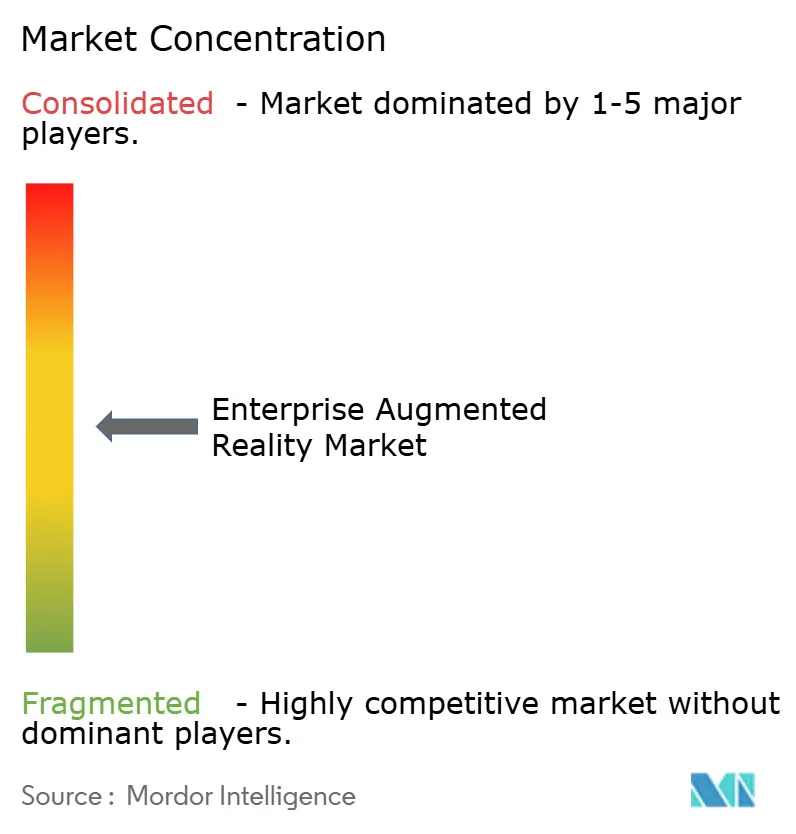
The enterprise augmented reality market is moderately fragmented, with incumbents leveraging platform depth while newcomers pursue cost disruption. Microsoft couples HoloLens hardware with Azure Digital Twins and Power Platform plugins, offering CIOs an end-to-end stack. PTC fortifies share via Vuforia Engine 11, embedding AR authoring into existing PLM workflows. Google’s optics partnership with Magic Leap signals its intent to internalize display IP and derisk supply dependencies.
Challengers such as XREAL, Rokid, and RealWear exploit agile hardware iterations and vertical bundles. RealWear’s acquisition of Almer Technologies broadens its industrial headset line while adding TeamViewer’s remote-support channels. Patent suits around SLAM and waveguides introduce uncertainty that can stunt capital formation; accordingly, firms with large IP arsenals or captive component fabs are better shielded. Supply-chain tightness in high-index glass and micro-LED emitters has fostered strategic investments like Vuzix’s USD 5 million infusion from Quanta Computer to ramp waveguide output.
Strategic collaboration is the dominant playbook. Cloud hyperscalers provide rendering back-ends, while ISVs overlay sector-specific logic. System integrators bundle change-management and KPI accountability. As pilots scale, winning vendors will combine device diversity, security certifications, and analytics benchmarks to capture an increasing slice of enterprise augmented reality market spending.
Enterprise Augmented Reality Industry Leaders
-
Atheer Inc.
-
Dynabook Americas Inc.
-
Epson Corporation
-
ThirdEye Gen Inc.
-
Lenovo Group Ltd.
- *Disclaimer: Major Players sorted in no particular order
Enterprise Augmented Reality Market Companies Covered in this Report
- Microsoft Corporation
- PTC Inc. (Vuforia)
- Magic Leap Inc.
- Vuzix Corporation
- Lenovo Group Ltd.
- Google LLC (Glass Enterprise)
- Epson Corporation
- RealWear Inc.
- Rokid Inc.
- ThirdEye Gen Inc.
- Dynabook Americas Inc.
- Nextech AR Solutions Corp.
- Librestream Technologies Inc.
- TeamViewer AG (Frontline)
- Scope AR
- Trimble Inc.
- Qualcomm Technologies Inc.
- Zebra Technologies Corp.
- Apple Inc. (visionOS enterprise SDK)
- Atheer Inc.
- Plutomen Technologies Pvt Ltd.
- Dalux A/S
Market Opportunities and Future Outlook
A major whitespace is interoperability-led platform consolidation that reduces integration cost with legacy MES/PLM systems and limits deployment risk in regulated environments. ETSI ISG ARF work on modular reference architectures and open APIs, along with ISO/IEC standards activity for modeling and immersive media architectures, supports cross-vendor world storage, scene management, and device or application portability. This aligns with enterprise buying patterns that favor multi-OEM fleets and longer-lived software investments.
Another opportunity centers on scaling optical components and sustaining enterprise-grade device availability, supported by capacity investments. In July 2026, Goertek OmniLight Optical Technology commenced commercial production at a 12-inch AR micro-nano optical wafer facility in Shanghai Lingang Blue Bay Industrial Zone, reported at about CNY 3.28 billion (about USD 457 million), and aimed at supplying AR waveguide lenses. On the demand side, Vuzix reported in March 2026 that a global online retailer expanded its M400 smart-glasses deployment and placed initial orders for Ultralite Pro OEM-based solutions, reflecting procurement momentum for warehouse and field workflows that link AR to measurable operational execution.
Recent Industry Developments in Enterprise Augmented Reality Market
- May 2026: Atheer partnered with Inspectron to integrate Inspectron visual inspection capabilities with the Atheer Work Execution Platform for remote service and inspection workflows. The combination targets regulated and asset-intensive environments where inspection evidence, workflow traceability, and technician guidance are purchased together rather than as standalone AR visualization.
- July 2025: HMS confirmed that its SiNGRAY G2 headset will ship with TeamViewer Frontline (frontline.io) for device management and workflow authoring. Tight coupling between headset management and content or workflow tools shortens onboarding time for frontline rollouts and supports repeatable deployments across multiple sites.
- June 2025: Vuzix secured a USD 5 million investment from Quanta Computer to scale waveguide production and advance next-generation device capabilities. The funding highlights the strategic importance of waveguide supply and manufacturing scale in stabilizing availability for enterprise smart-glasses programs.
Enterprise Augmented Reality Market Report Scope and Research Methodology
Market Definition and Coverage
The enterprise augmented reality market, for this methodology, covers AR hardware, software, and supporting services that are bought and used by organizations to improve work tasks like training, remote assistance, visualization, and guided workflows across industries and regions.
Scope exclusions: We exclude consumer-only AR spending that is mainly for gaming and personal entertainment, as well as pure VR solutions that do not deliver AR overlays in an enterprise setting.
Segments Covered in This Report
- By Component
- Hardware
- Software
- Services
- By Device Type
- Head-mounted / Smart-glasses
- Handheld / Mobile AR
- Projection / Spatial
- Others (HUD, Helmet-mounted)
- By Application
- Remote Assistance and Collaboration
- Training and Simulation
- Maintenance and Inspection
- Design and Visualization
- Sales and Marketing
- Workflow and Quality Control
- By End-User Industry
- Industrial Manufacturing
- Automotive and Aerospace
- Energy and Utilities
- Healthcare
- Retail and E-commerce
- Logistics and Warehousing
- Other End-user Industries (Public Safety, Agriculture)
- By Deployment
- On-premise
- Cloud / AR-as-a-Service
- By Geography
- North America
- United States
- Canada
- Mexico
- Europe
- Germany
- United Kingdom
- France
- Italy
- Spain
- Russia
- Rest of Europe
- Asia-Pacific
- China
- Japan
- India
- South Korea
- Australia and New Zealand
- Southeast Asia
- Rest of Asia-Pacific
- South America
- Brazil
- Argentina
- Chile
- Rest of South America
- Middle East
- United Arab Emirates
- Saudi Arabia
- Turkey
- Israel
- Rest of Middle East
- Africa
- South Africa
- Egypt
- Nigeria
- Rest of Africa
- North America
Data Sources, Market Sizing, and Validation
Desk Research
We started by setting clear boundaries for what qualifies as enterprise AR revenue, and then built a clean list of demand and supply signals that can be checked each year. Public sources were used to anchor the model with repeatable indicators, such as national statistics for ICT and business spending and formal definitions from official surveys.
For desk work, sources included ITU indicators, World Bank macro series, OECD digital economy publications, US Bureau of Labor Statistics data on relevant occupations, Eurostat business ICT usage datasets, and peer reviewed papers on AR use in industrial settings. We also reviewed public company filings and investor presentations, product documentation, reputable press, and public procurement and tender notices where relevant. In addition, we used paid database subscriptions for company financials and intelligence, patent databases, and a news and financials database to track launches, partnerships, and pricing commentary. This list is illustrative only, and many other sources were also used for data collection, validation, and research clarification.
Primary Interviews and Surveys
To validate what the desk inputs were indicating, we conducted expert interviews and structured surveys across device suppliers, software and platform providers, system integrators, and enterprise users who manage deployments. We focused on adoption timing, the direction of average selling price (ASP), attach rates for software and services, and how pilots convert into scaled rollouts across major regions, so we could close gaps left by public data.
Distribution of primary research fieldwork respondents
| Company type | Respondent position | Region |
|---|---|---|
| Top tier: 35% | CXOs: 14% | APAC: 50% |
| Mid tier: 51% | Functional/Unit leaders: 27% | EMEA: 29% |
| Smaller Players: 14% | Managers: 59% | Americas: 21% |
Market-Sizing & Forecasting
Our sizing starts with a top-down build where enterprise AR demand is reconstructed from enterprise IT and digital operations spend pools, and then filtered by AR adoption rates by industry, device penetration, and deployment intensity by use case. Results are corroborated using selective bottom-up approximations, such as sampled ASP times shipment and active deployments, plus channel checks on typical software subscription levels and services attach.
Key inputs in the model include AR-capable device shipment trends into enterprises, ASP movement by device type, software subscription pricing and seat expansion patterns, services share during rollout and support phases, and the conversion rate from pilots to production deployments. Because services and software are not always disclosed consistently, we use scenario-based ranges and narrow them using interview feedback and cross-checks against known deployment footprints.
For forecasting, we used scenario analysis supported by short time series smoothing on adoption and ASP trajectories, since this market can shift quickly with product cycles and enterprise budget resets. Assumptions were stress-tested using sensitivity checks on device ASP deflation, software attach rates, and deployment scale-up timing, and then aligned to expert consensus on near-term enterprise rollout pace.
Data Validation & Update Cycle
We triangulate the final market values using multiple checkpoints, including consistency between implied enterprise device volumes, software-to-hardware revenue ratios, and the services mix expected during implementation-heavy years. Outliers are flagged when a region or vertical shows growth that is not supported by independent signals, and then the drivers are revisited before sign-off.
A second analyst review is done to confirm formulas, currency handling, and year mappings, and re-contacts are triggered when a major vendor shift or a policy change can move demand assumptions. Reports refresh annually, with interim updates for material events, and a final pre-delivery pass so clients receive the latest updated view.
Mordor Intelligence's Global Enterprise Augmented Reality Market Size Compared Against Other Published Estimates
Published market values for enterprise AR often vary because the category boundary is not always treated the same way, and pricing and currency choices can move the total in a fast-growing market. Differences also come from whether a study counts only platform and software revenue, or also includes devices and implementation services tied to deployments.
In our refresh-led approach, the biggest swing usually comes from how quickly ASPs step down after new device cycles, which month exchange rates are applied for global rollups, and whether late-year contract wins are included after validation. By using an annual refresh with interim checks on device ASPs, software attach, and services mix, and locking currency timing consistently across regions, the total stays closer to what enterprises actually purchased in that year, a modeling choice applied by Mordor Intelligence.
Benchmark comparison
| Source | Market Size | Gaps in Research Methodology |
|---|---|---|
| Mordor Intelligence | USD 146.05 B (2026) | |
| Trade Journal A | USD 29.65 B (2025) | Uses an earlier base year and appears to focus more on enterprise AR applications without fully capturing device revenue and rollout services, and it may also apply aggressive multi-year scaling without year-specific ASP resets. |
| Global Consultancy B | USD 8.95 B (2025) | Likely narrows scope to enterprise AR platforms rather than the full enterprise AR spend stack, and the estimate is sensitive to conservative assumptions on deployment conversion and software attach rates across industries. |
The spread across the three figures is mainly explained by what is counted in-scope (platform-only versus full hardware, software, and services) and by how fast prices and deployments are assumed to change year to year. Our approach keeps the number traceable to practical inputs like device volumes, ASP steps, and enterprise rollout intensity, which makes it easier for readers to reconcile the total with real adoption signals.
Key Questions Answered in the Report
What is the current value of the enterprise augmented reality market?
The enterprise augmented reality market stands at USD 146.05 billion in 2026 and is projected to reach USD 528.79 billion by 2031.
Which component segment is growing fastest?
Services is expanding at 33.20% CAGR as firms rely on integrators and outcome-based contracts for large-scale deployments.
Why is Asia-Pacific the fastest-growing region?
Manufacturing expansion, government digitalization incentives, and cost-efficient optics production are driving a 31.10% CAGR in Asia-Pacific.
How will 5G influence AR adoption?
Dedicated 5G and private-LTE networks provide sub-20 ms latency that supports cloud-rendered AR, enabling photorealistic overlays without heavy on-device processing.
Which industry vertical shows the highest forecast growth?
Energy & Utilities is predicted to grow at 32.40% CAGR as operators deploy AR for safety-critical digital twins and remote inspections.
What are the main barriers to enterprise AR scale-up?
Edge-compute security gaps and costly integration with legacy MES/PLM systems remain the two largest restraints on rapid expansion.