
ENT Devices Market Size and Share
Market Overview
| Study Period | 2020 - 2031 |
|---|---|
| Market Size (2026) | USD 30.43 Billion |
| Market Size (2031) | USD 39.69 Billion |
| Growth Rate (2026 - 2031) | 5.46 % |
| Fastest Growing Market | Asia Pacific |
| Largest Market | North America |
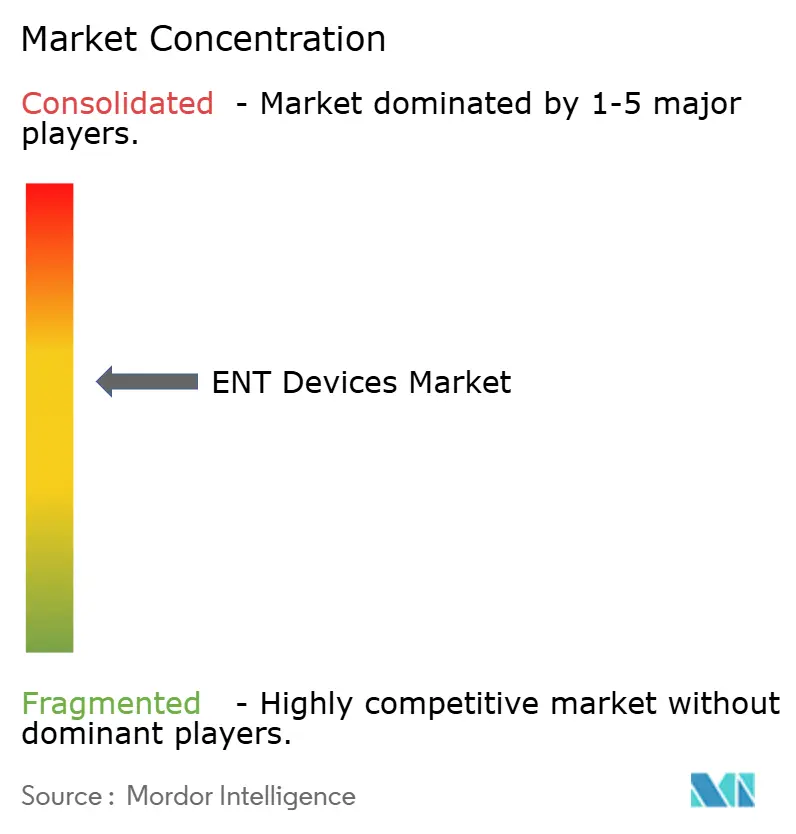
| Market Concentration | Medium |
Major Players *Disclaimer: Major Players sorted in no particular order Image © Mordor Intelligence. Reuse requires attribution under CC BY 4.0. | |
ENT Devices Market Analysis by Mordor Intelligence
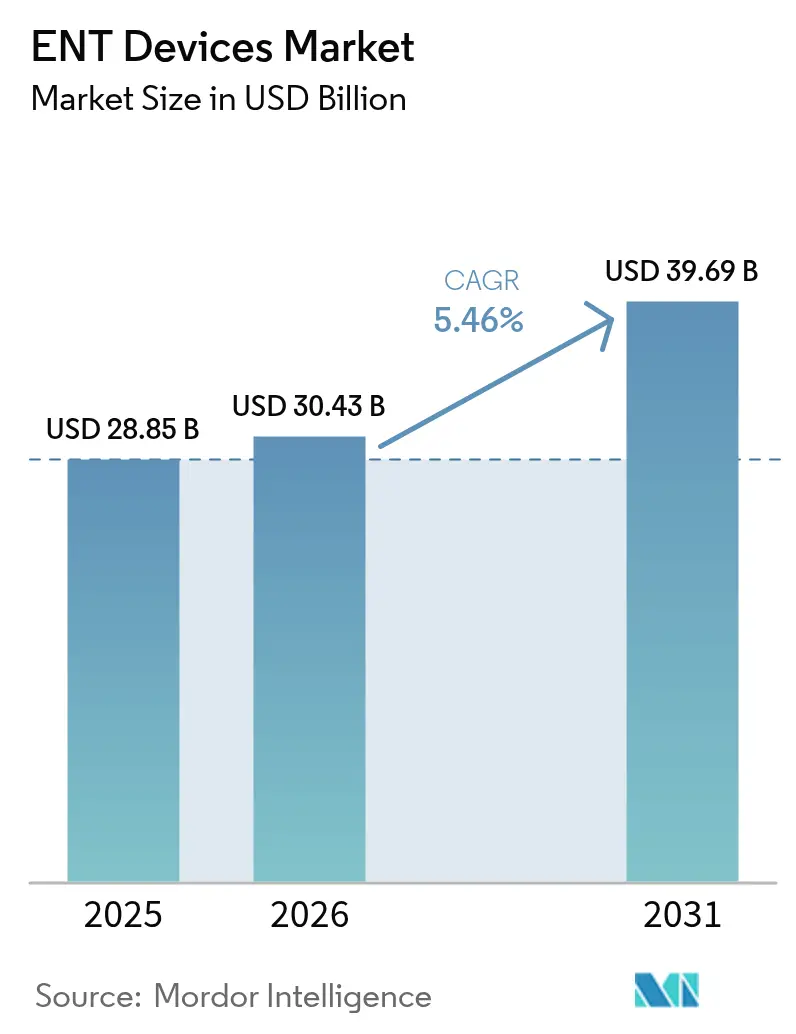
ENT devices market size in 2026 is estimated at USD 30.43 billion, growing from 2025 value of USD 28.85 billion with 2031 projections showing USD 39.69 billion, growing at 5.46% CAGR over 2026-2031. Robust demand stems from the expanding pool of age-related auditory and sinonasal disorders, steady procedure volumes across hospitals and ambulatory centers, and the rapid infusion of artificial intelligence into routine ENT tools. AI-enabled hearing aids that adjust to real-world listening environments, hyperspectral endoscopes that reveal tissue microstructures, and balloon sinus dilation kits that speed post-operative recovery collectively raise clinical expectations and spur replacement purchases. Parallel gains in home-based care, exemplified by smartphone-linked devices that permit remote programming, widen patient access and support recurring revenue models inside the ENT devices market. Volume growth is further anchored by Asia-Pacific’s infrastructure build-out, North America’s reimbursements that now cover over-the-counter aids, and surgically focused innovations that shorten operating-room time.
Key Report Takeaways
- By product category, hearing aids led with 31.60% revenue share in 2025; implantable devices are projected to expand at a 9.04% CAGR between 2026-2031.
- By age group, adults accounted for 39.50% of the ENT devices market share in 2025, while geriatrics are poised to advance at a 7.38% CAGR through 2031.
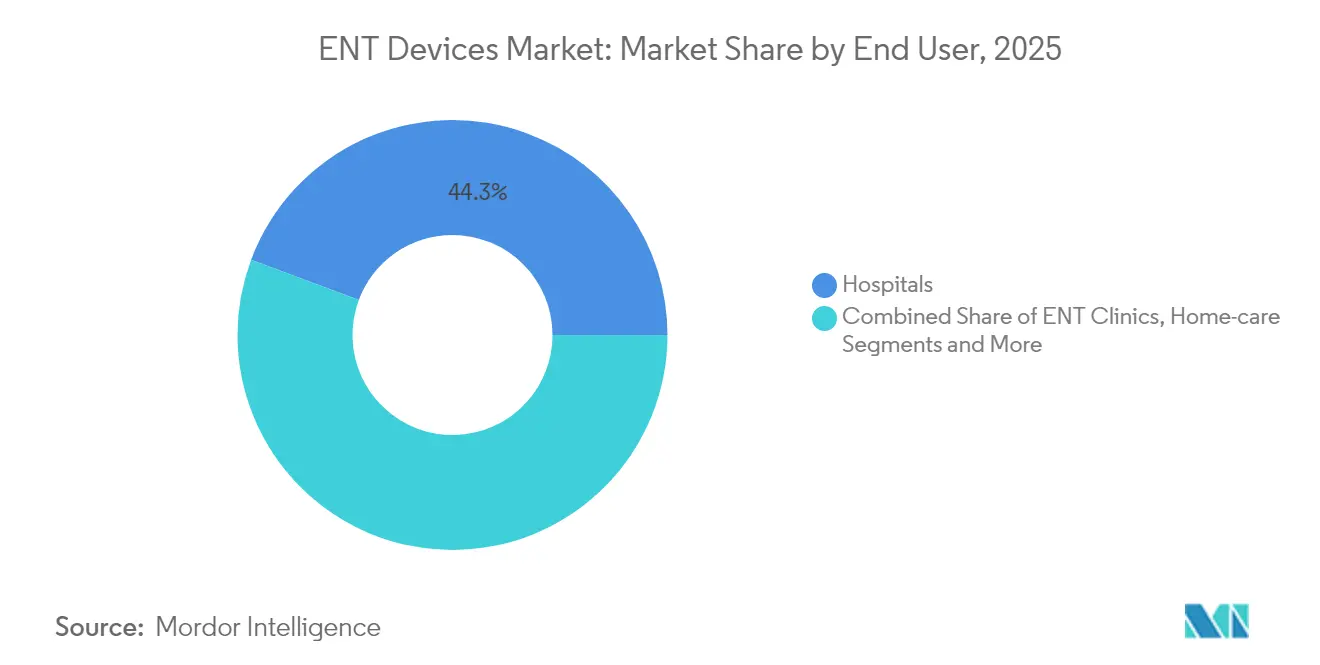
- By end user, hospitals retained 44.30% share of the ENT devices market size in 2025 and home-care solutions are advancing at a 7.65% CAGR to 2031.
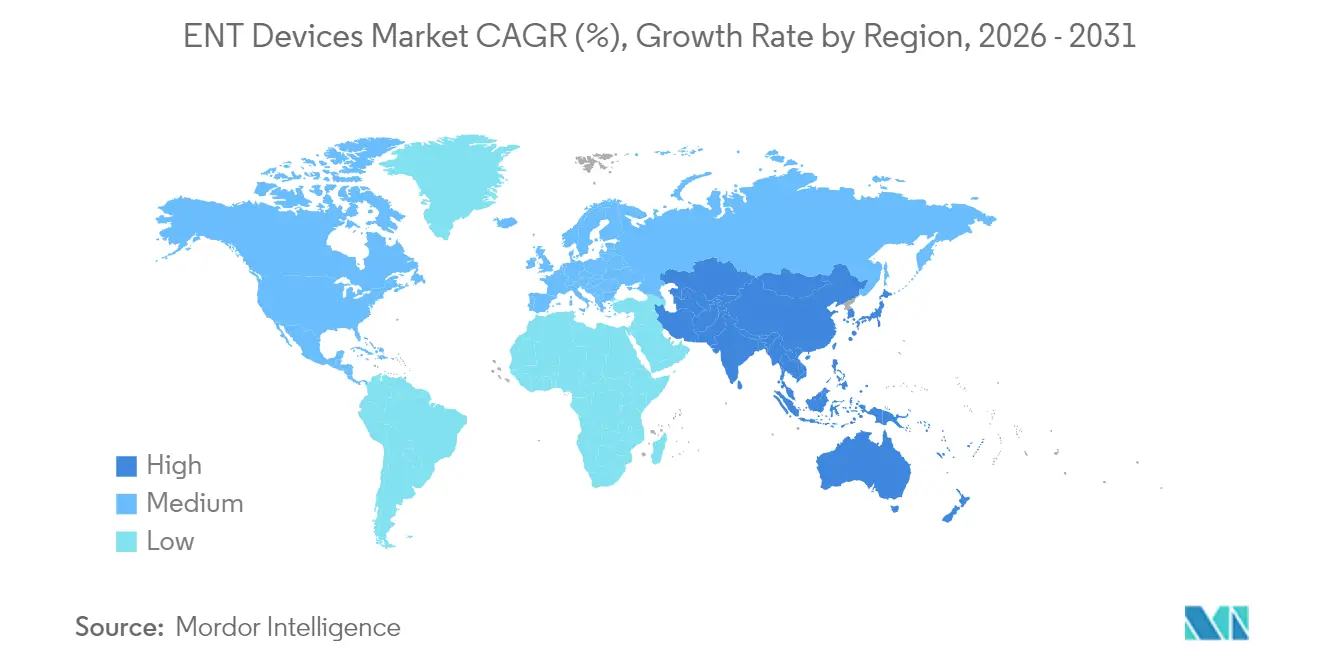
- By geography, North America commanded 37.70% of the ENT devices market in 2025; Asia-Pacific is forecast to register a 6.95% CAGR through 2031.
Note: Market size and forecast figures in this report are generated using Mordor Intelligence’s proprietary estimation framework, updated with the latest available data and insights as of 2026.
Market Trends and Insights
Drivers Impact Analysis of ENT Devices Market*
| Driver | (~) % Impact on CAGR Forecast | Geographic Relevance | Impact Timeline |
|---|---|---|---|
| Rising prevalence of ENT disorders | +1.8% | Global, higher in North America and Europe | Long term (≥4 years) |
| Technological advancements in ENT devices | +1.5% | Global, early adoption in North America and Europe | Medium term (2-4 years) |
| Rising adoption of minimally invasive procedures | +1.0% | Global, higher in developed markets | Medium term (2-4 years) |
| Rising awareness campaigns and health programs | +0.8% | Global, variable by literacy levels | Short term (≤2 years) |
| Rising Adoption of Telemedicine | +0.5% | Global, with higher impact in remote/rural areas | Short term (≤2 years) |
| Source: Mordor Intelligence | |||
Rising Prevalence of ENT Disorders
Aging populations and deteriorating urban air quality have raised the incidence of chronic rhinosinusitis, otitis media, and sensorineural hearing loss. Hospital registries confirm earlier presentation in metropolitan clinics, while rural patients still arrive with advanced pathologies that often require more invasive interventions. Across the ENT devices market, this epidemiology sustains baseline demand for imaging scopes, balloon dilation kits, and programmable hearing aids. Public health agencies therefore prioritize early screening, which in turn elevates diagnostic instrument placements and stimulates follow-on sales of consumables.
Technological Advancements in ENT Devices
Digital signal processors, narrow-beam microphones, and 4D motion sensors now embed inside premium hearing aids, allowing real-time environmental classification and noise suppression that improve speech recognition. In operating theaters, rigid endoscopes capable of hyperspectral imaging distinguish perfused mucosa from malignancies, enhancing resection margins while limiting bleeding. These breakthroughs reinforce the ENT devices market as a technology-driven arena: manufacturers differentiate through software updates, cloud-based fitting portals, and module-ready components that clip into existing surgical stacks.
Rising Adoption of Minimally Invasive Procedures
Patients increasingly favor techniques that avoid external incisions, catalyzing the shift to balloon sinus dilation, endoscopic ear tube placement, and radiofrequency turbinate reduction. Payers support these methods because length of stay drops, postoperative narcotic use declines, and complication rates fall. Device suppliers respond by bundling disposable navigation probes with imaging software, enabling otolaryngologists to treat chronic sinusitis in office suites[1]. The ENT devices market therefore migrates revenue from capital equipment to single-use accessories and service contracts.
Rising Awareness Campaigns and Health Programs
National initiatives encouraging adults to check their hearing at pharmacies have reduced stigma and revealed unmet need among mild-to-moderate loss sufferers. When combined with 2024 regulations permitting over-the-counter hearing aids, retail channels now route consumers directly to self-fitting devices. Manufacturers amplify these programs via social media tutorials that demystify cochlear implantation, encouraging eligible seniors to pursue surgical candidacy sooner. Heightened consumer literacy thus accelerates adoption across the ENT devices market.
Restraints Impact Analysis of ENT Devices Market*
| Restraint | (~) % Impact on CAGR Forecast | Geographic Relevance | Impact Timeline |
|---|---|---|---|
| High cost of devices | -1.2% | Global, higher in emerging markets | Long term (≥4 years) |
| Device sterilization and maintenance challenges | -0.7% | Global, higher in resource-constrained settings | Medium term (2-4 years) |
| Social Stigma Around Hearing-Aid Use in Emerging Markets | -0.3% | Primarily Asia-Pacific, Middle East, and Africa | Long term (≥4 years) |
| Source: Mordor Intelligence | |||
High Cost of Devices
Fully implanted cochlear systems often list above USD 25,000, a figure beyond the reach of many uninsured adults. Even in countries with national health plans, wait lists persist when reimbursement caps lag inflation. Consequently, only a fraction of clinically eligible patients receive implants, dampening volume expansion inside the ENT devices market. Legislative proposals to reclassify active middle-ear devices as prosthetics aim to unlock Medicare funding and could gradually narrow affordability gaps.
Device Sterilization and Maintenance Challenges
Reusable scopes and suction instruments demand meticulous cleaning cycles that many outpatient centers struggle to maintain. Breakdowns add further downtime because calibrating miniaturized optics requires factory-level expertise. To mitigate risk, some hospitals adopt ultraviolet cabinets validated specifically for ENT endoscopes, while others shift to disposable sheaths despite added per-case expense. The resulting operational burden tempers purchasing decisions, nudging the ENT devices market toward hybrid ownership and outsourced service models.
*Our forecasts treat driver/restraint impacts as directional, not additive. The impact forecasts reflect baseline growth, mix effects, and variable interactions.
ENT Devices Market Segment Analysis
By Product:
Hearing Aids Sustain Leadership While Implantables AccelerateThe hearing-aid segment generated the largest slice of the ENT devices market size with 31.60% revenue in 2025. Cloud-linked firmware updates, lithium-ion rechargeable batteries, and AI-guided scene detection keep replacement cycles near four years, supporting steady unit demand. At the premium tier, integrated health sensors track cardiac rhythm and step counts, expanding device value beyond amplification. Sales also benefit from consumer electronics entrants who position self-fit models next to smartphones, an approach that widens channel exposure without cannibalizing clinic-fitted premium lines.
Implantable devices accounted for a smaller base yet posted the highest forward momentum with a 9.04% CAGR outlook. Innovations such as totally implanted cochlear systems remove external processors, boosting cosmetic appeal and swimming convenience. Surgeons appreciate magnet-guided electrode arrays that reduce cochlear trauma and shorten programming sessions. Favorable long-term outcomes foster payer acceptance, propelling multi-year growth inside the ENT devices market. Diagnostic instruments retain significant share; portable optical-coherence-tomography otoscopes now reveal middle-ear effusions at primary-care desks, broadening early intervention. Surgical device uptake follows the minimally invasive trend, especially balloon sinus kits that occupy ambulatory centers seeking rapid turnover.


By Age Group:
Adult Dominance Continues While Geriatrics Drive Incremental GainsAdults aged 18-64 captured 39.50% of ENT devices market share in 2025 because occupational noise exposure, allergic rhinitis, and chronic tonsillitis peak within working years. This cohort values discreet aesthetics and app-based adjustments, steering product development toward micro-receiver designs and remote fine-tuning. Clinics leverage tele-audiology to deliver follow-ups that fit busy schedules, lowering attrition rates and sustaining recurring revenue.
The geriatric population propels future expansion with a projected 7.38% CAGR as life expectancy lengthens and comorbidities accumulate. Balance disorders, presbycusis, and dysphagia necessitate complex diagnostics, encouraging hospitals to install vestibular chairs and fiberoptic endoscopic swallowing test systems. Manufacturers tailor interfaces with larger buttons, voice prompts, and auto-gain algorithms that compensate for reduced dexterity and cognitive load. Pediatric demand remains clinically vital though proportionally smaller; universal newborn screening pushes early amplification, protecting language development and justifying public subsidies.
By End User:
Hospitals Hold Scale Advantage While Home Care OutpacesHospitals controlled 44.30% of the ENT devices market size in 2025, buoyed by tertiary-care capabilities for implant sessions, revision surgeries, and neurotology cases. Capital purchasing committees favor integrated operating-room platforms that link navigation, endoscopy, and suction through a single console, reducing training complexity. Inpatient volumes remain stable for skull-base and airway reconstruction procedures, anchoring recurring instrument demand.
Home-care settings register the fastest trajectory at 7.65% CAGR as Bluetooth-enabled aids, self-directed cerumen management kits, and cloud-monitored sleep apnea interfaces allow therapy outside institutional walls. Insurers reimburse virtual checkups when outcome data prove equivalent, shifting revenue downstream toward direct-to-consumer fulfillment. ENT clinics preserve mid-market relevance by offering specialized diagnostics unavailable in primary care, while ambulatory surgical centers attract balloon sinus and tonsillectomy cases with bundled cash pricing that appeals to high-deductible plans. Collectively, these dynamics diversify revenue sources throughout the ENT devices market and mitigate macroeconomic shocks.
Geography Analysis
North America ENT Devices Market
North America led the ENT devices market with 37.70% revenue share in 2025. Extensive insurance coverage, veteran tele-audiology networks, and a vibrant research ecosystem accelerate adoption cycles. FDA authorization of consumer earbuds equipped with hearing-aid software underscores regulatory agility and primes retailers for expanded audiology aisles. Hospital groups invest in spectral-imaging endoscopes and revision-ready implant suites to retain referral flows, reinforcing regional spending momentum.
Europe ENT Devices Market
Europe remains a substantive contributor. Public payer systems reimburse most implant costs, though stringent evidence requirements slow initial roll-outs of novel technologies. Regional manufacturers emphasize miniaturization and eco-friendly packaging to align with environmental directives. Cross-border clinical consortia pool data, refining surgical guidelines and informing device redesigns that travel globally through the ENT devices market.
APAC, MEA and South America ENT Devices Market
Asia-Pacific represents the fastest-growing arena with a 6.95% CAGR outlook. Government-backed insurance in China now covers bone-anchored hearing solutions, while India’s Ayushman Bharat program subsidizes sinus surgeries at district hospitals. Domestic suppliers scale mid-tier offerings that balance durability with affordability, narrowing urban–rural access gaps. Start-ups in Korea and Singapore leverage robotics to navigate narrow nasal cavities, exporting intellectual property through licensing deals. Middle East and Africa move gradually yet benefit from teaching-hospital frameworks in Gulf states that import advanced suites and train regional surgeons. South America shows mixed progress as Brazil modernizes otology centers while neighboring countries grapple with funding constraints.
Competitive Landscape
The ENT devices market exhibits moderate concentration; the top five manufacturers command significant combined revenue. Cochlear’s 2024 purchase of a rival’s cochlear implant line consolidates surgical share and integrates a complementary patent portfolio, tightening supplier influence over magnet designs and sound-processor chipsets. Meanwhile, mid-size players specialize in balloon dilation or ultraviolet disinfection, carving niches beyond full-line portfolios[3].
Competitive differentiation hinges on software ecosystems that update remotely and log usage analytics. Firms allocate double-digit revenue shares to research, pursuing full-body health metrics inside earpieces and robot-assisted navigation for complex skull-base access. Consumer-electronics entrants introduce price tension at the lower amplification tiers, yet premium medical models maintain margin leadership through clinician-mediated fitting and multi-channel reimbursement.
Supply-chain resilience emerges as a strategic priority after microphone shortages in 2024. Component companies diversify fab locations and pre-approve alternative ASIC footprints, reducing single-source risk. Sustainability pledges become procurement criteria; vendors highlight recyclable housings and rechargeable batteries that eliminate zinc-air waste. In this environment, scale delivers procurement leverage, while specialization secures protected revenue corridors, collectively shaping the trajectory of the ENT devices market.
ENT Devices Industry Leaders
-
Cochlear Ltd
-
Medtronic PLC
-
Olympus Corporation
-
Stryker Corporation
-
WS Audiology
- *Disclaimer: Major Players sorted in no particular order
ENT Devices Market Companies Covered in this Report
- Cochlear
- Sonova
- Demant
- GN Store Nord
- WS Audiology
- Medtronic
- Stryker
- Smith+Nephew PLC
- Olympus
- Fujifilm Holdings Corp.
- Starkey Laboratories
- Coloplast (Atos Medical AB)
- InHealth Technologies
- Richard Wolf
- Nurotron Biotechnology
- Baxter International (Hill-Rom)
- Acclarent Inc. (J&J)
- Boston Scientific
- Smiths Group
Market Opportunities and Future Outlook
A near-term whitespace for the ENT devices market sits at the intersection of regulated AI decision support and decentralized ear examination. April 2026 FDA De Novo classification for TytoCare's AI-powered eardrum analysis (Tyto Insights for ENT Suite) sets a clearer pathway for software-led otology tools, supporting new workflows in tele-audiology and primary-care screening where portable otoscopy and automated interpretation reduce dependence on specialist availability. In parallel, a string of 2026 US classification orders for electrical stimulation devices (including Class II controls for congestion relief, oropharyngeal stimulation, and tinnitus relief) provides defined special-controls checklists that can reduce regulatory uncertainty for entrants in symptom-management devices adjacent to core ENT care.
On the procedure side, the opportunity concentrates on platforms and disposables that compress OR time and shift volume toward ambulatory and office settings. Medtronic's March 2026 FDA clearance for the Stealth AXiS system for cranial and ENT procedures points to demand for integrated planning, navigation, and robotic enablement, supporting multi-service surgical stacks that can be used across indications. Additional 2026 FDA clearances in middle-ear and office-based interventions, including Tusker Medical's Tula tympanostomy tube delivery device and MED-EL's mWING stapes prosthesis, reinforce momentum in minimally invasive ear care and specialty implants. Connectivity upgrades in active implantables, including Bluetooth LE Audio and Auracast support in Cochlear's Osia 3, extend consumer-style streaming expectations into medical-grade hearing solutions and support software-led upgrade cycles.
Recent Industry Developments in ENT Devices Market
- July 2026: Cochlear Limited received U.S. FDA clearance for the Osia 3 Sound Processor for its bone conduction hearing implant portfolio. The update adds the Zaphium signal processing chip along with Bluetooth LE Audio and Auracast support, which brings connectivity closer to broader consumer audio ecosystems and supports upgrade-led replacement demand.
- June 2026: Medtronic received CE Mark for the Stealth AXiS surgical navigation system for ear, nose, and throat procedures. The European authorization expands commercial reach for a unified planning and navigation platform, supporting hospital standardization across cranial and ENT workflows.
- November 2024: Envoy Medical received FDA clearance to launch a pivotal study evaluating the fully implanted Acclaim cochlear device with no external hardware. The study clearance advances clinical evidence generation for totally implanted hearing solutions, a differentiator for patients focused on cosmetic discretion and continuous-use convenience.
ENT Devices Market Report Scope and Research Methodology
Market Definition and Coverage
For this study, the ENT devices market is defined as the value of medical devices used to diagnose, monitor, or treat ear, nose, and throat conditions across care settings, including related procedural and patient-use devices sold through standard clinical channels.
Scope exclusions: We exclude general hospital consumables not specific to ENT care, and we also exclude pharmaceuticals and standalone digital apps that are not sold as part of a device offering.
Segments Covered in This Report
- By Product
- Diagnostic Devices
- Endoscopes (Rigid, Flexible)
- Hearing Screening Devices (OAE, Tympanometry)
- Surgical Devices
- Powered Surgical Instruments
- Balloon Sinus Dilation Systems
- CO? & Diode Lasers
- ENT Supplies & Consumables (Stents, Ear Tubes)
- Hearing Aids
- Behind-the-Ear (BTE)
- In-the-Ear / In-the-Canal (ITE/ITC)
- Receiver-in-Canal (RIC)
- Over-the-Counter (OTC) Hearing Aids
- Implantable Devices
- Cochlear Implants
- Bone-Anchored Hearing Aids (BAHA)
- Image-Guided Surgery Navigation Systems
- Other Products
- Diagnostic Devices
- By Age Group
- Pediatric (0-17 Years)
- Adult (18-64 Years)
- Geriatric (65+ Years)
- By End User
- Hospitals
- ENT Clinics
- Ambulatory Surgical Centers (ASCs)
- Home-care
- Geography
- North America
- United States
- Canada
- Mexico
- Europe
- Germany
- United Kingdom
- France
- Italy
- Spain
- Rest of Europe
- Asia-Pacific
- China
- Japan
- India
- South Korea
- Australia
- Rest of Asia-Pacific
- Middle East and Africa
- GCC
- South Africa
- Rest of Middle East and Africa
- South America
- Brazil
- Argentina
- Rest of South America
- North America
Data Sources, Market Sizing, and Validation
Desk Research
Desk research started with building a clean map of procedures, device usage, and reimbursement and regulatory signals that influence adoption. We leaned on public health statistics and disease burden sources such as the World Health Organization, US CDC, OECD health data, and national health ministries, which helped anchor patient pools and diagnosis patterns.
To translate demand into market value, we used import and export statistics (such as UN Comtrade and national customs dashboards), medical device adverse event and product databases (such as FDA MAUDE and similar public registries), and peer reviewed clinical literature that tracks procedure volumes and technology shifts. Company annual reports, investor decks, and credible press were then used to sanity check the product mix and pricing direction, and paid subscriptions for company financials and patents were used selectively to fill gaps on smaller, private participants. These examples are not exhaustive, and many other public sources were also used for data collection, validation, and research clarification.
Primary Interviews and Surveys
Primary work focused on interviews and short surveys with ENT clinicians, hospital procurement teams, distributors, and device product managers across major regions, so assumptions from desk research could be corrected where they were too broad. Pricing logic, typical replacement cycles, and the split between inpatient and outpatient settings were clarified in these discussions, and then rechecked across more than one respondent type to reduce single point bias.
Distribution of primary research fieldwork respondents
| Company type | Respondent position | Region |
|---|---|---|
| Top tier: 26% | CXOs: 16% | APAC: 45% |
| Mid tier: 57% | Functional/Unit leaders: 28% | EMEA: 32% |
| Smaller Players: 17% | Managers: 56% | Americas: 23% |
Market-Sizing & Forecasting
Sizing was first constructed using a top-down approach where procedure volumes and treated patient pools were translated into device demand by applying usage rates and typical device-per-procedure norms, and then converted to value using region-specific average selling price ranges. To keep the model realistic, results were corroborated with selective bottom-up approximations, including supplier revenue roll ups for key product categories, sampled ASP x volume checks from distributors, and cross checks against trade flows where relevant.
Inputs that materially moved the model included hearing loss prevalence and screening rates, ENT endoscopy and sinus procedure volumes, adoption of minimally invasive techniques, replacement cycles for hearing aids and implant systems, and the pricing mix shift between premium and entry devices. Forecasting used scenario analysis supported by simple time-series smoothing for procedure growth, where drivers such as aging population trends, access to ENT clinics, and reimbursement stability were varied within ranges validated by interviews. When country-level detail was thin, gaps were handled by applying regional analogs tied to healthcare spending per capita and known procedure intensity, and then reconciled back to regional totals.
Data Validation & Update Cycle
Validation was done in several passes, where model outputs were compared against independent signals such as procedure statistics, public financial disclosures, and trade and regulatory indicators, and then checked again after currency and inflation handling. If a country or product line showed a step change that did not match known events, assumptions were reopened and, when needed, respondents were re-contacted to explain the variance.
Before sign-off, an internal analyst review checks calculations, definitions, and year mapping so the final numbers stay consistent across all cuts. Reports are refreshed annually, and interim updates are made when major policy changes, large product launches, or abnormal demand shocks occur. Right before delivery, we do a fresh pass on key inputs so clients receive the most current view available at that time.
Mordor Intelligence's Global Ent Devices Market Market Size Compared Against Other Published Estimates
Published market sizes for ENT devices often do not match each other because each publisher makes different choices on what products to include, which year is treated as the anchor, and how pricing is projected across regions. Differences also come from how procedure volumes are estimated, how currency conversion timing is handled, and whether forecasts assume a steady environment or a more aggressive adoption curve.
In this market, the biggest gaps usually show up around whether hearing aids and implantable hearing systems are fully counted, how office-based ENT procedures are treated versus hospital procedures, and whether factory-gate revenue is mixed with downstream channel markups. Another common driver is the way average selling prices are trended, since some estimates hold ASPs flat while others bake in premiumization and technology upgrades. Here, the market is kept tied to procedure and patient signals and then cross-checked against product mix and pricing discussions, which reduces drift when volume growth and ASP growth move in opposite directions.
Benchmark comparison
| Source | Market Size | Gaps in Research Methodology |
|---|---|---|
| Mordor Intelligence | USD 30.43 B (2026) | |
| Global Publisher A | USD 38.75 B (2026) | This estimate aligns to factory-gate revenue logic and includes broad device groupings, but the higher value suggests a wider product basket and faster near-term growth assumptions that can pull forward premium device adoption. |
| Global Publisher B | USD 23.73 B (2026) | The lower figure is consistent with a narrower counted scope and more conservative conversion from diagnosed patients to device purchases, which can understate replacement-driven demand in mature hearing categories. |
Across the three figures, the spread is largely explained by how hearing-related categories, replacement cycles, and ASP progression are treated in the near term, and whether adjacent items are folded into the definition. Keeping procedure-linked demand and pricing logic explicit helps the estimate remain traceable, and that is why the 2026 value lands where it does for Mordor Intelligence.
Key Questions Answered in the Report
What is the current valuation of the ENT devices market?
The ENT devices market size reached USD 30.43 billion in 2026 and is projected to grow steadily through 2031.
Which product category generates the most revenue in ENT devices?
Hearing aids account for the largest share, delivering 31.60% of global revenue in 2025 due to continuous feature upgrades and short replacement cycles.
Which region is expanding the fastest for ENT solutions?
Asia-Pacific is the fastest-growing region, supported by healthcare infrastructure investment and a 6.95% forecast CAGR between 2026-2031.
Why are implantable devices gaining momentum?
Fully implanted cochlear systems improve aesthetics and convenience, driving a 9.04% segment CAGR over the next five years.
How is home-based care influencing market dynamics?
Smartphone-linked hearing aids, remote programming, and tele-audiology services are pushing a 7.65% CAGR in the home-care end-user segment.
What factors restrain broader adoption of advanced ENT technology?
High upfront device costs and the stringent sterilization requirements for reusable equipment remain primary barriers, especially in emerging markets.