
Engineering Services Outsourcing Market Size and Share
Market Overview
| Study Period | 2020 - 2031 |
|---|---|
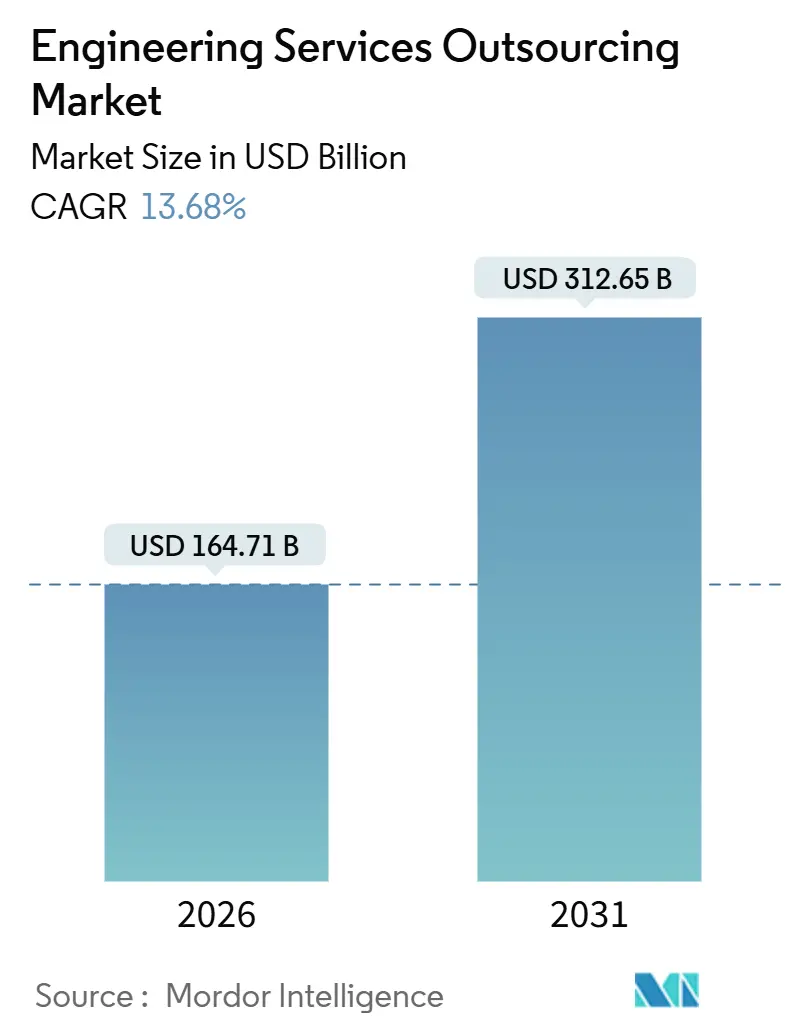
| Market Size (2026) | USD 164.71 Billion |
| Market Size (2031) | USD 312.65 Billion |
| Growth Rate (2026 - 2031) | 13.68 % |
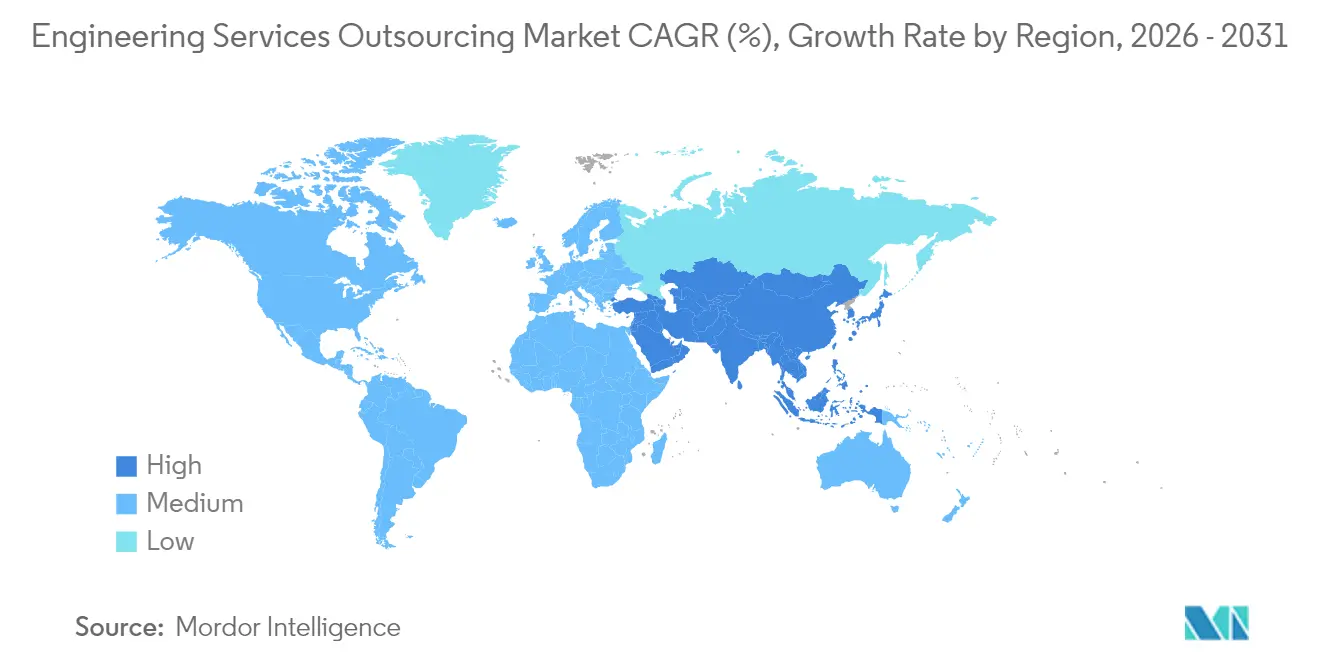
| Fastest Growing Market | Middle East and Africa |
| Largest Market | Asia Pacific |
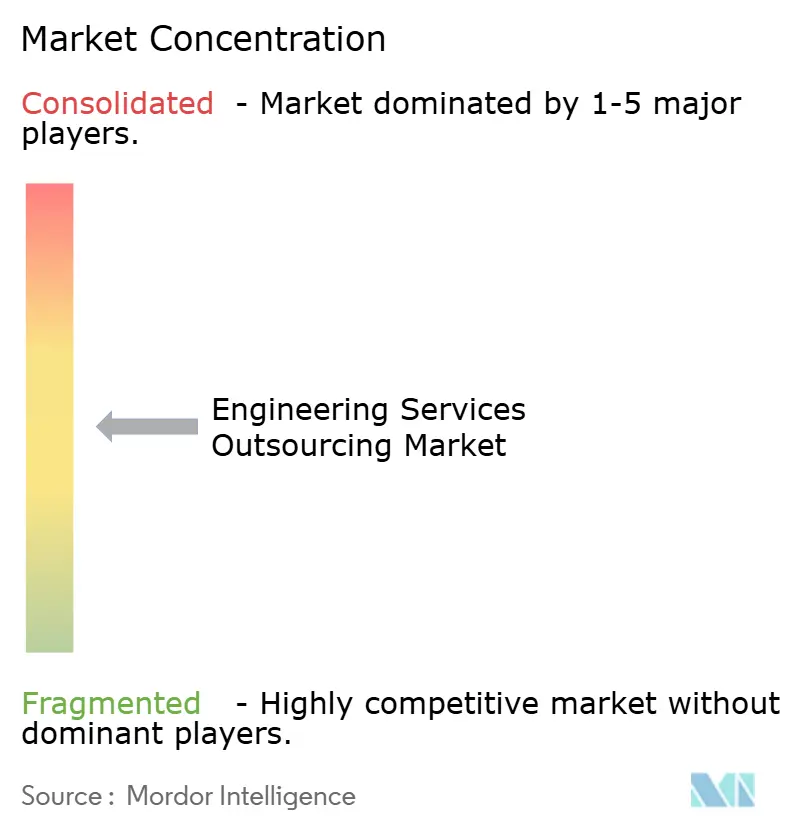
| Market Concentration | Medium |
Major Players *Disclaimer: Major Players sorted in no particular order Image © Mordor Intelligence. Reuse requires attribution under CC BY 4.0. | |
Engineering Services Outsourcing Market Analysis by Mordor Intelligence
The Engineering Services Outsourcing Market size is estimated at USD 164.71 billion in 2026, and is expected to reach USD 312.65 billion by 2031, at a CAGR of 13.68% during the forecast period (2026-2031). Software-defined product road maps are shortening design cycles, geopolitical tensions are rerouting work to balanced delivery footprints, and AI-augmented computer-aided engineering is compressing validation timeframes. Providers now function as strategic R&D extensions rather than tactical cost centers, a shift that redefines pricing models, contract scopes, and vendor selection criteria. Capital expenditure controls at original-equipment manufacturers (OEMs) reinforce outsourcing uptake, while domain-specific talent shortages raise demand for partners that meld software skills with deep engineering know-how. These converging forces collectively sustain double-digit growth across the engineering services outsourcing market.
Key Report Takeaways
- By service type, Product Engineering commanded 29.02% of the engineering services outsourcing market share in 2025, whereas Digital Engineering and Software is advancing at a brisk 14.35% CAGR through 2031.
- By end user, Automotive and Transportation led with 28.55% revenue share in 2025; Aerospace and Defense is forecast to expand at a 13.12% CAGR to 2031.
- By delivery model, offshore hubs retained a 69.85% share of the engineering services outsourcing market size in 2025, while near-shore models are slated to grow at a 13.98% CAGR over the same horizon.
- By client size, large enterprises accounted for 59.78% of the engineering services outsourcing market size in 2025; small and mid-sized enterprises are on track for a 12.92% CAGR through 2031.
- By geography, Asia-Pacific dominated at 41.92% in 2025, yet the Middle East and Africa region is accelerating at a 15.21% CAGR through 2031.
Note: Market size and forecast figures in this report are generated using Mordor Intelligence’s proprietary estimation framework, updated with the latest available data and insights as of 2026.
Market Trends and Insights
Drivers Impact Analysis of Engineering Services Outsourcing Market*
| Driver | (~) % Impact on CAGR Forecast | Geographic Relevance | Impact Timeline |
|---|---|---|---|
| Acceleration of software-defined product road maps | +3.2% | North America, Europe, global spillover | Medium term (2-4 years) |
| Rising cost pressure on OEM R&D budgets | +2.8% | APAC hubs, global | Short term (≤ 2 years) |
| Near-shoring demand amid geopolitical risk diversification | +2.1% | North America, EU, Mexico, Eastern Europe | Medium term (2-4 years) |
| Talent shortages in advanced engineering domains | +1.9% | North America, Western Europe, global | Long term (≥ 4 years) |
| AI-augmented CAE and digital twin adoption | +1.7% | Global early adopters | Long term (≥ 4 years) |
| Sustainability-driven re-engineering of legacy products | +1.2% | Europe, North America, and expanding APAC | Medium term (2-4 years) |
| Source: Mordor Intelligence | |||


Acceleration of Software-Defined Product Road Maps
OEMs shifting to software-centric architectures now channel as much as 40% of R&D budgets toward code development, creating sustained workloads for embedded systems, connectivity stacks, and cybersecurity validation. Continuous over-the-air update models require partnering with firms that can maintain digital twins and deliver agile releases throughout operating lifecycles. The heightened integration of mechanical, electronic, and software layers raises complexity beyond many in-house teams, elevating demand for full-stack engineering partners that bridge vehicle-to-everything protocols with legacy drivetrain design.
Rising Cost Pressure on OEM R&D Budgets
Economic volatility and supply-chain shocks press manufacturers to convert fixed engineering headcount into variable project-based spending. Outsourcing cushions CAPEX swings by offering elastic capacity and specialized skills for domains such as additive-manufacturing optimization or IoT sensor validation. Semiconductor leaders illustrate the trend by reallocating FPGA front-end design and embedded firmware tasks to external partners that already possess certified toolchains and seasoned staff. Consolidation among service vendors also accelerates as buyers streamline rosters toward fewer, multi-disciplinary suppliers capable of turnkey delivery.
Near-Shoring Demand amid Geopolitical Risk Diversification
Legislation such as the CHIPS and Science Act incentivizes domestic design while data-sovereignty rules limit cross-border transfer of sensitive files. Providers in Mexico, Poland, and Vietnam capitalize on proximity, language alignment, and aligned legal frameworks to secure projects once shipped to distant offshore centers. Initiatives like Accenture’s sovereign-cloud engineering services demonstrate how localized delivery coupled with cloud-native security satisfies national requirements without sacrificing collaboration efficiency.
Talent Shortages in Advanced Engineering Domains
Global deficits in areas like AI-augmented simulation, neuromorphic chip design, and secure edge computing boost bill rates for niche specialists. Engineering service providers respond with university partnerships, upskilling curricula, and internal AI-assisted design pipelines that multiply output per engineer. Scarcity premiums lift overall pricing power and reinforce the engineering services outsourcing market’s value-creation narrative rather than pure labor arbitrage[1]National Science Foundation, “Engineering Workforce Statistics 2025,” nsf.gov.
Restraints Impact Analysis of Engineering Services Outsourcing Market*
| Restraint | (~) % Impact on CAGR Forecast | Geographic Relevance | Impact Timeline |
|---|---|---|---|
| IP and data-sovereignty concerns | -2.3% | Global, acute in defense and telecom | Short term (≤ 2 years) |
| Fragmented standards across industries | -1.8% | Variable by vertical | Medium term (2-4 years) |
| Wage inflation in traditional offshore hubs | -1.5% | India, Philippines, APAC core | Short term (≤ 2 years) |
| High switching costs for long-term engineering programs | -1.2% | Aerospace, automotive | Medium term (2-4 years) |
| Source: Mordor Intelligence | |||
IP and Data-Sovereignty Concerns
Defense, telecom, and healthcare OEMs must keep sensitive design artifacts within compliant jurisdictions, narrowing vendor pools and extending procurement cycles. Regulations like ITAR restrict aerospace projects to approved domestic providers, trimming the accessible pie for cost-efficient offshore shops. Service partners invest in zero-trust collaboration platforms and blockchain-enabled audit trails, yet national policies still slow cross-border scaling, keeping certain high-value segments insular[2]United States Department of Defense, “ITAR Compliance Requirements for Technical Data,” defense.gov.
Fragmented Standards across Industries
Divergent frameworks, ISO 26262 for automotive functional safety versus DO-178C for avionics software, force service firms to maintain multiple certification tracks and tools, eroding economies of scale. As software content rises, new cyber-safety norms overlay onto mechanical rules, compounding complexity. Limited harmonization means providers can rarely cross-utilize resources seamlessly between sectors, dampening margin leverage even amid rising demand[3]European Commission, “Proposal to Revise the Machinery Directive,” europa.eu.
*Our forecasts treat driver/restraint impacts as directional, not additive. The impact forecasts reflect baseline growth, mix effects, and variable interactions.
Engineering Services Outsourcing Market Segment Analysis
By Service Type:
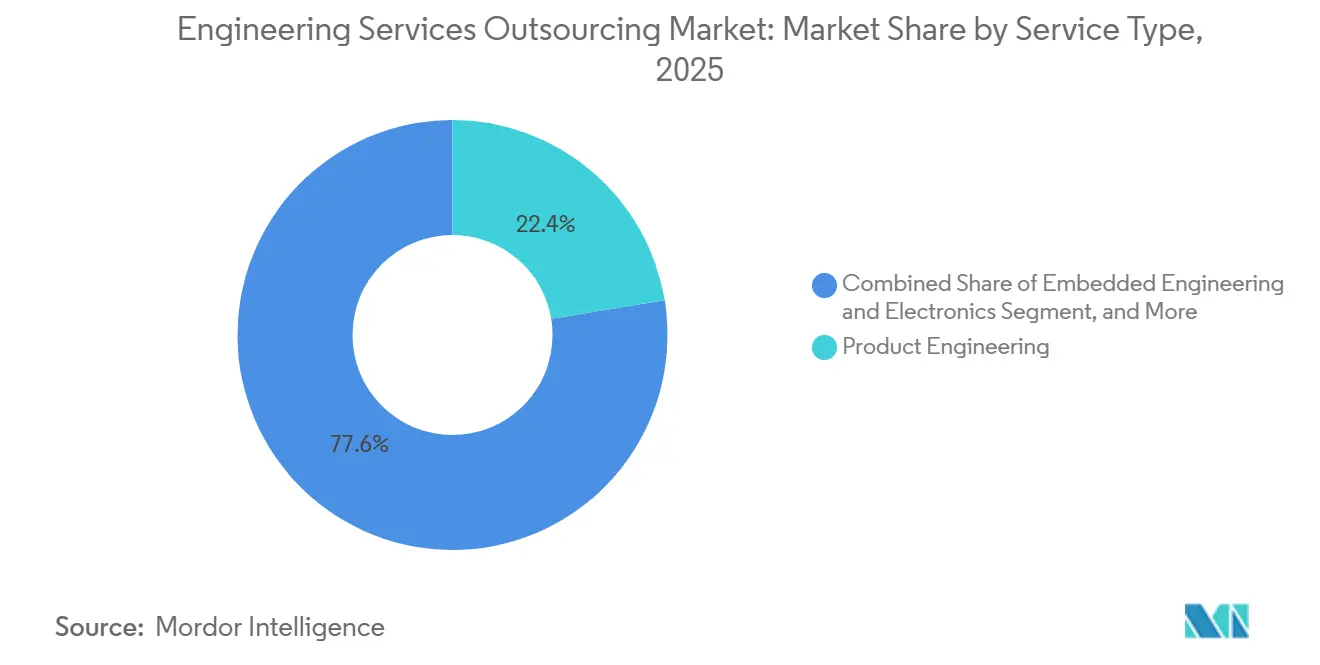
Digital Engineering Champions Platform TransformationDigital Engineering and Software generated the fastest trajectory with a 29.97% CAGR, propelled by electric-vehicle operating systems, industrial IoT stacks, and cloud-native product life-cycle management rollouts. Providers embed DevOps pipelines, model-based systems engineering, and containerized microservices that allow continuous feature releases across multi-domain products. Product Engineering maintained its dominance at 22.42% of 2025 revenue in the engineering services outsourcing market, underpinning core mechanical design, structural analysis, and materials engineering, which remain indispensable across industries. Upskilling efforts now blend AI-augmented finite-element analysis with traditional CAD workflows, accelerating iteration cycles. Embedded Engineering and Electronics grows as edge AI chips proliferate; Verification, Validation, and Compliance services expand in response to autonomy regulations. Sustenance and Value Engineering gain relevance as circular-economy mandates spur redesigns aimed at material efficiency. Collectively, providers are evolving toward integrated platforms rather than siloed offerings, enabling clients to orchestrate ideation-to-launch under a single governance structure.
The engineering services outsourcing market rewards firms that deliver modular service bundles aligned to agile sprints, allowing OEMs to consume discrete digital assets on demand. Digital twin libraries shorten prototype loops, while automated test rigs lower human error in compliance validation. Cloud-native prototyping trims capital investment for physical labs, shifting cost focus from hardware to simulation accuracy. System Integration offerings increasingly include cyber-resilient architectures to safeguard connected assets. As a result, service-type silos blur, positioning full-stack partners for cross-selling at scale.


By End User:
Aerospace and Defense Drives Premium GrowthThe engineering services outsourcing market share for Automotive and Transportation was 18.67% in 2025, with a 19.79% CAGR, bolstered by electrification, battery-thermal models, and autonomous driving algorithms. The complexity of software-defined vehicles, along with regulations such as UNECE R-155 on cybersecurity, compels OEMs to rely on external specialists to orchestrate hardware-software convergence.
Aerospace and Defense, fleets modernize with composite materials, hydrogen propulsion studies, and next-generation avionics. Defense primes re-channel engineering spend toward resilient satellite communications and unmanned aerial systems, segments that demand certified supply chains and secure data environments. Industrial Equipment clients leverage digital twins for predictive maintenance, whereas Consumer Electronics players outsource commodity mechanical tasks to free in-house teams to focus on user-interface differentiation. Semiconductor firms, facing chronic analog-design shortages, outbid other industries for niche expertise, inflating rates in that micro-segment.
Energy and Utilities customers engage service partners for grid-optimization analytics and renewable-integration models, while Oil and Gas firms emulate downstream asset-integrity programs pioneered in chemicals. Medical Device makers, contending with ISO 13485 and FDA 21 CFR Part 820 audits, outsource design-for-manufacturing and human-factor testing to reduce non-conformance risk. Telecom and Networking clients require 5G O-RAN interoperability and edge-cloud orchestration, areas where cross-disciplinary teams span RF, software, and security competencies. The diversified demand profile sustains robust growth across verticals, even as each vertical applies unique compliance gates that shape provider qualification strategies.
By Delivery Model:
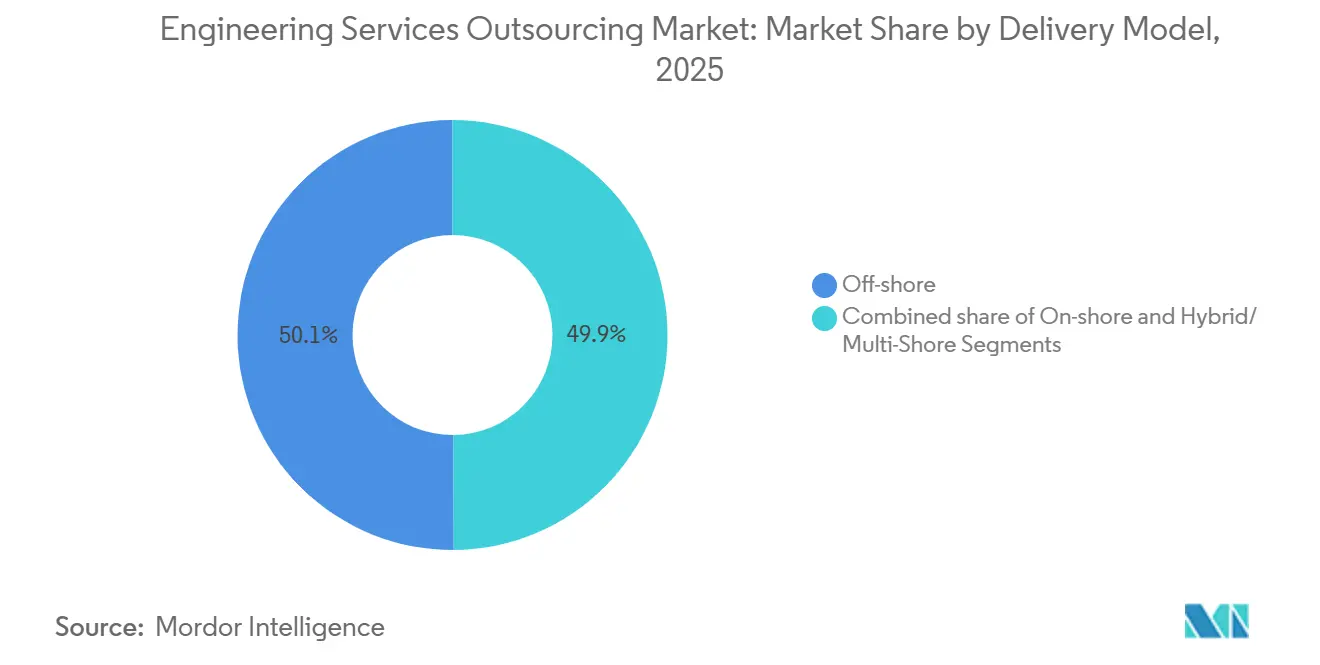
Near-Shore Gains Strategic ImportanceOffshore hubs still anchored 34.10% of 2025 revenue in the engineering services outsourcing market, reflecting decades-long talent pipelines in India and Eastern Europe. The engineering services outsourcing market continues to exploit currency differentials and mature process frameworks in these regions. Yet near-shore locations are advancing at 43.95% CAGR through 2031 as geopolitics, time-zone overlap, and data-location statutes converge to redefine proximity benefits.
Hybrid models emerge in which providers split sensitive firmware tasks between compliant onshore centers and offshore centers for non-classified simulation workloads. Outcome-based contracts diminish the centrality of hourly labor costs, enabling near-shore teams to compete on innovation velocity and domain familiarity. Enhanced collaboration tools narrow distance frictions, but compliance regimes keep certain workloads fenced within prescribed jurisdictions, cementing regional centers’ roles.
Time-zone alignment optimizes agile cadence by allowing daily stand-ups without nocturnal shifts. Linguistic and cultural affinity improves design-review clarity, reducing rework. Providers in Poland, Portugal, and Mexico gain traction by coupling European or North American language fluency with STEM graduates versed in modern toolchains. Automation parity means wage inflation in traditional offshore hubs narrows cost gaps versus near-shore peers, further equalizing economics. As a result, delivery-model selection becomes a portfolio decision balancing cost, compliance, and collaborative efficiency rather than a singular focus on rate arbitrage.
By Client Size:
SMEs Embrace Democratized EngineeringLarge enterprises accounted for 77.48% of the engineering services outsourcing market in 2025, recording a 71.82% CAGR to 2031. They leverage mature vendor-management offices, multi-year master service agreements, and co-innovation labs that tie partners into long-range product strategies. These buyers continue to drive volume, but growth momentum is shifting toward small- and mid-sized enterprises (SMEs).
Cloud-based CAD/PDM stacks reduce up-front software licensing, letting SMEs access the same tool maturity that once only global majors could afford. Platform-as-a-service providers offer pay-as-you-go simulation hours and AI-assisted design wizards, amplifying lean engineering teams. Subscription pricing and self-service portals simplify onboarding, while marketplaces match specialized freelancers to niche tasks. SMEs value outcome-aligned contracts that fit variable cash flows, prompting providers to craft modular service catalogs.
Regulatory burdens pose a hurdle for smaller firms, so vendors differentiate by offering turnkey documentation packs, certification checklists, and regulatory liaison services. The engineering services outsourcing industry benefits as SME innovators in robotics, smart-agriculture equipment, and clean-tech devices outsource subsystems to accelerate first-to-market timelines. As democratized tooling spreads, the addressable client base broadens beyond tier-1 suppliers to a long tail of emerging manufacturers, compounding total market opportunity.
Geography Analysis
APAC Engineering Services Outsourcing Market
Asia Pacific held 41.92% of global revenue in 2025 in the engineering services outsourcing market, anchored by India’s expansive talent pool and China’s scale in manufacturing engineering. Wage inflation, however, compresses labor-cost differentials, nudging providers to layer automation on top of human expertise. India invests in upskilling through national AI centers, positioning its workforce for digital twin and analytics tasks. China advances smart-factory blueprints, melding robotics with cloud-native SCADA, yet faces export-control headwinds that shift advanced aerospace contracts to alternative sites. Vietnam and the Philippines cultivate specialized niches: Vietnam in embedded firmware, the Philippines in animation engineering for infotainment, diversifying regional portfolios.
MEA Engineering Services Outsourcing Market
The Middle East and Africa are seeded by Gulf-state Vision 2030 diversification programs. Saudi Arabia’s NEOM smart-city project catalyzes demand for green hydrogen, IoT, and intelligent infrastructure engineering; the UAE channels sovereign wealth funds into aerospace MRO and advanced composite R&D hubs. South Africa enters renewable-energy plant design outsourcing, while Egypt leverages multilingual talent for European near-shore work. Investment in STEM education accelerates, yet talent pipelines remain immature, requiring ongoing partnerships with global universities and technology vendors.
North America, Europe and LATAM Engineering Services Outsourcing Market
North America held 35.07% global revenue of 2025 in the engineering services outsourcing market, and exhibits the fastest trajectory at 34.12% CAGR through 2031, continues to purchase high-value scopes, especially for defense platforms and autonomous truck pilots. CHIPS Act incentives stimulate domestic semiconductor design centers, bolstering local outsourcing within secure enclaves. Europe emphasizes eco-design and circular-economy compliance; strict GDPR and emerging cyber-resilience mandates steer workloads to regional providers offering certified data environments. Eastern European countries, notably Poland and Romania, win spillover contracts from Western Europe thanks to EU-aligned regulations and competitive cost structures. Latin America expands slowly but gains recognition for Spanish-language technical documentation and agile collaboration, overlapping U.S. work hours.

Regulatory Landscape
Engineering services outsourcing operates under cross-border trade and domestic-services rules that influence how technical work, tools, and data move between jurisdictions. The WTO General Agreement on Trade in Services (GATS) provides a global baseline, emphasizing transparency and objective, non-discriminatory requirements for services regulation, which affects how engineering providers structure delivery when contracts span multiple countries.
On the technical side, standards bodies and sector regulators indirectly shape outsourced engineering through compliance mandates embedded in product development. ASME has highlighted the role of international standards and the WTO Technical Barriers to Trade (TBT) principles in reducing friction for engineering and manufacturing-related work, while buyer-side compliance regimes (for example, ITAR constraints cited in the report context for aerospace technical data) continue to steer sensitive scopes toward approved onshore or sovereign delivery setups.
Value Chain Analysis
The engineering services outsourcing value chain starts with client-side product strategy and requirements definition, then runs through outsourced execution across concept and industrial design, detailed engineering, CAE and simulation, embedded engineering and software development, verification and validation, and prototyping and NPI. Providers then extend into sustenance and value engineering, localization, and end-of-life support, increasingly tying these activities to digital thread enablers such as PLM, DevOps pipelines, and digital twins that support continuous updates for software-defined products.
Program governance and toolchain integration coordinate delivery, with distributed teams across onshore, near-shore, and offshore centers. Commercial constructs are shifting from effort-based staffing to outcome-oriented engagements, where providers bundle domain expertise with system-level capabilities (for example, integrated software, mechanical, and compliance delivery). Secure collaboration environments also support IP and data-sovereignty requirements highlighted in the report context.
Competitive Landscape
The engineering services outsourcing market displays moderate fragmentation. Indian IT majors such as Tata Consultancy Services, Infosys, and HCLTech scale horizontal offerings by combining software services with mechanical design, while niche specialists such as Cyient focus on aerospace certification, and L&T Technology Services excels in industrial automation. Consolidation accelerates: Cognizant acquired Belcan for USD 1.3 billion in 2024 to fuse regulated aerospace capabilities with cloud-native DevOps.
Technology differentiation is increasingly decisive. Providers deploy AI-driven generative design tools that slash iteration cycles and reduce dependency on scarce senior engineers. Digital-twin platforms integrated with product life-cycle management systems enable continuous, revenue-generating post-launch services. Lear Corporation’s February 2025 purchase of StoneShield Engineering broadens its automation portfolio for complex wire-harness production, signaling OEMs’ appetite for vertical integration.
Geographic diversification strategies surface as buyers seek resilience. Mid-tier firms build satellite centers in Mexico, Portugal, and Vietnam to hedge geopolitical and currency risk. Secure engineering centers meeting ITAR, FedRAMP, or GDPR standards command premium rates, erecting barriers to entry. Emerging white-space opportunities in quantum computing, neuromorphic chips, and sustainable-materials R&D invite academic-industry consortia to bid alongside traditional vendors, adding new flavors of competition.
Talent ecosystems become strategic assets; firms partner with universities to curate curricula around model-based systems engineering, functional safety, and AI ethics. Hackathons and open-source community contributions burnish employer brands, aiding recruitment in tight labor markets. As contract scopes evolve toward joint IP ownership and co-investment, providers that can shoulder risk and deliver outcome-based commitments capture larger wallet share.
Engineering Services Outsourcing Industry Leaders
Tata Consultancy Services (TCS)
Infosys
HCLTech
Wipro
Tech Mahindra
- *Disclaimer: Major Players sorted in no particular order
Engineering Services Outsourcing Market Companies Covered in this Report
- Tata Consultancy Services (TCS)
- Infosys Limited
- HCL Technologies Limited
- Wipro
- Tech Mahindra Limited
- Cognizant
- Capgemini Engineering
- Accenture
- IBM Corporation
- L&T Technology Services Limited.
- Cyient
- Alten Group
- AKKA Technologies (Akkodis)
- QuEST Global
- EPAM Systems, Inc.
- Persistent Systems
- Luxoft (DXC)
- Tata Technologies
- KPIT Technologies
- GlobalLogic Inc.
- RLE International
- ASAP Holdings

Market Opportunities and Future Outlook
Near-shore and sovereign delivery footprints create whitespace for clients that face data-location, IP, and compliance constraints that limit fully offshore execution, especially in regulated verticals such as aerospace and defense. The report context also points to policy pull-through, including the CHIPS and Science Act influencing domestic design activity, along with the rise of secure engineering centers aligned to frameworks and standards such as ITAR, FedRAMP, and GDPR. For providers, the opportunity is to deliver compliant toolchains and segregated programs without breaking agile collaboration.
AI-enabled engineering execution is expanding the service envelope beyond traditional design and validation into AI advisory, data preparation, agent management, and AI governance closer to client operating models. 2026 deal activity reinforces this shift: TCS highlighted AI-led transformation work, including an AI-led business transformation contract with SKF, plus other AI-powered managed services engagements, while HCLTech signed a seven-year agreement with Guardian focused on AI-powered modernization and expanded capacity through the acquisition of Guardian India to form a dedicated Strategic Business Unit. Together, these moves indicate sustained demand for partners that combine engineering domain depth with enterprise AI delivery, secured environments, and multi-year modernization operating models, rather than project-only execution.
Recent Industry Developments in Engineering Services Outsourcing Market
- July 2026: Tata Consultancy Services secured a multi-year contract to modernize ABB network operations with AI-driven service architecture. The deal expands AI driven modernization into industrial networking, strengthening a network-as-a-service delivery model.
- July 2026: HCLTech announced a seven-year agreement with Guardian Life Insurance and acquisition of Guardian India to form a dedicated Strategic Business Unit for AI-powered modernization. The expansion accelerates captive capability and AI enabled transformation for large financial clients.
- June 2026: HCLTech entered multi-year strategic partnership with Volkswagen Group subsidiary e.solutions to develop Android Automotive based infotainment and connectivity platforms including HMI software. The collaboration strengthens automotive software capabilities and accelerates next-gen vehicle software ecosystems.


Engineering Services Outsourcing Market Report Scope and Research Methodology
Market Definition and Coverage
For this methodology, the engineering services outsourcing market covers third-party engineering work delivered under a paid contract, where external providers support product and asset engineering across design, development, testing, and related services for client organizations.
Scope exclusions: It does not count in-house captive engineering teams, unpaid open-source contributions, or pure IT managed services that do not include an engineering work scope.
Segments Covered in This Report
- By Service Type
- Product Engineering (Mechanical/Mechatronics, Concept and industrial design, CAE/Simulation)
- Embedded Engineering and Electronics (PCB/PCBA, FPGA/ASIC front-end, firmware)
- Digital Engineering and Software
- Verification, Validation and Compliance (V&V, HIL/SIL/MIL, certification)
- Prototyping and NPI
- Sustenance / Value Engineering (VAVE, re-engineering, localization, EOL)
- System Integration
- By End User
- Automotive and Transportation
- Industrial Equipment and Machinery
- Consumer Electronics
- Semiconductors
- Oil and Gas
- Telecom and Networking
- Aerospace and Defense
- Energy and Utilities
- Medical Devices
- Other End Users
- By Delivery Model
- On-shore
- Off-shore
- Hybrid/ Multi-Shore
- By Client Size
- Large Enterprises
- Small and Mid-sized Enterprises (SMEs)
- By Geography
- North America
- United States
- Canada
- Mexico
- South America
- Brazil
- Argentina
- Peru
- Rest of South America
- Europe
- United Kingdom
- Germany
- France
- Italy
- Spain
- BENELUX (Belgium, Netherlands, and Luxembourg)
- NORDICS (Denmark, Finland, Iceland, Norway, and Sweden)
- Rest of Europe
- Asia-Pacific
- China
- India
- Japan
- Australia
- South Korea
- ASEAN (Indonesia, Thailand, Philippines, Malaysia, Vietnam)
- Rest of Asia-Pacific
- Middle East and Africa
- Saudi Arabia
- United Arab Emirates
- Qatar
- Kuwait
- Turkey
- Egypt
- South Africa
- Nigeria
- Rest of Middle East and Africa
- North America
Data Sources, Market Sizing, and Validation
Desk Research
Desk research is used to set the outer boundaries of the market and to build a consistent set of drivers that can be tracked across regions. We rely on public statistics and reputable references such as OECD and World Bank macro series, US Bureau of Labor Statistics engineering wage indicators, Eurostat industry activity data, and UN Comtrade trade flows for relevant engineering-intensive goods.
To translate these signals into market inputs, we also review company filings and annual reports, investor presentations, reputable business press, and industry association publications that discuss engineering spend patterns and outsourcing adoption. Where needed, paid subscriptions supporting company financials and intelligence, news and financials, and patent databases are used as cross-checks on R&D intensity and innovation cycles. The sources listed here are illustrative, and additional references were used for data collection, validation, and clarification.
Primary Interviews and Surveys
Primary work is used to pressure-test the demand pool and the price and mix assumptions that desk research cannot show clearly. We speak with a balanced set of respondents from service providers, client-side engineering and procurement leaders, and domain specialists across major delivery and buying regions. The feedback is then used to refine adoption rates, contract scope boundaries, and realistic pricing movement.
Distribution of primary research fieldwork respondents
| Company type | Respondent position | Region |
|---|---|---|
| Top tier: 39% | CXOs: 18% | APAC: 48% |
| Mid tier: 43% | Functional/Unit leaders: 30% | EMEA: 30% |
| Smaller Players: 18% | Managers: 52% | Americas: 22% |
Market-Sizing & Forecasting
Sizing starts with a top-down build where engineering spend and outsourcing penetration are reconstructed by region and major end markets, then adjusted for the share of work that is actually delivered by third-party ESO contracts. The totals are checked with selective bottom-up approximations, such as sampled provider revenue disclosures, channel checks on typical deal sizes, and an ASP times headcount productivity view where disclosure is thin.
Key model inputs include R&D and engineering intensity trends by industry, engineering wage inflation and offshore-onshore mix, utilization and hiring signals in engineering roles, the share of work moving to managed engineering programs, and the pace of product redesign cycles in engineering-heavy sectors. Because the data is uneven across geographies, gaps are handled through proxy indicators, followed by expert-led normalization to keep outliers from distorting the final total.
For forecasting, scenario analysis is used so growth is not forced into a single curve when budgets tighten or when reshoring changes delivery footprints. The scenario paths are anchored to leading indicators like corporate R&D guidance, engineering headcount demand, and outsourcing intent from interviews, and the final forecast is set after the assumptions align across regions.
Data Validation & Update Cycle
Validation is done through several rounds of cross-checks, starting with consistency tests across regions, currencies, and time series. Model outputs are compared with independent signals such as R&D spend direction, engineering labor market tightness, and disclosed outsourcing program expansions. After that, anomalies are reviewed and corrected before sign-off.
If large variances appear, assumptions are revisited and respondents are re-contacted to confirm what changed, for example pricing resets, scope creep, or delivery mix shifts. Reports are refreshed annually, with interim updates when a material change affects demand or pricing, and a final pre-delivery pass is completed so clients receive the most current view available.
Mordor Intelligence's Global Engineering Services Outsourcing Market Size Compared With Other Published Estimates
Published market sizes can differ even when they use the same market name, because the service boundary is not always treated the same way and because delivery models get counted inconsistently. Differences also come from whether estimates treat engineering services as a standalone outsourced contract versus bundling parts of IT services, and from how currencies, inflation, and base years are handled.
By tracking a consistent outsourced-only revenue boundary and refreshing currency timing assumptions annually, Mordor Intelligence keeps the total tied to engineering contract value rather than broader digital services, which helps prevent scope creep from inflating the number. The remaining gaps usually come from how firms treat captive engineering centers, whether they include adjacent services like pure IT managed services, and whether they apply aggressive pricing expansion instead of using interview-backed rate movement.
Benchmark comparison
| Source | Market Size | Gaps in Research Methodology |
|---|---|---|
| Mordor Intelligence | USD 164.71 B (2026) | |
| Global Consultancy A | USD 315.00 B (2025) | Uses an earlier base year and appears to fold in broader digital engineering and bundled IT components, which expands the counted contract scope beyond outsourced engineering-only work. |
| Trade Journal B | USD 156.80 B (2025) | Looks to rely more on a narrower provider set and conservative rate assumptions, which can undercount large multi-year programs and miss pricing differences across regions. |
Looking at the spread, most of the difference is explained by what gets counted as engineering outsourcing and how pricing and currency timing are applied. When the scope is kept tight to paid third-party engineering contracts and the assumptions are checked with interviews and disclosure-based sanity checks, the result is easier to trace and repeat year to year.


Key Questions Answered in the Report
How large is the engineering services outsourcing market in 2026?
It is valued at USD 164.71 billion in 2026, with expectations of reaching USD 312.65 billion by 2031 under a 13.68% CAGR.
Which region leads demand for outsourced engineering work?
North America holds 35.07% share in 2025, and growing at a CAGR of 34.12%.
What is driving near-shore delivery growth?
Geopolitical risk diversification and stricter data-sovereignty rules are lifting near-shore engagements at a 13.98% CAGR.
Which end-user vertical is expanding fastest?
Automotive and Transportation is projected to grow at 19.79% CAGR.
Page last updated on:


 Your data is secure and never sold or shared.


