
Electrochemical Sensor Market Size and Share
Market Overview
| Study Period | 2020 - 2031 |
|---|---|
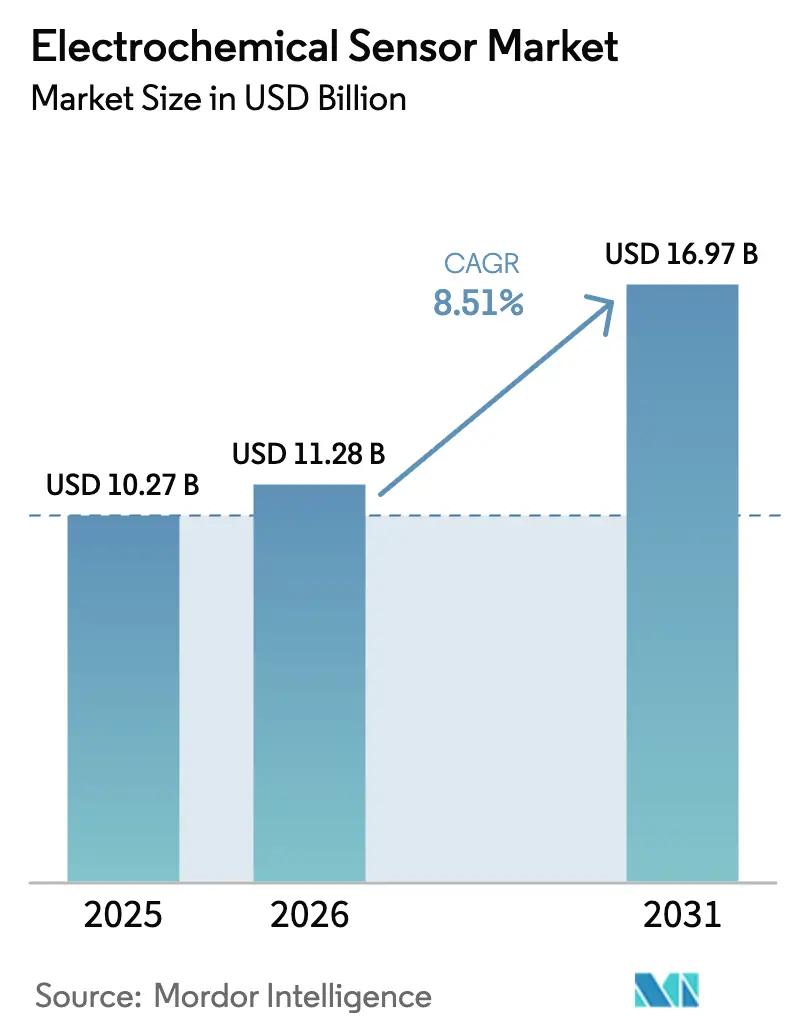
| Market Size (2026) | USD 11.28 Billion |
| Market Size (2031) | USD 16.97 Billion |
| Growth Rate (2026 - 2031) | 8.51 % |
| Fastest Growing Market | Asia Pacific |
| Largest Market | North America |
| Market Concentration | Medium |
Major Players *Disclaimer: Major Players sorted in no particular order Image © Mordor Intelligence. Reuse requires attribution under CC BY 4.0. | |
Electrochemical Sensor Market Analysis by Mordor Intelligence
The electrochemical sensor market size is expected to increase from USD 10.27 billion in 2025 to USD 11.28 billion in 2026 and reach USD 16.97 billion by 2031, growing at a CAGR of 8.51% over 2026-2031. Adoption is accelerating as regulatory authorities tighten real-time emissions rules, clinicians validate wearable glucose monitors for over-the-counter use, and semiconductor foundries embed micro-electromechanical systems (MEMS) transducers on single silicon dies. Robust capital spending by petrochemical, mining, and food-processing operators continues to buoy demand for industrial safety, while consumer electronics brands integrate multi-analyte arrays into smartwatches and fitness patches. Vendors that can combine ATEX- or IECEx-approved housings with digital self-diagnostics are securing premium contracts, as the feature set reduces annual calibration visits by up to 40%. Printed carbon-ink electrodes, although limited to six-month lifetimes, are enabling network density for urban air-quality programs to reach sub-1-kilometer resolution, a level previously unattainable with reference analyzers that cost an order of magnitude more.
Key Report Takeaways
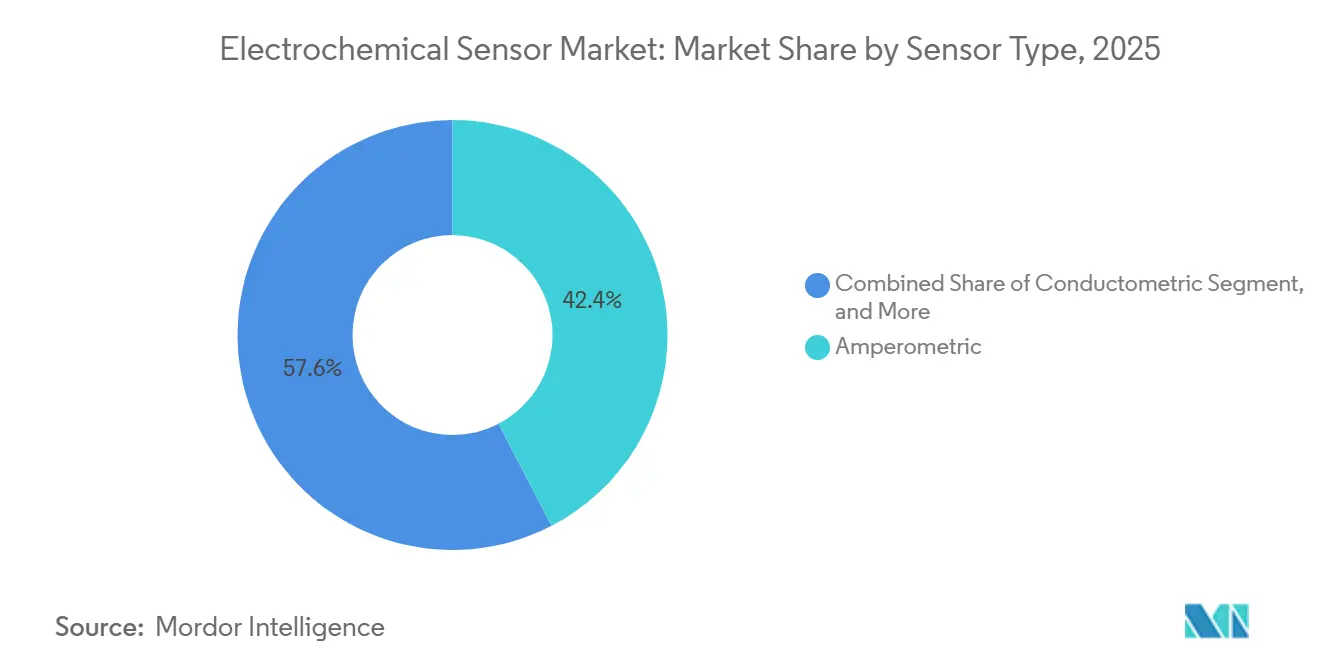
- By Sensor type, amperometric sensors led with 42.38% electrochemical sensor market share in 2025, while conductometric designs are advancing at a 9.43% CAGR through 2031.
- By end-user industry, the healthcare segment led with 29.71% electrochemical sensor market share in 2025, while environmental monitoring and other industries are advancing at a 9.74% CAGR through 2031.
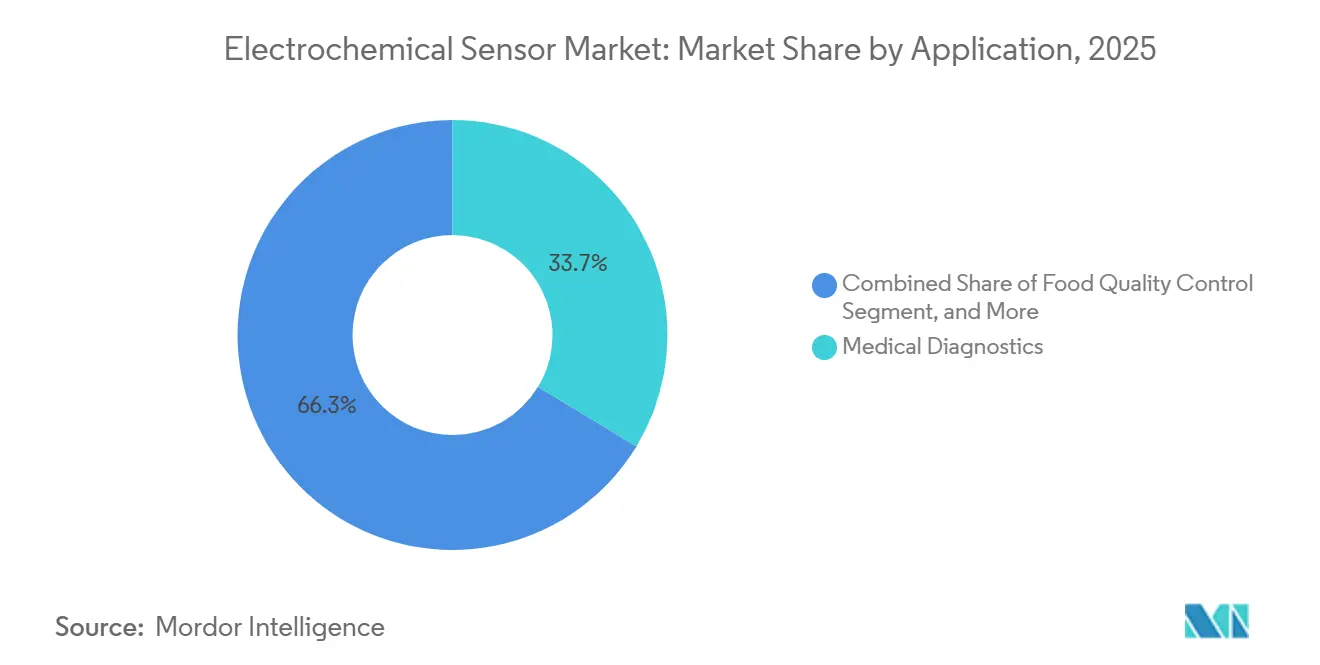
- By application, medical diagnostics captured 33.67% of demand in 2025; wearable and consumer wellness devices are forecast to expand at a 9.79% CAGR through 2031.
- By technology, solid-state architectures accounted for 37.89% of shipments in 2025, whereas MEMS-based sensors are the fastest-growing segment at a 9.39% CAGR through 2031.
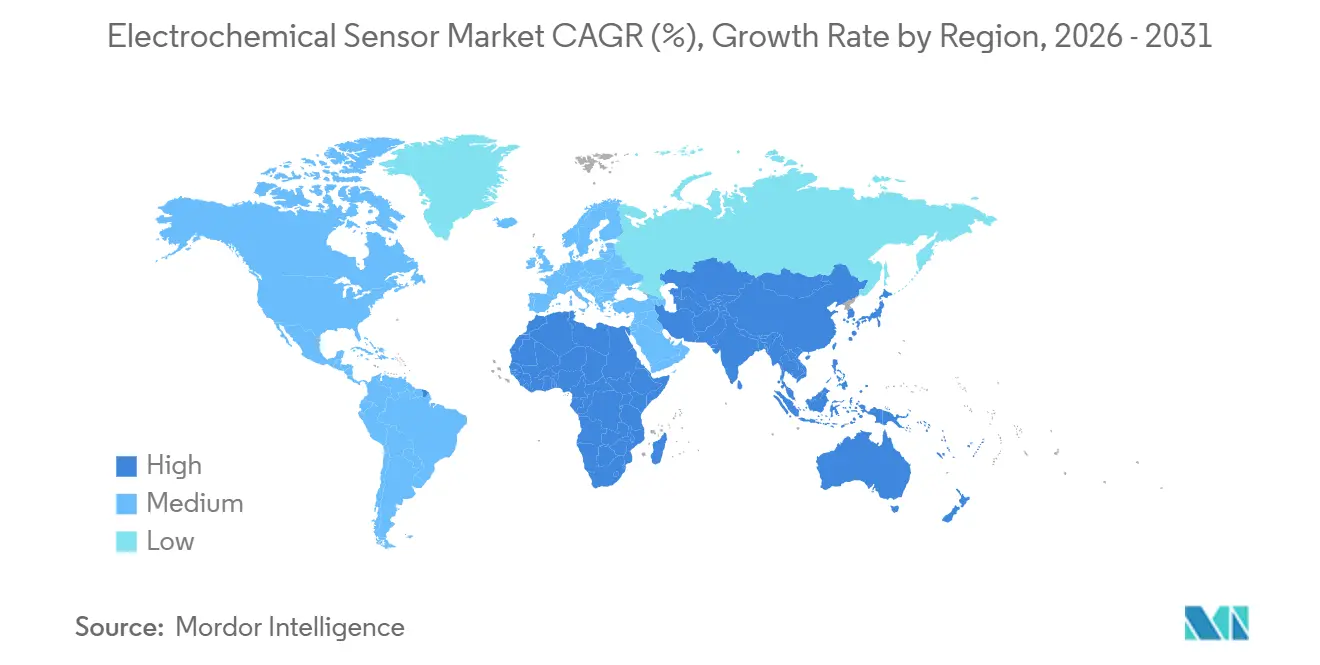
- By geography, North America retained 36.16% of the revenue share in 2025, yet Asia Pacific is poised to deliver the strongest regional performance, with a 9.57% CAGR to 2031.
Note: Market size and forecast figures in this report are generated using Mordor Intelligence’s proprietary estimation framework, updated with the latest available data and insights as of January 2026.
Global Electrochemical Sensor Market Trends and Insights
Drivers Impact Analysis*
| Driver | (~) % Impact on CAGR Forecast | Geographic Relevance | Impact Timeline |
|---|---|---|---|
| Rising Demand for Portable and Wearable Detection Devices | +1.8% | Global, with concentration in North America and Europe for medical wearables; Asia Pacific for consumer wellness devices | Medium term (2-4 years) |
| Expansion of Stringent Workplace-Safety Regulations Across Developing Economies | +1.2% | Asia Pacific core, spill-over to Middle East and Africa, Latin America | Long term (≥ 4 years) |
| Integration of Electrochemical Sensors into Industry 4.0 and Smart Manufacturing Platforms | +1.0% | Europe and North America industrial corridors; emerging adoption in China and India | Medium term (2-4 years) |
| Rapid Growth of Continuous Glucose Monitoring and Other Point-of-Care Diagnostics | +2.1% | North America and Europe lead regulatory approvals; Asia Pacific accelerating with local device approvals | Short term (≤ 2 years) |
| Adoption of MEMS-Based Solid-State Architectures Reducing Cost and Footprint | +1.3% | Global, driven by semiconductor hubs in Taiwan, South Korea, Japan, United States | Medium term (2-4 years) |
| Emergence of Printed and Flexible Electrochemical Sensors for Large-Area Environmental Networks | +0.9% | Europe environmental monitoring; China air-quality networks; pilot deployments in urban centers globally | Long term (≥ 4 years) |
| Source: Mordor Intelligence | |||
Rising Demand for Portable and Wearable Detection Devices
Clinical approval for on-body continuous glucose monitors that do not require finger-stick calibration is expanding the market for electrochemical sensors. The United States Food and Drug Administration cleared Abbott FreeStyle Libre 3 in December 2024 and approved Dexcom Stelo for over-the-counter sales in June 2025, opening access for more than 30 million U.S. adults with Type 2 diabetes who do not use insulin.[1] Printed electrodes on polyethylene terephthalate, combined with Bluetooth Low Energy modules, keep the bill of materials below USD 50, a threshold that unlocks cash-pay consumer segments. Research groups have already demonstrated amperometric lactate and cortisol patches smaller than 5 square millimeters that operate on 10 microwatts, enabling multi-day monitoring on a coin cell. Sports and wellness brands are using the same platform to measure sweat alcohol and hydration markers, turning biochemical feedback into app-based coaching subscriptions.
Expansion of Stringent Workplace-Safety Regulations Across Developing Economies
India’s 2024 amendments to the Factories Act make continuous hydrogen sulfide and carbon monoxide surveillance mandatory in chemical plants employing more than 50 workers, while China’s Ministry of Emergency Management added wastewater treatment sites and subway tunnels to its gas-monitoring list in the same year.[2] Demand centers on amperometric cells that deliver sub-1 ppm sensitivity and operate from -40°C to 50°C without requiring active heating. ATEX Zone 1 enclosures incur an additional cost of USD 200-500 per detector, but are non-negotiable for petrochemical operators. Vendors with pre-certified platforms are shipping upgrade kits that slot into legacy catalytic-bead housings, reducing retrofit downtime to a single shift and accelerating adoption across more than 200,000 aging units in India alone.
Integration of Electrochemical Sensors into Industry 4.0 and Smart Manufacturing Platforms
Automakers in Germany have embedded amperometric oxygen sensors inside paint booths, feeding data through OPC Unified Architecture gateways into machine-learning models that predict drift and autocalibrate before readings move outside ISO 9001 tolerance bands.[3] Semiconductor toolmakers now package microcontrollers and electrochemical transducers on the same substrate, shrinking footprints to 1 cubic centimeter and eliminating analog-to-digital conversion noise. Pharmaceutical cleanrooms are another growth area, as Good Manufacturing Practice rules require continuous ammonia checks across air-handling units. These operators require digital outputs and built-in self-diagnostics that flag membrane fouling or electrolyte depletion, enabling maintenance crews to reduce unplanned downtime by 15%.
Rapid Growth of Continuous Glucose Monitoring and Other Point-of-Care Diagnostics
Reimbursement expansion has driven the combined continuous glucose monitoring revenue for Abbott and Dexcom from USD 8.9 billion in 2023 to an estimated USD 12.5 billion in 2025, with analysts projecting that Senseonics received approval for a 365-day implantable sensor in April 2025, eliminating the 26 annual insertions required by earlier models. Medtronic’s MiniMed 780G, cleared in October 2024, ties a 7-day amperometric sensor to automated insulin dosing that cuts hypoglycemic events by 30% in pivotal trials. Success in glucose is spilling into lactate-based sepsis triage and potassium monitoring during renal therapy, reinforcing hospital demand for point-of-care readers and accelerating unit shipments well above consensus forecasts.
Restraints Impact Analysis*
| Restraint | (~) % Impact on CAGR Forecast | Geographic Relevance | Impact Timeline |
|---|---|---|---|
| Short Operational Life in High-Temperature and High-Humidity Environments | -0.7% | Middle East, Southeast Asia, tropical regions; industrial facilities with steam or chemical exposure | Medium term (2-4 years) |
| Lengthy Certification Cycles for Hazardous-Area Applications (ATEX and IECEx) | -0.5% | Global, with acute impact in Europe (ATEX) and Asia Pacific (IECEx) for oil and gas, chemical sectors | Long term (≥ 4 years) |
| Drift and Re-calibration Burden in Long-Term Continuous-Monitoring Installations | -0.9% | Global industrial and environmental monitoring deployments; particularly acute in remote or offshore sites | Medium term (2-4 years) |
| Fragmented Standardization for Printed and Wearable Sensor Performance | -0.6% | Global, with regulatory bottlenecks in North America (FDA) and Europe (CE marking under Medical Device Regulation) | Long term (≥ 4 years) |
| Source: Mordor Intelligence | |||
Short Operational Life in High-Temperature and High-Humidity Environments
Electrolyte evaporation and membrane degradation can reduce service life from 24 months to as little as nine in refineries where daytime temperatures exceed 45 °C and humidity exceeds 90%. Operators in Saudi petrochemical complexes report replacement rates triple those in temperate zones. Ionic-liquid electrolytes and hermetic housings extend life but add USD 10-20 per detector and slow response times by up to 30%. Some end-users are switching to metal-oxide or optical sensors for furnace zones, thereby constraining the electrochemical sensor market in precisely the environments where its selectivity would otherwise be most beneficial.
Lengthy Certification Cycles for Hazardous-Area Applications
Achieving ATEX or IECEx approval demands 12-18 months of lab testing and USD 50,000-150,000 per variant. Smaller firms, therefore, steer clear of Zone 0 and Zone 1 opportunities. Novel architectures, such as printed electrodes, must undergo extended evaluation because precedent certifications are lacking, which could delay their launch by another two to three years. These bottlenecks leave the field to incumbents with amortized test budgets, limiting competitive diversity and slowing uptake of disruptive cost-reduction technologies.
*Our forecasts treat driver/restraint impacts as directional, not additive. The impact forecasts reflect baseline growth, mix effects, and variable interactions.
Segment Analysis
By Sensor Type: Amperometric Sensors Dominate but Conductometric Designs Accelerate
Amperometric models generated 42.38% of 2025 revenue, anchored by glucose monitoring and hydrogen sulfide safety applications, where they combine sub-1 ppm detection with simple two-point calibration. Conductometric sensors, although smaller in absolute terms, are expanding at a 9.43% CAGR because water utilities rely on them for real-time dissolved solids tracking in desalination plants and municipal distribution loops. Potentiometric systems remain the go-to choice for pH and ion-selective bioprocess control, while voltammetric devices serve as a niche tool for heavy-metal analysis. The miniaturization of amperometric cells onto MEMS hotplates underpins the integration of four-electrode arrays inside smartwatches and insulin pumps, a frontier that could add USD 2 billion to the electrochemical sensor market by 2031.
Second-generation amperometric dies already measure 0.3 cubic centimeters and leverage platinum nanofibers that boost signal-to-noise by 25%. Conductometric makers are countering with drift-resistant polymer films that allow six-month deployments without field recalibration, a requirement for distributed water-quality nodes in rural India. Potentiometric vendors are enhancing ion-exchange membranes to withstand industrial cleaners, thereby broadening pH applications from food fermentation to semiconductor rinse baths. Voltammetric entrants are bundling heavy-metal and pesticide assays into cloud-linked kits aimed at agricultural extension officers. Together, these innovations keep the electrochemical sensor market on a steady trajectory of diversification.

By End-User Industry: Healthcare Commands Spend, Environmental Monitoring Gains Momentum
Healthcare represented 29.71% of 2025 demand, powered by double-digit growth in continuous glucose monitoring. Hospital procurement teams favor amperometric cartridges that clip into multi-analyte blood-gas analyzers, enabling sepsis triage to be sped up from hours to minutes. Oil and gas operators account for a similar share, but growth is flatter as mature installations move into replacement mode. The environmental monitoring community is growing more briskly, with a 9.74% CAGR, because cities in China and Europe must hit sub-1 kilometer resolution under the latest Ambient Air Quality Directive. Food and beverage processors continue to adopt dissolved oxygen and pH probes that integrate into Hazard Analysis and Critical Control Points (HACCP) dashboards.
Field interviews reveal that pharmaceutical cleanrooms spend twice as much per sensor as other verticals, due to the requirement for traceable calibration certificates. Mining companies in Australia and South Africa are upgrading portable detectors with Bluetooth connectivity, allowing readings to auto-populate safety logs. Automotive tier-ones in Japan and South Korea now design MEMS amperometric nitrogen oxide modules into exhaust after-treatment systems for Euro 7 compliance. Each of these verticals adds incremental volume, keeping the electrochemical sensor market diversified against shocks from a single industry.
By Application: Medical Diagnostics Still Largest, Wearables Most Dynamic
Medical diagnostics accounted for 33.67% of 2025 sales, while wearable wellness devices are the fastest-growing segment at 9.79% per year. Over-the-counter glucose approvals remove prescription friction, and fitness platforms monetize subscription dashboards that interpret lactate and cortisol curves. Industrial safety remains the second-largest application cluster, as confined-space entry rules require the use of portable hydrogen sulfide and carbon monoxide alarms. Environmental deployments range from sub-USD 1 printed nodes on streetlights to EUR 2,000 reference units in regional supersites.
Food-quality programs embed amperometric amine sensors in refrigerated containers, cutting spoilage claims by 12% for meat exporters in Brazil. Automotive regulations require on-board nitrogen oxide accuracy of around 10 ppm for 500,000 kilometers, a specification now met by silicon hotplate stacks with co-integrated heaters and temperature compensators. Collectively, these use cases broaden the electrochemical sensor market addressable space faster than any single segment could.
By Technology: Solid-State Retains Lead, MEMS Platforms Gain Share
Solid-state designs accounted for 37.89% of shipments in 2025, thanks to their resilience in vibration-heavy settings such as drilling rigs and commercial vehicles. Liquid-state cells still dominate ultra-low-level hydrogen sulfide detection because aqueous electrolytes deliver sub-1 ppm sensitivity with response times of 10 seconds. MEMS-based devices, however, are the growth engine, with a 9.39% CAGR, because photolithography allows for the direct printing of gold working electrodes on silicon, thereby slashing assembly labor and pushing unit cost below USD 5 at 100,000-unit quantities. Thick-film and thin-film hybrids withstand 800 °C exhaust streams, providing a foothold in metal-smelter off-gas analysis.
Hybrid arrays are now shipping with 16 electrodes on a 5-millimeter square die, each coated for a different analyte. Such multiplexing reduces the bill of materials in indoor air-quality monitors by a third, strengthening the case for the electrochemical sensor market in smart-building retrofits. Manufacturers are also layering polymeric membranes onto MEMS stacks to protect enzymes from thermal shock, extending wearables’ shelf life through summer heatwaves. The interplay among these technology tracks keeps innovation cycles tight and pricing competitive.
Geography Analysis
North America generated 36.16% of 2025 revenue, anchored by 8 million insulin-dependent patients who already use continuous glucose monitors and a larger Type 2 cohort now eligible for over-the-counter devices. Occupational Safety and Health Administration codes require sub-1 ppm hydrogen sulfide alarms in wastewater plants, driving the replacement of legacy catalytic-bead units with amperometric cells. Canada funds air-quality grids that deploy thousands of printed nitrogen dioxide nodes across Toronto and Vancouver, while Mexico’s automakers fit MEMS nitrogen oxide probes to comply with United States Environmental Protection Agency Tier 3 rules.
The Asia-Pacific is the fastest-growing region, with a growth rate of 9.57% through 2031. China’s Ministry of Ecology and Environment mandates round-the-clock urban air quality checks in more than 300 cities, ordering domestic vendors to build sensors at a price point of less than USD 50. India’s chemical hubs must install fixed hydrogen sulfide and ammonia detectors under the revised 2024 Factory Act. Japan’s chip foundries co-integrate analog front-ends and electrochemical dies for export-oriented cabin-air modules, while South Korean tier-ones lead in exhaust gas arrays for Euro 7.
Europe maintains a sizeable installed base because the revised Ambient Air Quality Directive forces municipalities to cover every square kilometer with sensors. Germany pioneers Euro 7 exhaust implementations that rely on MEMS nitrogen oxide sensors, and the United Kingdom’s National Health Service reimburses continuous glucose monitoring for Type 2 diabetics, thereby fueling patient uptake. France deploys printed flexible sensors in dense Parisian grids, and Spain upgrades winery fermenters with dissolved-oxygen probes. Eastern European refineries are investing in ATEX Zone 1 electrochemical detectors as they modernize their aging Soviet-era infrastructure.
The Middle East and Africa growth centers on Saudi petrochemical complexes and South African mines that require intrinsically safe detectors. Harsh climate shortens sensor life, so operators pay premiums for ionic-liquid models rated to 55 °C. South America sees momentum in Brazil’s PROCONVE L7 adoption, which involves nitrogen oxide probes on diesel pickups, and in Argentina’s use of soil nitrate sensors to optimize fertilizer use, thereby curbing runoff into the Paraná River basin.
Regulatory Landscape
Electrochemical sensors used in healthcare increasingly map to medical device quality and safety frameworks, anchored by ISO 13485-based quality systems and device safety standards such as IEC 60601-1 for electrically powered diagnostic platforms. In the United States, FDA oversight continues to influence go-to-market timing for electrochemical glucose sensing, and over-the-counter continuous glucose monitor clearances during 2024-2025 reinforced expectations around performance, labeling, and post-market requirements that cascade back to electrode, enzyme, and electronics supply chains.
In Europe, requirements vary by end use. Industrial gas detection is still governed by hazardous-area certification regimes (ATEX and IECEx), while in vitro diagnostic and wearable biosensor products must navigate EU MDR (2017/745) and IVDR (2017/746), with extra scrutiny for nanomaterial-enhanced sensor designs under applicable classification rules. For industrial instruments, material restrictions under RoHS and related exemption frameworks remain relevant for legacy chemistries such as specific oxygen cell designs, and periodic reviews and renewals continue to affect component redesign cycles and documentation load for manufacturers selling into Europe and the United Kingdom.
Value Chain Analysis
The electrochemical sensor value chain begins with upstream inputs such as electrode materials (noble metals and carbon inks), electrolytes, membranes, enzymes and reagents for biosensing, and semiconductor/MEMS substrates and packaging consumables. Midstream, manufacturers carry out electrode fabrication (printed, thick-film/thin-film, or MEMS-based), assemble sensors into cartridges or intrinsically safe housings, and integrate electronics (analog front ends, microcontrollers, and wireless modules). This is followed by factory calibration, drift characterization, and qualification.
Downstream, sensors are integrated by OEMs into wearables, medical readers, industrial safety detectors, and environmental nodes, with distribution also flowing through industrial automation partners, healthcare supply chains, and service organizations that handle installation and recurring calibration. Calibration and qualification remain persistent bottlenecks, since stress testing and drift analysis add time and can constrain responsiveness to demand spikes, especially for certified hazardous-area variants. Differentiation is increasingly tied to digital diagnostics and connectivity, so integrators can deploy sensors as part of IoT-enabled monitoring stacks, while automated test and calibration workflows improve yields and shorten lead times for high-volume MEMS platforms.
Competitive Landscape
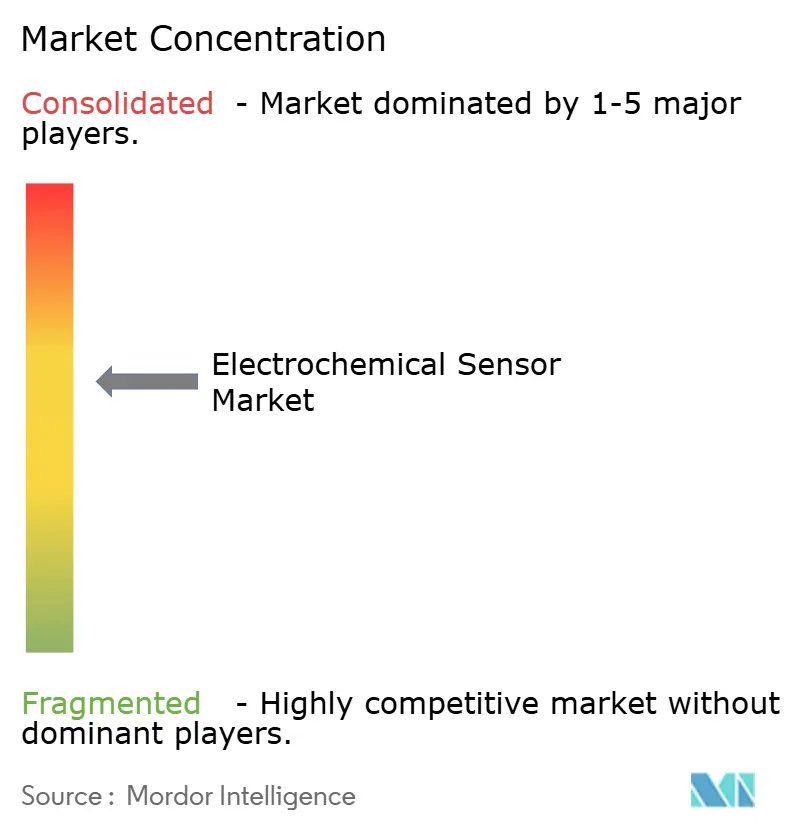
Moderate concentration defines the electrochemical sensor market. Honeywell, MSA Safety, and Drägerwerk dominate the industrial safety market, backed by extensive ATEX and IECEx portfolios. Abbott, Dexcom, Medtronic, and Senseonics control most healthcare revenue through proprietary enzyme-electrode chemistries and cloud algorithms that trim calibration frequency. Combined, the top five vendors captured an estimated 62% of 2025 sales; yet, pricing pressure remains because Taiwanese and South Korean foundries can fabricate MEMS dies at a sub-USD 5.
Crane’s USD 1.06 billion acquisition of Baker Hughes’ instrumentation arm in September 2025 underscores consolidation momentum. Siemens bought a minority stake in Sensirion in August 2024 to secure access to micro-hotplate intellectual property for volatile organic compound analyzers. University spin-outs are commercializing aptamer-based electrodes that eliminate cold-chain requirements and double shelf life, but must still clear lengthy Food and Drug Administration or CE Mark pathways. Platform strategies are increasingly centered on digital outputs, self-diagnostics, and IEC 61508 functional safety certifications, as factory automation buyers value predictive maintenance over hardware price.
Vendors also compete on operating-life extensions in harsh climates. Ionic-liquid electrolytes, desalination of polymer films, and hermetic titanium housings fetch premiums from Middle Eastern oil producers who calculate downtime costs at USD 1 million per hour. Start-ups offering printed carbon-ink arrays aim for sub-USD 1 nodes that municipalities can replace every six months, banking on volume economics rather than lifespan. This spectrum of positioning keeps the electrochemical sensor market dynamic and innovation-driven.
Electrochemical Sensor Industry Leaders
-
Thermo Fisher Scientific Inc.
-
MSA Safety Incorporated
-
Emerson Electric Co.
-
Honeywell International Inc.
-
ABB Ltd.
- *Disclaimer: Major Players sorted in no particular order
Market Opportunities and Future Outlook
Over-the-counter continuous glucose monitoring creates a clearer path for lower-cost, mass-market electrochemical sensing platforms that combine disposable amperometric elements with consumer-grade electronics and app ecosystems. FDA actions in 2024-2025 that expanded access to CGM for non-insulin-dependent Type 2 users support the commercial case for scaled electrode manufacturing, simplified calibration workflows, and multi-analyte extensions (for example, lactate or electrolyte monitoring) that build on the same core transducer and packaging approaches.
Industrial and municipal programs also support denser deployments, where total cost of ownership is driven more by maintenance than by the sensor unit price. Workplace monitoring rules in developing economies and hazardous-area requirements (ATEX/IECEx) continue to favor suppliers that can provide pre-certified platforms with digital self-diagnostics, while city air-quality programs targeting sub-kilometer spatial resolution match printed or low-cost node architectures even with shorter lifetimes. In industrial automation, wider use of digital field protocols (for example, Modbus) and sensor-integrated diagnostics supports tighter linkage to control systems and condition-based maintenance, which shifts purchases toward platforms that reduce site visits and simplify integration into plant data infrastructure.
Recent Industry Developments
- May 2026: Emerson launched the Rosemount 396A Anti-Coating pH Sensor for pH and ORP measurement in dirty, abrasive, high-solids services, with a digital Modbus output. The release targets applications where coating and fouling drive downtime, supporting lower-maintenance deployments in process industries that also buy adjacent electrochemical analyzers.
- October 2025: Thermo Fisher Scientific launched an Orbitrap mass detector positioned for environmental and food safety testing workflows. While not an electrochemical sensor, it raises instrumentation performance expectations in regulated testing labs and can shift system-level budgets and integration choices around sample-to-answer platforms that often include electrochemical measurements.
- February 2025: Thermo Fisher Scientific introduced the Orion Pro Star electrochemistry bench meter series, including pH/ORP bench meters with touchscreen interfaces and data logging. The update supports higher-throughput lab and quality-control use cases where traceability and digital records influence procurement alongside probe and sensor replacement demand.
Research Methodology Framework and Report Scope
Market Definition and Coverage
This market covers revenue generated from electrochemical sensors sold for detecting and measuring chemical or biological targets, across industries such as healthcare, industrial safety, automotive emissions, and environmental monitoring, and across major regions.
Scope exclusions: We exclude adjacent sensor families that do not use electrochemical detection, and we also exclude downstream services that are billed separately from the sensor device.
Segmentation Overview
- By Sensor Type
- Potentiometric Sensors
- Amperometric Sensors
- Conductometric Sensors
- Voltammetric Sensors
- By End-User Industry
- Healthcare
- Oil and Gas
- Chemical and Petrochemicals
- Automotive
- Food and Beverage
- Environmental Monitoring and Other End-User Industries
- By Application
- Medical Diagnostics
- Industrial Safety and Gas Detection
- Environmental Monitoring
- Food Quality Control
- Automotive Emissions Monitoring
- Wearable and Consumer Wellness Devices
- By Technology
- Solid-State Sensors
- Liquid-State Sensors
- MEMS-Based Sensors
- Thick-Film / Thin-Film Sensors
- By Geography
- North America
- United States
- Canada
- Mexico
- Europe
- Germany
- United Kingdom
- France
- Russia
- Rest of Europe
- Asia-Pacific
- China
- Japan
- India
- South Korea
- Australia
- Rest of Asia-Pacific
- Middle East and Africa
- Middle East
- Saudi Arabia
- United Arab Emirates
- Rest of Middle East
- Africa
- South Africa
- Egypt
- Rest of Africa
- Middle East
- South America
- Brazil
- Argentina
- Rest of South America
- North America
Data Sources, Market Sizing, and Validation
Desk Research
Desk research was used to build the fact base for demand signals, product definitions, and regional context, before assumptions were tested through fieldwork. Public references used include sources such as the US Environmental Protection Agency, US Food and Drug Administration databases and guidance notes, the European Environment Agency, World Health Organization publications, and UN Comtrade for trade direction checks on relevant components and finished goods.
We also reviewed company annual reports, investor presentations, press releases, and technical papers in peer reviewed journals to understand typical use cases and how pricing has shifted over time. In addition, we selectively used paid subscriptions for company financials and intelligence, patent databases, and shipment level import and export datasets to close gaps where public reporting is too broad. These are illustrative examples, and other public and subscription sources were also consulted during data collection and validation.
Primary Interviews and Surveys
Primary work was carried out through expert interviews and structured surveys with participants across sensor manufacturing, component supply, integration, and end user procurement. Since this is a global market, we ensured coverage across APAC, EMEA, and the Americas, and we used the feedback to confirm adoption pace, typical replacement cycles, and realistic ASP changes by application.
Distribution of primary research fieldwork respondents
| Company type | Respondent position | Region |
|---|---|---|
| Top tier: 32% | CXOs: 20% | APAC: 44% |
| Mid tier: 47% | Functional/Unit leaders: 37% | EMEA: 31% |
| Smaller Players: 21% | Managers: 43% | Americas: 25% |
Market-Sizing & Forecasting
Our market model starts with a top-down build where regional demand pools are reconstructed from application-level adoption, and then converted to value using typical selling prices that reflect product mix. To keep it practical, we used a limited set of inputs that can be refreshed every year, such as industrial safety and gas detection deployment intensity, automotive emissions monitoring content per vehicle where relevant, medical diagnostics and wearable biosensing penetration, environmental monitoring program activity, and replacement or calibration-driven refresh cycles.
After the first pass, results are checked using selective bottom-up approximations, including supplier and channel checks, sampled ASP x volume logic for key applications, and cross checks against company disclosed revenue bands where available. If a subsegment lacks usable disclosure, we fill the gap by applying conservative penetration ranges that are tied to interview feedback, and then we test sensitivity so totals do not get pushed by one assumption. Forecasts were built using scenario analysis supported by expert views on regulation timing, technology migration (for example, MEMS and printed electrode adoption), and expected pricing movement, and then the yearly path is smoothed to match realistic ramp patterns.
Data Validation & Update Cycle
Validation is handled through several checks that look for mismatches across regions, end uses, and implied unit economics, and we also compare outputs with independent signals like regulatory program rollouts, device shipment trends in key end markets, and trade direction indicators. If a variance looks too large, we re-check the input, revisit the assumption with another expert touchpoint, and document the reason for the adjustment before sign-off.
The report is refreshed annually, and interim updates are made when there is a material event such as a major regulatory change, a supply disruption, or a sharp pricing move that changes the near-term base. Before publication, a final analyst pass is completed so the delivered numbers reflect the latest available public data and the newest field feedback.
Mordor Intelligence's Global Electrochemical Sensors Market Market Size Measured Against Other Published Estimates
It is common to see different market values for electrochemical sensors because publishers do not always count the same product set, they may pick different base years, and they may project pricing and adoption in different ways. The spread becomes larger when one estimate is device-focused and another one mixes in broader solution revenues, since the added layers can be hard to validate consistently.
Some published figures lean toward wider sensing coverage, which can include non-electrochemical chemical sensors or extra service revenues linked to monitoring programs. In Mordor Intelligence, only electrochemical sensor revenues are counted, and non-electrochemical sensor types and separately billed services are kept out even if they sit in the same end-use workflow.
Benchmark comparison
| Source | Market Size | Gaps in Research Methodology |
|---|---|---|
| Mordor Intelligence | USD 10.27 B (2025) | |
| Industry Research Publisher A | USD 11.30 B (2023) | Uses a different base year and application mapping, and the scope appears to be organized by broad application buckets, which can pull in adjacent sensing revenues depending on how products are classified across end markets. |
| Market Portal B | USD 10.68 B (2025) | Provides limited detail on the underlying build and base-year structure, so differences likely come from conservative growth assumptions and a simpler ASP progression that may not reflect mix shifts across medical, industrial safety, and environmental programs. |
Looking at the three figures together, the main drivers of difference are the year chosen for the stated size, how strictly electrochemical sensing is separated from neighboring sensor families, and how pricing and replacement cycles are carried forward. By keeping the inputs tied to adoption, refresh cycles, and realistic price movement, our estimate stays traceable to repeatable steps that can be rechecked in the next update.
Key Questions Answered in the Report
What is the projected value of the electrochemical sensor market in 2031?
The electrochemical sensor market size is forecast to reach USD 16.97 billion by 2031.
Which sensor type currently leads global revenue?
Amperometric sensors command 42.38% of 2025 revenue, the largest share among all types.
Which region will grow the fastest through 2031?
Asia Pacific is expected to post the highest CAGR at 9.57% through 2031, fueled by air-quality mandates and industrial safety retrofits.
How are MEMS platforms changing competitive dynamics?
MEMS fabrication cuts unit cost below USD 5 at scale and enables multi-gas arrays on single dies, attracting consumer electronics and automotive customers.
What is the main barrier for new entrants in hazardous areas?
ATEX and IECEx certifications add 12-18 months and up to USD 150,000 per variant, creating a significant time and cost hurdle for startups.