
Electrocardiograph (ECG) Market Size and Share
Market Overview
| Study Period | 2020 - 2031 |
|---|---|
| Market Size (2026) | USD 8.43 Billion |
| Market Size (2031) | USD 12.33 Billion |
| Growth Rate (2026 - 2031) | 7.92 % |
| Fastest Growing Market | Asia Pacific |
| Largest Market | North America |
| Market Concentration | Medium |
Major Players *Disclaimer: Major Players sorted in no particular order Image © Mordor Intelligence. Reuse requires attribution under CC BY 4.0. | |
Electrocardiograph (ECG) Market Analysis by Mordor Intelligence
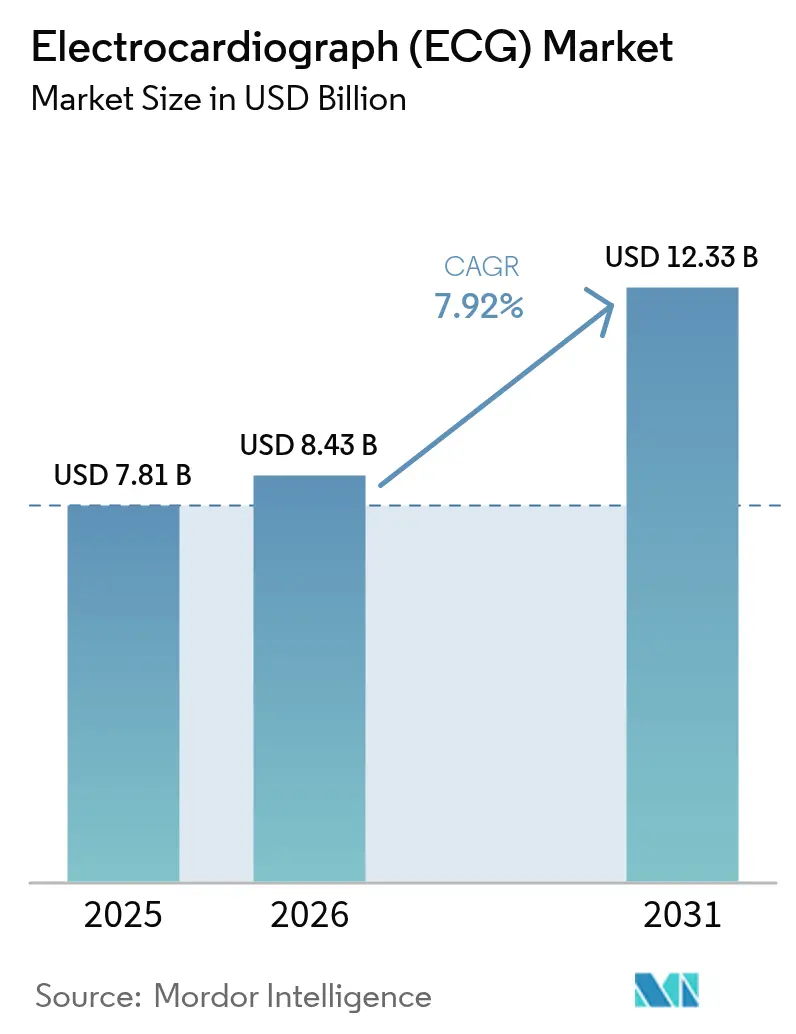
The Electrocardiograph (ECG) Market size is projected to be USD 7.81 billion in 2025, USD 8.43 billion in 2026, and reach USD 12.33 billion by 2031, growing at a CAGR of 7.92% from 2026 to 2031.
Demand is shifting from hospital-centric diagnostics toward distributed cardiac monitoring as AI-enabled interpretation, sub-USD 100 single-lead modules in wearables, and edge analytics in emergency vehicles reshape care pathways. Regulatory momentum accelerated after the U.S. FDA cleared 14 AI-ECG algorithms in 2025, double the 2024 count, confirming that machine-learning models trained on diverse cohorts are moving from pilot to production [1]. Government-funded screening is also scaling quickly: China’s National Health Commission mandated ECG tests for adults over 35 in tier-2 cities by 2027, creating outsized demand for portable, cloud-connected devices.
Payers are aligning incentives with technology adoption; the U.S. Centers for Medicare & Medicaid Services introduced CPT 93264 in January 2025, unlocking a USD 400 million reimbursement pool for remote monitoring vendors. Against this backdrop, cybersecurity incidents—such as a ransomware attack on a European platform that exposed 120,000 records in March 2025—underscore the need for robust data-protection frameworks.
Key Report Takeaways
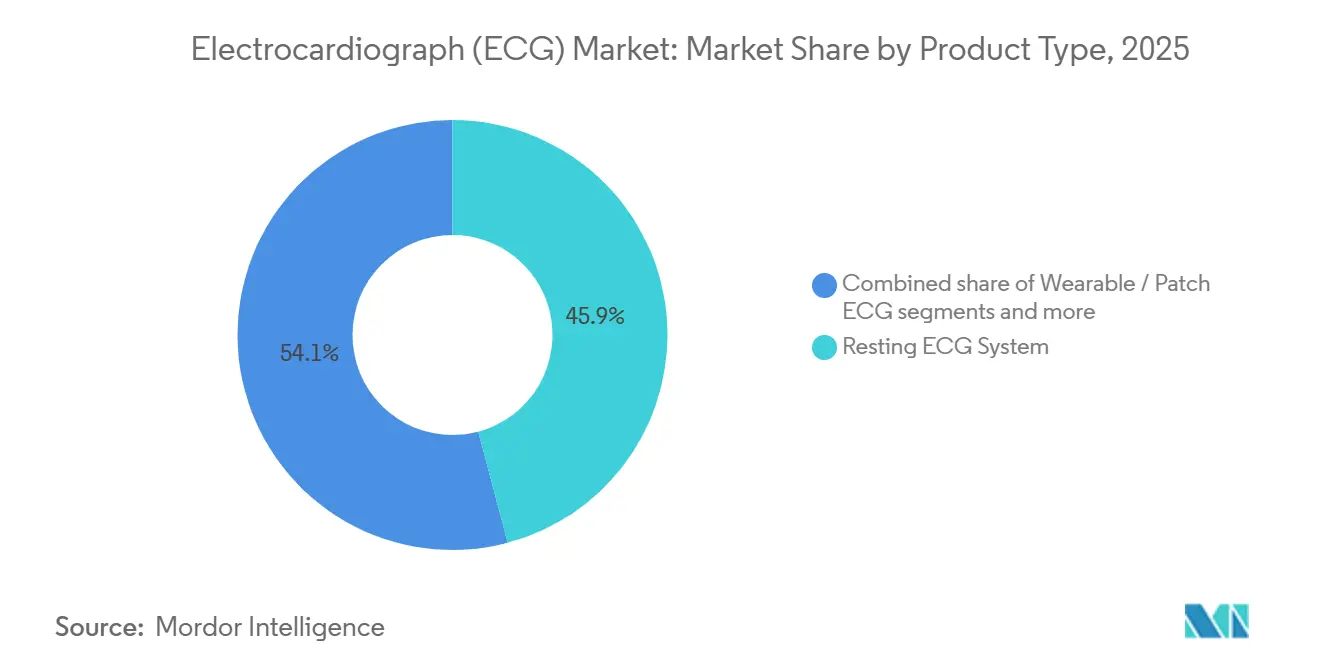
- By product type, resting ECG Systems led with 45.87% revenue share in 2025, while wearable and patch ECG Devices are advancing at an 8.11% CAGR through 2031.
- By lead configuration, 12-lead units held 49.98% of the electrocardiograph (ECG) market share in 2025; 3–6-lead devices are growing at an 8.43% CAGR to 2031.
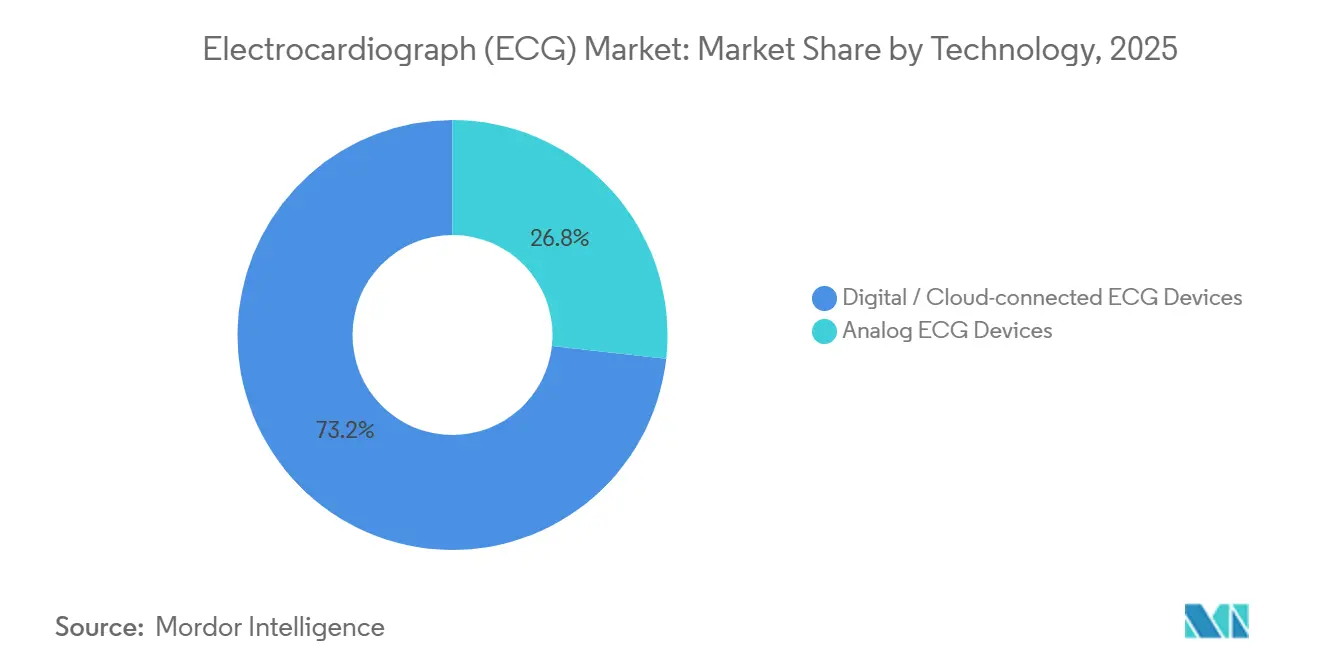
- By technology, digital and cloud-connected devices accounted for 73.23% of the electrocardiograph (ECG) market size in 2025 and are projected to register an 8.21% CAGR to 2031.
- By end user, hospitals and clinics generated 59.12% of 2025 revenue, whereas ambulatory surgical centers record the fastest growth at a 10.12% CAGR.
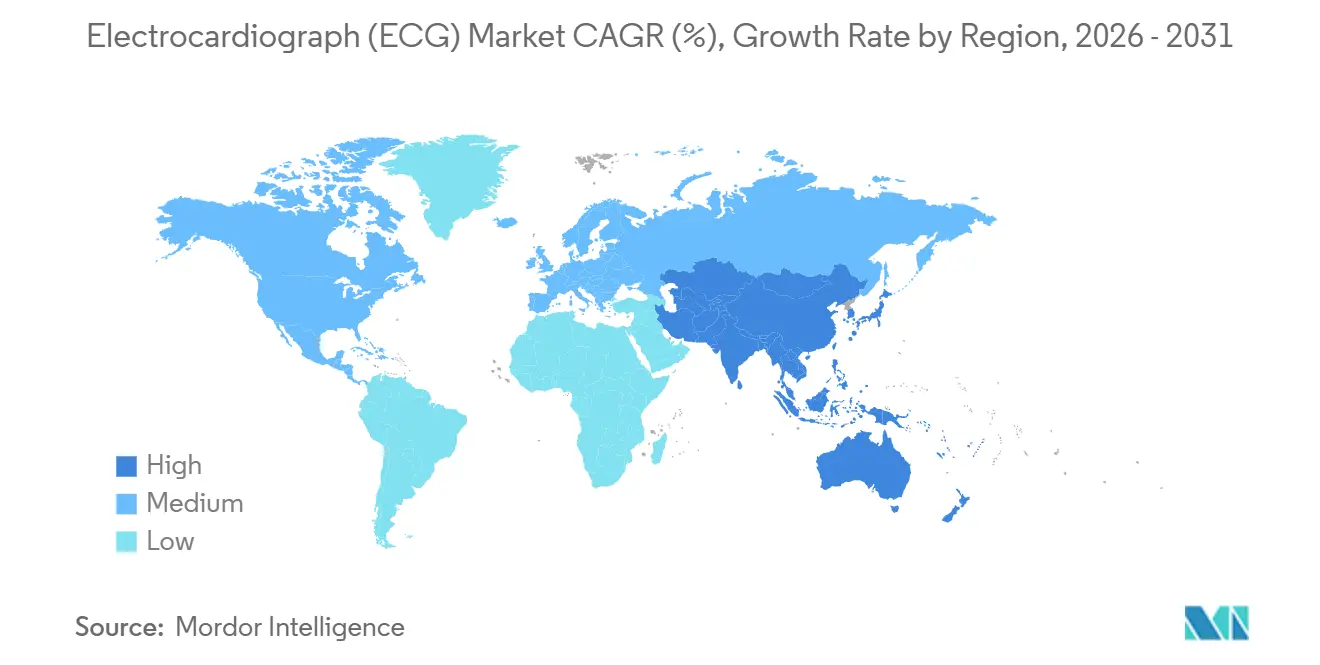
- By geography, North America captured 45.3% revenue share in 2025; Asia-Pacific is the fastest-expanding region with an 8.81% CAGR to 2031.
Note: Market size and forecast figures in this report are generated using Mordor Intelligence’s proprietary estimation framework, updated with the latest available data and insights as of 2026.
Market Trends and Insights
Drivers Impact Analysis of Electrocardiograph (ECG) Market*
| Driver | (~) % Impact on CAGR Forecast | Geographic Relevance | Impact Timeline |
|---|---|---|---|
| Rising Cardiovascular-Disease Prevalence | +1.8% | Global; highest burden in Asia-Pacific and Eastern Europe | Long term (≥ 4 years) |
| Rapid Adoption of AI-Enabled ECG Devices | +1.5% | North America and EU lead; APAC accelerating | Medium term (2-4 years) |
| Accelerating Shift to Home & Remote Cardiac Monitoring | +1.3% | North America and EU mature; APAC emerging | Medium term (2-4 years) |
| Government-Funded Mass Screening Programs | +1.2% | Core in APAC, spill-over to MEA | Short term (≤ 2 years) |
| Edge-Computing ECG Analytics in Emergency Vehicles | +0.6% | North America & EU pilot; APAC urban centers | Medium term (2-4 years) |
| Sub-USD 99 Embedded Single-Lead Modules for OEMs | +0.9% | Global; fastest uptake in APAC | Short term (≤ 2 years) |
| Source: Mordor Intelligence | |||
Rising Cardiovascular-Disease Prevalence
Ischemic heart disease and stroke caused 17.9 million deaths in 2024 and are projected to reach 23 million by 2030, raising demand for early detection worldwide [2]. India’s national program screened 150 million adults in 2025 with battery-operated devices that travel to rural clinics. Employers and payers recognize the USD 1.1 trillion annual economic burden, so reimbursement now favors longitudinal ECG monitoring instead of episodic testing. The result is a broader install base of portable systems in primary care and community centers.
Rapid Adoption of AI-Enabled ECG Devices
Fourteen AI-ECG algorithms cleared by the FDA in 2025 reflect regulator confidence in machine learning interpretation. Mayo Clinic’s platform cut time-to-diagnosis for myocardial infarction by 18 minutes in emergency departments that adopted it in 2025. Draft guidance on algorithmic fairness issued in September 2025 now requires validation across sex, race, and age, likely delaying launches yet building clinician trust. Urban hospitals are first movers because they have cloud infrastructure, while rural sites rely on manual reads. Vendors reply by embedding edge processors that run algorithms offline.
Accelerating Shift to Home & Remote Cardiac Monitoring
CMS created CPT 93264 in 2025, reimbursing 30-day remote ECG monitoring episodes and opening a USD 400 million annual revenue pool. AliveCor reported 42% year-over-year growth in KardiaMobile sales fueled by atrial-fibrillation patients capturing arrhythmias at home. Telehealth leaders such as Teladoc integrated ECG data streams so cardiologists adjust medication remotely. Europe lags as payers debate liability and data quality, but regulatory clarity is improving under MDR.
Government-Funded Mass Screening Programs
China’s ECG mandate for adults over 35 in tier-2 cities by 2027 will require 200 million tests annually [3]. India earmarked INR 5,000 crore (USD 600 million) in 2025 for cardiovascular screening infrastructure, focusing on high-diabetes districts. The UAE’s national registry now obligates ECG uploads for every acute coronary syndrome case, weaving data compliance into purchasing criteria. These front-loaded programs accelerate procurement through 2027 before growth moderates.
Restraints Impact Analysis of Electrocardiograph (ECG) Market*
| Restraint | (~) % Impact on CAGR Forecast | Geographic Relevance | Impact Timeline |
|---|---|---|---|
| Fragmented Reimbursement in Emerging Markets | -1.1% | APAC (ex-Japan), MEA, South America | Long term (≥ 4 years) |
| Shortage of ECG-Trained Technicians | -0.8% | Global; acute in rural APAC & Sub-Saharan Africa | Medium term (2-4 years) |
| Cyber-Security & Data-Privacy Risks | -0.6% | Global; scrutiny in EU & North America | Short term (≤ 2 years) |
| Algorithm Bias in Women & Dark-Skin Populations | -0.5% | Global; regulatory focus in US & EU | Medium term (2-4 years) |
| Source: Mordor Intelligence | |||
Fragmented Reimbursement in Emerging Markets
Patients in India, Brazil, and Indonesia still pay USD 50–150 out of pocket per monitoring episode because insurers lack standardized coverage, suppressing adoption in lower-income groups. Brazil’s last fee schedule update was in 2022, causing bilateral price negotiation and opacity that discourages distribution investment. If India’s Ayushman Bharat adds remote ECG to its package by 2027, harmonization could accelerate.
Shortage of ECG-Trained Technicians
The WHO projects an 18 million-worker deficit in low- and middle-income countries by 2030, including ECG technologists. U.S. training program enrollment fell 12% from 2023 to 2025 due to competition from higher-paid radiology roles. AI interpretation mitigates but does not eliminate the human requirement because regulators still mandate clinician sign-off. India’s Skill Development Corporation aims to train 50,000 technicians by 2028, yet the pipeline remains years away from closing gaps.
*Our forecasts treat driver/restraint impacts as directional, not additive. The impact forecasts reflect baseline growth, mix effects, and variable interactions.
Electrocardiograph (ECG) Market Segment Analysis
By Product Type:
Wearables Challenge Resting Systems’ DominanceResting systems secured 45.87% of revenue in 2025, but wearables and patches posted the highest 8.11% CAGR as new CPT codes make remote monitoring financially attractive. Holter monitors lose share to 14-day patches such as Zio, which grew prescriptions 38% in 2025. Stress systems confront competition from coronary CT angiography because payers perceive a higher diagnostic yield. Software adds recurring revenue; Philips’ cloud platform integrates with Epic and Cerner using FHIR, reaching gross margins above 70%.
The wearables wave is reshaping procurement: consumer-electronics giants supply single-lead devices at minimal cost, pushing medical vendors to bundle multi-lead fidelity and analytics. The Electrocardiograph (ECG) market size for software is projected to expand faster than hardware due to the margin advantages. Hospitals retain cart-based resting systems for acute triage, but outpatients and home settings increasingly favor lightweight patches and watches.

By Lead Type:
Multi-Lead Fidelity Versus Single-Lead ConvenienceTwelve-lead models maintained 49.98% Electrocardiograph (ECG) market share in 2025 because guidelines still treat them as the diagnostic gold standard. Meanwhile, 3–6-lead devices rise at an 8.43% CAGR to serve ambulatory centers prioritizing rapid setup and portability. Single-lead wearables sold 45 million units in 2025; however, their limited spatial resolution yields higher false-positive rates, taxing cardiology referral systems.
Advanced 15/18-lead systems stay confined to academic centers: GE’s MAC 2000 costs more than USD 25,000 and needs expert placement. As payers do not reimburse extra leads, penetration remains niche. The Electrocardiograph (ECG) market size for 3-6-lead devices should widen as outpatient procedures grow, narrowing the gap with 12-lead carts.
By Technology:
Cloud Connectivity Reshapes Data WorkflowsDigital platforms captured 73.23% revenue in 2025 and will compound at 8.21% as hospitals demand real-time, interoperable cardiac data. Cloud hosting allows cardiologists to review tracings remotely, which became indispensable during pandemic restrictions. Analog devices persist in low-resource clinics where internet is unreliable. A ransomware breach in Europe spurred regulators to require encryption and penetration tests, increasing cost but favoring incumbents with security teams.
Digital uptake aligns with value-based care: population-health analytics depend on standardized FHIR datasets. Vendors that seamlessly link waveforms to electronic records win multi-year software-as-a-service contracts. The Electrocardiograph (ECG) market share for analog systems will continue to erode as procurement guidelines mandate cloud compatibility.
By End User:
Ambulatory Centers Capture Outpatient ShiftHospitals and clinics produced 59.12% of 2025 revenue, anchored by emergency departments that administer more than 150 million ECG tests annually in the United States. Yet ambulatory surgical centers clock a 10.12% CAGR because value-based contracts migrate catheter ablation and pacemaker implantation to outpatient settings. ASCs favor compact 3–6-lead systems that roll between procedure rooms.
Home and remote patients represent the absolute growth engine. Diagnostic labs see flat volumes in mature regions but rise in Asia-Pacific as insurance coverage widens. The Electrocardiograph (ECG) market size tied to home settings should surpass ASC revenue before 2031 if reimbursement parity persists.
Geography Analysis
APAC Electrocardiograph (ECG) Market
Asia-Pacific records the fastest 8.81% CAGR through 2031 on the back of mass-screening mandates in China and India, local manufacturing by Mindray and EDAN, and smartphone penetration that supports Bluetooth-paired single-lead devices. Japan’s 28.4% senior population fuels home monitoring, while South Korea covers 30-day monitoring for atrial fibrillation. Australia halved software-approval timelines, enticing venture-backed entrants.
North America and Europe Electrocardiograph (ECG) Market
North America held 45.3% revenue in 2025, but growth moderates as hospital penetration nears saturation. CPT 93264 nevertheless channels fresh volume to wearable vendors. Canada trails because provincial budgets tighten, and Mexico’s federal procurement lingers in negotiation. Europe rebounded after MDR bottlenecks eased; Germany now funds four virtual cardiology visits annually for heart-failure patients.
MEA and South America Electrocardiograph (ECG) Market
The Middle East & Africa account for a notable share of revenue; the UAE registry requirement anchors future demand. South Africa purchased 5,000 portable units in 2025 to mitigate power-outage disruptions. South America wrestles with currency volatility; Brazil’s real depreciation raised import costs, steering buyers to lower-priced models.
Regulatory Landscape
ECG systems and related software are regulated as cardiovascular devices in the United States under 21 CFR Part 870, with pathways that commonly include FDA 510(k) clearance for Class II products. In market adoption, the report context highlights 14 FDA-cleared AI-ECG algorithms in 2025, and an expanding use of cleared solutions for enterprise analysis and home monitoring.
In Europe, the Medical Device Regulation (EU MDR) continues to shape technical documentation, clinical evaluation, and post-market obligations for ECG OEMs and software vendors, while the MDR transition timeline was extended under Regulation (EU) 2023/607, with final compliance deadlines spanning 2027 to 2028 depending on classification. On standards, IEC 60601-2-47 remains a core international reference for safety and essential performance for ambulatory electrocardiographic systems, and MDR-era scrutiny has raised cybersecurity, encryption, and testing expectations for cloud-connected ECG platforms referenced in the report context.
Competitive Landscape
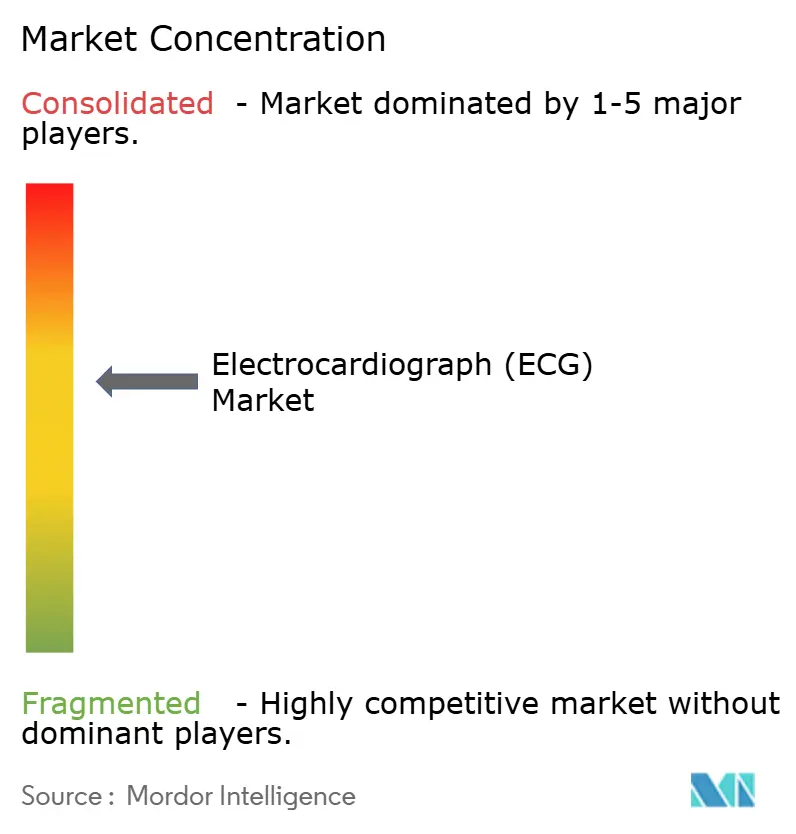
Moderate fragmentation defines the Electrocardiograph (ECG) market: the top five vendors, Philips, GE, Nihon Kohden, Schiller, and Medtronic, together hold majority share of global revenue. They compete on multi-lead fidelity, clinical validation, and EHR integration, justifying premiums of 30-50% over commodity devices. Consumer-electronics firms like Apple and Samsung command single-lead volume at negligible marginal cost but lack hospital clearances.
Startup dynamism is notable. AliveCor’s USD 99 KardiaMobile posted 42% sales growth in 2025. iRhythm’s Zio Patch prescriptions rose significantly, reflecting cardiologists’ preference for 14-day wear time. Edge analytics for emergency vehicles and sub-USD 99 embedded modules for automotive OEMs are emerging white spaces.
Cybersecurity is a new differentiator. Vendors achieving ISO 27001 certification win enterprise contracts as hospitals harden defenses after 2025 ransomware events. Asia-Pacific firms such as Mindray and EDAN capture cost-sensitive tenders by pricing 40-50% lower than Western peers without sacrificing cloud functionality.
Electrocardiograph (ECG) Industry Leaders
-
GE Healthcare
-
NIHON KOHDEN CORPORATION
-
Schiller AG
-
Medtronic Plc
-
Koninklijke Philips N.V.
- *Disclaimer: Major Players sorted in no particular order
Electrocardiograph (ECG) Market Companies Covered in this Report
- Abbott Laboratories
- AliveCor
- Apple
- BIOTRONIK
- BPL
- Cardiac Insight Inc.
- CardioComm Solutions
- Compumed Inc.
- EDAN Instruments
- Fukuda Denshi Co.
- GE Healthcare
- Baxter
- iRhythm Technologies
- Medtronic
- Mindray
- Nihon Kohden
- OMRON
- OSI Systems (Spacelabs)
- Koninklijke Philips
- Schiller
- Shenzhen Creative
Market Opportunities and Future Outlook
Regulatory clearances and product design trends point to whitespace for cable-free and fewer-lead solutions that can provide clinically useful surrogates for 12-lead outputs in home and ambulatory settings. In 2026, multiple FDA 510(k) clearances reinforced momentum in wearable and patch ecosystems, including HeartBeam receiving clearance for cable-free synthesized 12-lead ECG software for at-home arrhythmia assessment (February 2026), Infobionic receiving 510(k) clearance for the MoMe ARC wireless ambulatory ECG monitoring and detection system (May 2026), and Smwmed receiving 510(k) clearance for the Rhythm Master ECG Patch (May 2026). Alongside the report context of CMS enabling reimbursement for 30-day remote monitoring episodes via CPT 93264 (January 2025), these clearances support an expanded commercial path for vendors linking devices, analytics, and monitoring services.
Interoperability and workflow integration remain practical gatekeepers for scaling across large health systems, creating opportunities for ECG management software, cloud connectivity, and enterprise deployments that integrate into EHR environments (the report context notes Philips integrating with Epic and Cerner using FHIR). A near-term opportunity also centers on operational reliability and security for distributed fleets used outside traditional cardiology labs, including emergency vehicles and community screening sites, where device uptime, remote serviceability, and hardened cybersecurity can differentiate suppliers as cloud-connected ECG adoption increases (digital/cloud-connected devices represented 73.23% of 2025 revenue in the report context).
Recent Industry Developments in Electrocardiograph (ECG) Market
- February 2026: GE HealthCare launched the ReadyFix remote fleet management solution in the United States, supporting remote diagnostics and real-time device data for compatible ECG workstations such as the MAC VU360. The offering shifts ECG ownership economics toward higher uptime and lower on-site service burden, supporting large hospital networks running distributed ECG fleets.
- September 2025: Nihon Kohden launched the cardiolife TEC-1000 series bedside monitors. This update strengthens the companys acute-care monitoring portfolio where integrated ECG and network connectivity influence purchasing decisions tied to staffing constraints and centralized oversight.
- September 2024: Nihon Kohden introduced RemoteSense as a remote patient monitoring solution for managing multiple patients across locations. This expanded the companys footprint in distributed monitoring workflows and reinforced the market shift from episodic, facility-based ECG to networked and remotely supervised cardiac monitoring.
Electrocardiograph (ECG) Market Report Scope and Research Methodology
Market Definition and Coverage
For this study, the electrocardiograph (ECG) market covers equipment and solutions used to record and manage a patient ECG signal for clinical diagnosis and monitoring across care settings, including portable and connected form factors.
Scope exclusions: We exclude non-ECG cardiac imaging and treatment devices (such as ultrasound systems, CT, and therapeutic implants) even when they appear in the same cardiology workflow.
Segments Covered in This Report
- By Product Type
- Resting ECG Systems
- Stress ECG Systems
- Holter Monitors
- Event Recorders
- Wearable / Patch ECG Devices
- ECG Management Software
- By Lead Type
- Single-Lead ECG
- 3–6 Lead ECG
- 12-Lead ECG
- Others
- By End User
- Hospitals & Clinics
- Ambulatory Surgical Centers
- Home Settings / Remote Patients
- Diagnostic Labs & Cardiac Centers
- By Technology
- Analog ECG Devices
- Digital / Cloud-connected ECG Devices
- By Geography
- North America
- United States
- Canada
- Mexico
- Europe
- Germany
- United Kingdom
- France
- Italy
- Spain
- Rest of Europe
- Asia-Pacific
- China
- India
- Japan
- South Korea
- Australia
- Rest of Asia-Pacific
- Middle East and Africa
- GCC
- South Africa
- Rest of Middle East and Africa
- South America
- Brazil
- Argentina
- Rest of South America
- North America
Data Sources, Market Sizing, and Validation
Desk Research
Desk research is used to set the fact base for demand drivers and healthcare delivery patterns that influence ECG testing and monitoring. We review public health and utilization signals from sources such as the World Health Organization, the US CDC, the US FDA device and safety communications, and OECD health statistics, and we align them with cardiology society guidance (AHA and ESC publications) to keep the clinical context consistent.
Financial and competitive inputs are added through company annual reports, investor presentations, and reputable healthcare press. This helps us track product mix shifts such as wearable patches and ECG management software. To reduce blind spots where smaller disclosures are limited, we also use a paid subscription focused on company financials and intelligence and another paid subscription for patent and innovation tracking. Together, these support checks on the timing of adoption for newer form factors. The sources listed here are illustrative only, and other public references are also used for data collection, validation, and clarification during the work.
Primary Interviews and Surveys
Primary work is used to pressure test the desk assumptions and convert clinical and shipment narratives into measurable sizing inputs. We speak with a mix of device-side roles, distributors, and hospital and diagnostic center stakeholders across APAC, EMEA, and the Americas, so adoption patterns for resting, stress, Holter, event, and wearable ECG are captured across different care pathways. Pricing steps, replacement cycles, and software attach rates are the main items that get clarified. We then recheck these inputs when the model shows unexpected jumps.
Distribution of primary research fieldwork respondents
| Company type | Respondent position | Region |
|---|---|---|
| Top tier: 34% | CXOs: 15% | APAC: 43% |
| Mid tier: 46% | Functional/Unit leaders: 36% | EMEA: 31% |
| Smaller Players: 20% | Managers: 49% | Americas: 26% |
Market-Sizing & Forecasting
Sizing starts from a top-down build that reconstructs the demand pool using healthcare delivery signals (cardiovascular burden, diagnostic testing volumes, and care setting mix). We then convert that pool into device and software revenue using penetration and replacement assumptions. When care pathway behavior differs by setting, we handle it separately so inpatient ECG throughput is not mixed with ambulatory and home monitoring behavior.
To keep the totals realistic, we corroborate outputs with selective bottom-up approximations. These include sampled average selling price ranges for resting and stress ECG systems, estimated unit placements in hospitals and diagnostic labs, and channel feedback on wearable patch volumes and software attach rates. Key model inputs include replacement cycles for installed systems, average leads and accessories consumption patterns where relevant, the share shift toward portable and connected ECG, the mix of 12-lead versus lower lead count solutions, and regional reimbursement and screening intensity indicators that change utilization. Where smaller country data is limited, we use proxy ratios built from similar healthcare spend and care delivery metrics, followed by expert checks.
For forecasting, we run scenario analysis supported by variable-level expert consensus, because demand depends on a small set of practical levers that can shift with policy and care delivery changes. In each scenario, pricing progression is updated using inflation and mix-shift logic, and then volumes are adjusted using adoption timing for wearables, outpatient expansion, and hospital capex cycles.
Data Validation & Update Cycle
Validation is done through multi-step checks that compare the model outputs against independent signals, and then we explain any gaps before sign-off. We review year-over-year swings by region and product group, recheck outliers against interview notes and public announcements, and then run variance checks on pricing, volumes, and penetration assumptions so no single input drives the full result.
Reports are refreshed annually. Interim updates are made when material events affect pricing, regulation, or demand patterns. Before delivery, an analyst completes a fresh pass on the latest public data and re-contacts select experts when assumptions are likely to have shifted, so clients receive an updated view rather than an older frozen model.
Mordor Intelligence's Global Electrocardiograph Ecg Market Market Size Compared With Other Published Estimates
Published market sizes for electrocardiograph (ECG) can appear far apart when the scope is not defined the same way, and the mix of products and care settings changes quickly. Differences also come from how each publisher treats software revenue, wearable patches, and the timing of price updates across regions.
Some published figures bundle broader cardiac monitoring and connected care layers into the total, which can raise the headline number when adjacent non-ECG items are included. In Mordor Intelligence, the count is limited to ECG systems and closely tied ECG devices and software categories. This is kept consistent using checks such as lead-type mix, care setting adoption, and replacement-cycle logic, which are refreshed using expert feedback.
Benchmark comparison
| Source | Market Size | Gaps in Research Methodology |
|---|---|---|
| Mordor Intelligence | USD 7.81 B (2025) | |
| Trade Journal B | USD 6.47 B (2025) | Often uses a narrower device-only view and may undercount ECG management software and newer wearable patch formats, and it can also apply conservative price progression over the forecast window. |
| Global Consultancy A | USD 11.00 B (2025) | Tends to use a wider umbrella that can blend adjacent monitoring categories and broader connected care revenue, and it may rely on higher penetration assumptions for wearables across regions without the same replacement-cycle cross-checks. |
The spread in the table mostly comes down to what is treated as in-scope ECG revenue and how fast pricing and adoption are allowed to move year to year. By keeping the variables tied to practical signals such as utilization, installed-base replacement, and product mix shifts, the estimate stays traceable and easier to replicate when the same inputs are updated.
Key Questions Answered in the Report
What growth rate is projected for the Electrocardiograph ECG market through 2031?
The market is forecast to advance at a 7.92% CAGR from 2026 to 2031.
Which product type is expanding fastest?
Wearable and patch ECG devices are growing at an 8.11% CAGR on the back of new reimbursement codes in major markets.
Why is Asia-Pacific the quickest-growing region?
Government-funded mass screening in China and India, coupled with local manufacturing scale-up, drives an 8.81% CAGR through 2031.
How are AI algorithms influencing device adoption?
FDA-cleared AI-ECG algorithms shorten diagnosis times and boost clinician confidence, accelerating the shift toward cloud-connected systems.
What cybersecurity measures are vendors adopting?
Following a major ransomware incident in 2025, leading suppliers now certify to ISO 27001 and implement end-to-end encryption across cloud platforms.