Electric Two-Wheeler Market Size and Share
Market Overview
| Study Period | 2019 - 2031 |
|---|---|
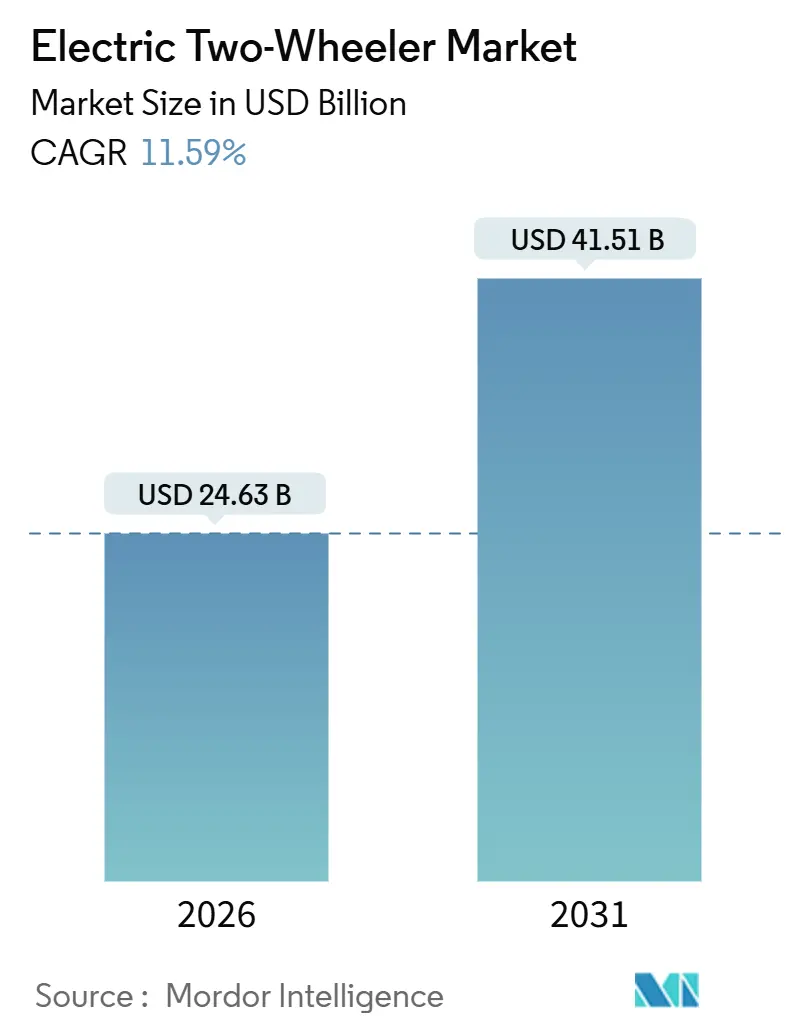
| Market Size (2026) | USD 24.63 Billion |
| Market Size (2031) | USD 41.51 Billion |
| Growth Rate (2026 - 2031) | 11.59% CAGR |
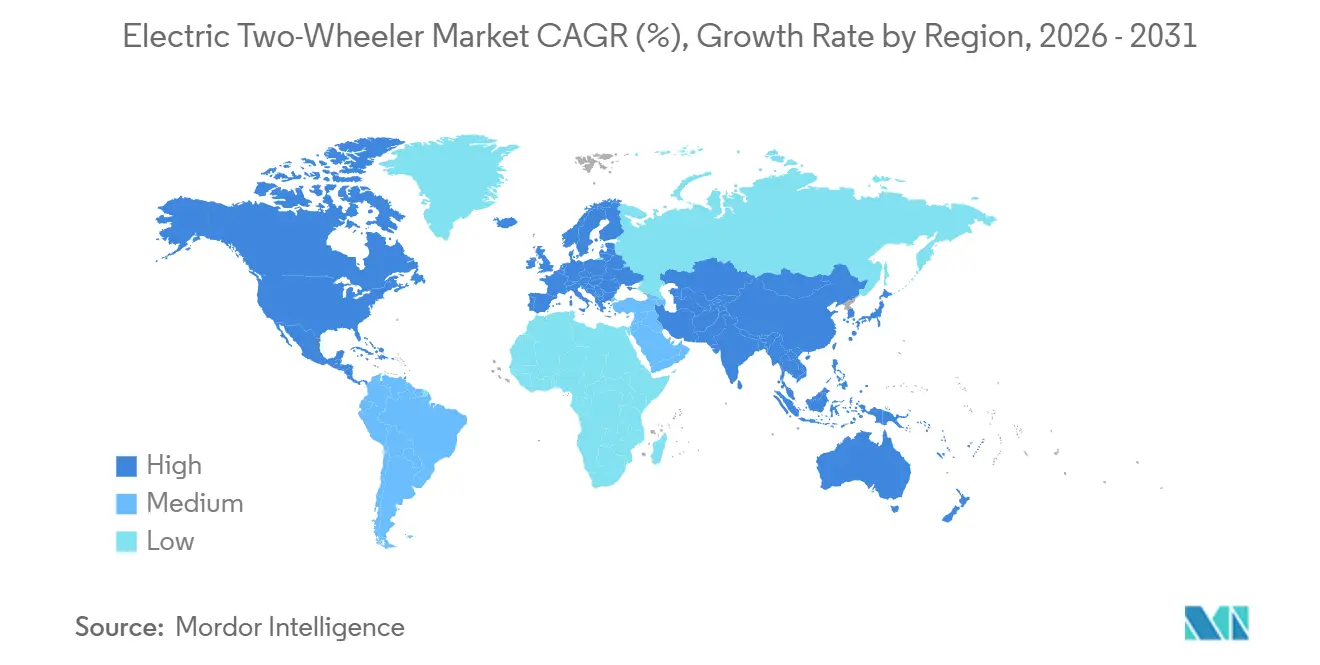
| Fastest Growing Market | Middle East and Africa |
| Largest Market | Asia-Pacific |
| Market Concentration | Medium |
Major Players*Disclaimer: Major Players sorted in no particular order Image © Mordor Intelligence. Reuse requires attribution under CC BY 4.0. | |
Electric Two-Wheeler Market Analysis by Mordor Intelligence
The Electric Two-Wheeler Market size is estimated at USD 24.63 billion in 2026, and is expected to reach USD 41.51 billion by 2031, at a CAGR of 11.59% during the forecast period (2026-2031). In recent years, lithium-ion battery pack prices have significantly decreased, with expectations of further reductions in the near future. This trend is making the total cost of ownership more favorable for electric vehicles across various Asian nations. Numerous cities have implemented urban low-emission zones, introducing stricter entry regulations for combustion scooters, which is further driving the transition to electric adoption. The competitive landscape has shifted focus from basic subsidies to prioritizing longer battery warranties, connected services, and brand credibility, as consumers increasingly evaluate residual value and safety records. Fleets supporting the gig economy have emerged as early adopters, benefiting from the substantial fuel-saving advantages associated with high daily usage.
Key Report Takeaways
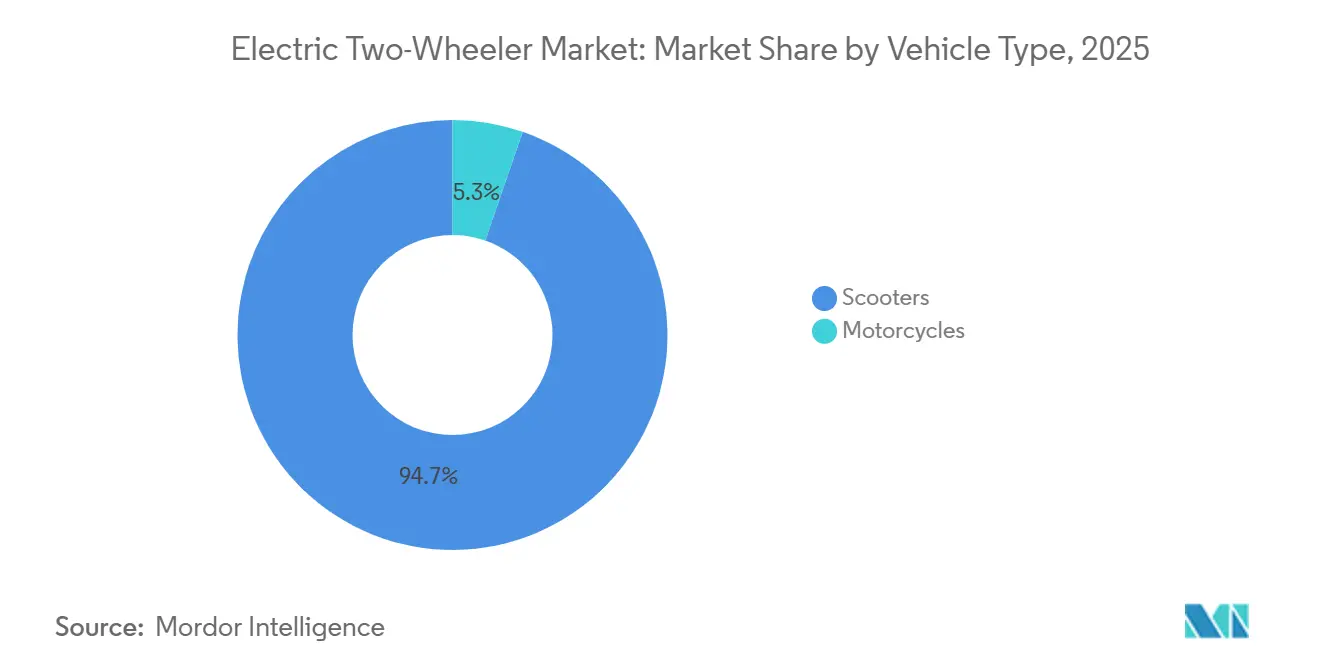
- By vehicle type, scooters captured 94.71% of the electric two-wheeler market share in 2025, while motorcycles recorded the fastest CAGR at 11.61% through 2031.
- By motor power, the 1.1–3.0 kW band commanded 39.78% share in 2025, and the above-5.0 kW segment is forecast to expand at 11.67% CAGR to 2031.
- By voltage platform, 60 V models led with 37.73% revenue share in 2025, whereas 72 V platforms are expected to advance at an 11.71% CAGR over the outlook period.
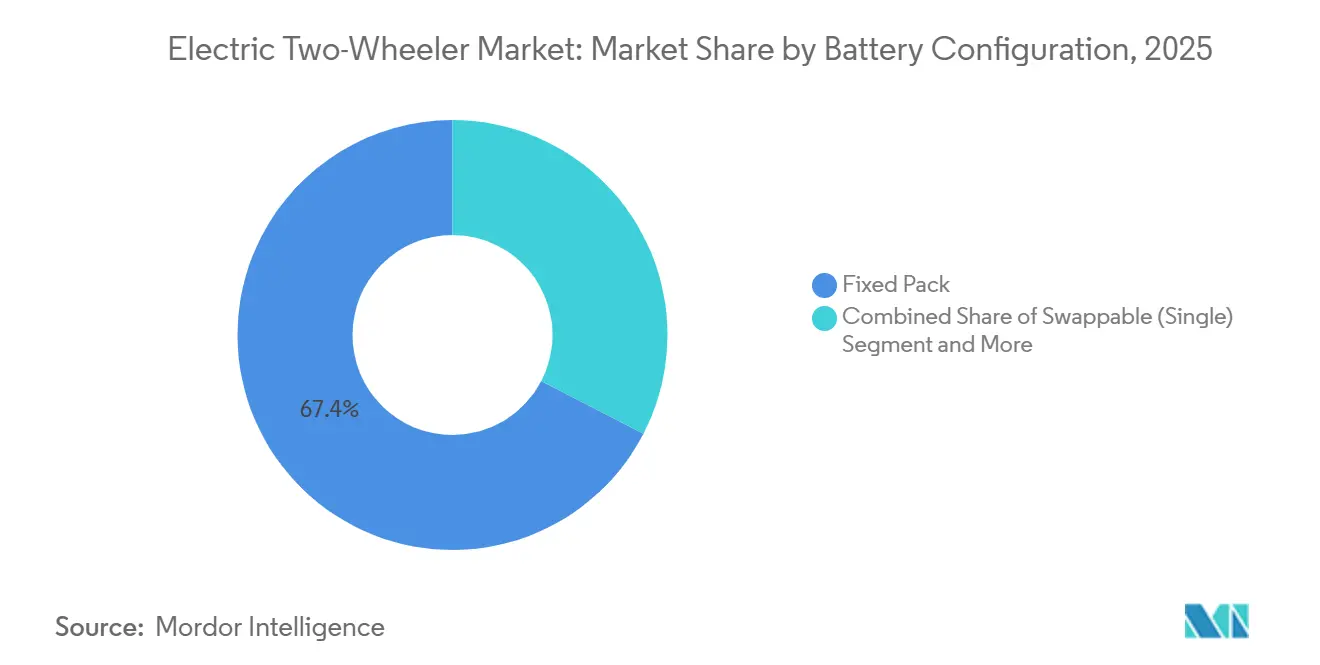
- By battery configuration, fixed packs accounted for 67.37% of the electric two-wheeler market size in 2025, but dual-swappable systems are poised to grow at 11.79% CAGR to 2031.
- By motor type, BLDC units controlled a 68.71% share in 2025, and PMSM alternatives will post the highest CAGR of 11.63% during the forecast.
- By price band, models priced USD 1,001–1,500 represented 34.46% of sales in 2025, while the USD 3,001–5,000 bracket is projected to rise at an 11.78% CAGR.
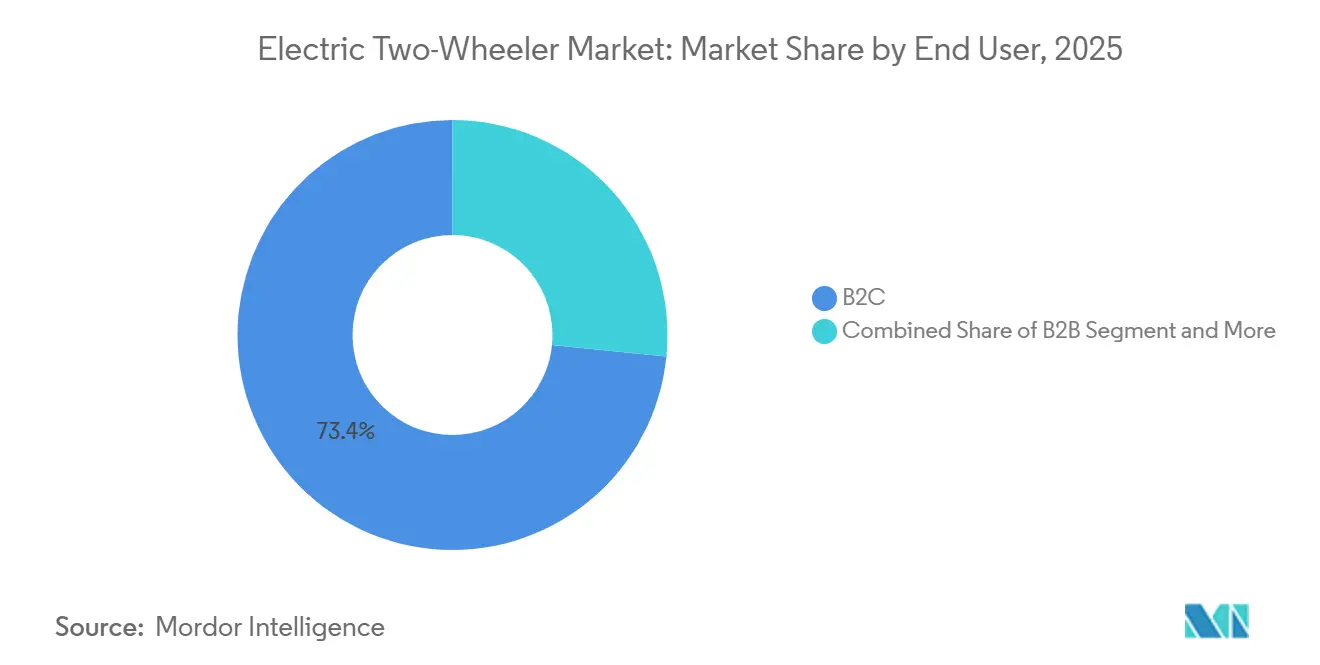
- By end user, B2C customers bought 73.37% of units in 2025, and delivery fleets are on course for an 11.72% CAGR through 2031.
- By sales channel, offline outlets held 66.61% of volume in 2025, yet online direct-to-consumer platforms will expand at 11.75% CAGR.
- By geography, Asia Pacific dominated with a 66.08% share in 2025, whereas the Middle East and Africa region will log the fastest CAGR of 11.65% to 2031.
Note: Market size and forecast figures in this report are generated using Mordor Intelligence’s proprietary estimation framework, updated with the latest available data and insights as of January 2026.
Global Electric Two-Wheeler Market Trends and Insights
Drivers Impact Analysis
| Driver | (~) % Impact on CAGR Forecast | Geographic Relevance | Impact Timeline |
|---|---|---|---|
| Falling Battery Prices Accelerate TCO Parity | +2.8% | Global, with early gains in China, India, Southeast Asia | Medium term (2-4 years) |
| Rapid Growth of Gig-Economy Delivery Fleets | +2.4% | India, China, Southeast Asia, Latin America | Short term (≤ 2 years) |
| Urban Low-Emission-Zone Policies Spur Adoption | +2.1% | Europe core, spreading to Asia Pacific metros | Short term (≤ 2 years) |
| Localised Cell-To-Pack Manufacturing Incentives | +1.9% | India, Indonesia, Thailand, European Union | Medium term (2-4 years) |
| OEM Modular Platforms Cut Development Cycles | +1.3% | Global, led by Asia Pacific and Europe | Medium term (2-4 years) |
| AI-Based Battery Management Extends Warranty Life | +1.1% | Global, premium segments first | Long term (≥ 4 years) |
| Source: Mordor Intelligence | |||
Falling Battery Prices Accelerate TCO Parity
In 2024, lithium-ion pack costs experienced a significant decline, marking a notable year-on-year reduction. Projections suggest further decreases in the near future. Achieving this milestone eliminates the upfront premium over 125 cc petrol scooters in markets like India, Indonesia, and Vietnam. This shift paves the way for organic demand, independent of subsidies. Notably, in Tier-2 Indian cities, brands like Ather Energy and TVS Motor report that sales of electric scooters, free from subsidies, now account for a substantial portion of their monthly volumes. Manufacturers are channeling these cost savings into enhanced offerings; for instance, Ola Electric rolled out an extended warranty program in early 2025 [1]“Battery Warranty Announcement March 2025,” Ola Electric, olaelectric.com . Supply-chain scale rather than regulation remains the dominant catalyst for this driver.
Rapid Growth of Gig-Economy Delivery Fleets
Food-delivery platforms, such as Zomato, are setting ambitious targets, aiming for a significant number of electric units by the end of the decade. Meanwhile, Swiggy has inked a deal with Zypp Electric, planning to roll out a substantial fleet of scooters within the next few years. With daily runs covering moderate to long distances, electric vehicles can reduce total ownership costs significantly compared to petrol, especially when battery swapping minimizes downtime. In 2024, Gogoro clinched fleet contracts with Uber and Rapido, establishing a presence in Bangalore and Hyderabad, due to its extensive swap-station network [2]“Global Network Statistics 2025,” Gogoro Inc., gogoro.com . Under government mandates, Indonesia’s GoTo Group is on track to electrify a considerable portion of its Gojek fleet within the next few years, underscoring Asia's leading role in the electric vehicle push. While standardized swapping protocols face fragmentation outside Taiwan, the formation of consortia hints at a future convergence.
Urban Low-Emission-Zone Policies Spur Adoption
By mid-2025, several cities, compared to a smaller number in 2023, will have tightened penalties on petrol two-wheelers by enforcing low-emission or zero-emission zones. In Delhi, Stage-IV rules impose significant fines on scooters manufactured before a specific year. Meanwhile, Amsterdam's upcoming ring-road ban has significantly boosted the electric share of new registrations. London's expanded Ultra Low Emission Zone has driven a substantial increase in electric two-wheeler registrations in the first half of 2024. To sidestep daily penalties, last-mile operators are accelerating fleet conversions and shortening purchase cycles. While enforcement varies in emerging markets, stricter Euro 5+ standards are further limiting combustion alternatives.
Localised Cell-To-Pack Manufacturing Incentives
India's Production-Linked Incentive program, Indonesia's import duty on EV cells, and the EU's Green Deal tax credits are fueling domestic battery manufacturing. Ola Electric's plant in Tamil Nadu aims for a significant annual cell-to-pack capacity. Meanwhile, Amara Raja Advanced Cell Technologies has teamed up with InoBat to localize lithium-ion production. By sourcing locally, companies reduce logistics costs, shorten lead times, and protect themselves from geopolitical disruptions in raw material trade. These incentives, tied to domestic value-addition benchmarks, are driving suppliers towards vertical integration. This integration leads to cost reductions, enhancing price competitiveness even as subsidies diminish.
Restraints Impact Analysis
| Restraint | (~) % Impact on CAGR Forecast | Geographic Relevance | Impact Timeline |
|---|---|---|---|
| Subsidy Phase-Outs | -1.8% | China, Germany, France, Scandinavia | Short term (≤ 2 years) |
| 2W-Specific Finance Remains Under-Penetrated | -1.5% | India, Southeast Asia, Latin America, Africa | Medium term (2-4 years) |
| Fragmented Charging Standards Hamper Roaming | -1.2% | Global, acute in Europe and North America | Short term (≤ 2 years) |
| Thermal Events Damage Consumer Trust | -1.1% | Global, acute in India and China | Short term (≤ 2 years) |
| Source: Mordor Intelligence | |||
Subsidy Phase-Outs in China & Europe
In early 2024, Germany's termination of purchase grants in late 2023 and France's reduction of its ecological bonus at the beginning of 2024 resulted in significant declines in registrations. While China ended direct consumer subsidies in late 2022, purchase-tax exemptions remain in effect for a few more years. As incentives dwindle, OEMs are compelled to tighten their bill-of-materials costs, particularly impacting smaller players with limited scale. Markets like India's FAME-II scheme, known for their predictable multiyear programs, showcase steadier demand curves. Given the fiscal pressures, it's likely that any future extensions will be less generous, underscoring the importance of intrinsic cost competitiveness.
Fragmented Charging Standards Hamper Roaming
Competing connector types such as CCS2, Type 2, and GB/T inflate hardware cost for charge-point operators and create range anxiety for riders venturing beyond metro corridors. India’s AIS-156 Phase 2 mandates CAN bus communication yet leaves voltage flexibility, perpetuating partial interoperability. Riders, therefore, restrict trips to intra-city errands, allowing combustion models to retain inter-city touring niches. ISO and SAE standardization drafts remain under review, and formal ratification is unlikely before 2027. Infrastructure investors must deploy multi-standard dispensers, raising capital intensity.
Geography Analysis
The Asia Pacific region commanded 66.08% of the global volume in 2025, accounting for the majority of the total volume. This was largely driven by China's significant installed base and India's notable sales in 2024. While China's market showed signs of maturation with modest growth in 2024, it led industry leaders like Yadea to pivot, redirecting a portion of their production towards exports by mid-2025. On the other hand, buoyed by FAME-II incentives and state-level top-ups that substantially reduced purchase prices, India witnessed robust expansion in 2024. Southeast Asian countries, notably Indonesia, Vietnam, and Thailand, have set their sights on achieving a substantial number of electric two-wheelers by 2030, driven by domestic-assembly mandates aimed at safeguarding local jobs.
Europe, holding a significant share in 2025, is grappling with momentum dampened by subsidy rollbacks. A halt to Germany’s Umweltbonus in late 2023 led to a notable decline in registrations during the early months of 2024. Meanwhile, France’s reduction in bonuses shrank the market considerably. The UK mandates compliance with a zero-emission quota, yet consumer enthusiasm lags. However, the Netherlands and Spain shine brighter, buoyed by urban designs favoring cycling and supportive EV policies. Notably, Amsterdam's ban on petrol scooters propelled electric vehicles to a dominant share of new registrations in 2025.
North America, the Middle East, and Africa each contributed a small portion to the 2025 volume, yet their trajectories diverged. In the U.S., adoption leans heavily towards recreational use, with LiveWire and Zero managing modest unit sales in 2024. In Canada, a rebate is spurring sales in British Columbia and Quebec, though cold weather-induced range losses cast a shadow on resale values. The Middle East and Africa offer the fastest regional CAGR at 11.65% amid Saudi and UAE government fleet targets. South Africa’s off-peak charging tariff, set at ZAR 0.90 per kWh, encourages adoption, though load-shedding disrupts reliability. Brazil and Argentina remain subscale, limited by import duties and scant local assembly, but Brazil’s Rota 2030 is opening IPI tax relief for domestically built units.
Segment Analysis
By Vehicle Type: Scooters Retain Scale, Motorcycles Capture Performance-Minded Buyers
Scooters dominated the electric two-wheeler market with 94.71% of global volume in 2025. Their step-through design, under-seat storage, and lightweight frames suit congested urban trips and courier stops. Delivery platforms prefer scooters because riders can mount and dismount quickly, lowering service times. Motorcycles, although a residual share, are expanding at 11.61% CAGR as performance-oriented riders seek highway-legal speed ceilings and aggressive styling. Revolt’s RV400 and Emflux’s liquid-cooled ONE exemplify this transition toward higher power figures.
Momentum around motorcycles suggests a bifurcation of the electric two-wheeler market. Mass-market adoption will remain scooter-centric through 2031; however, premium customers are willing to pay for acceleration under four seconds and 100 km-plus real-world range. Brands with combustion heritage in sport and touring categories hold latent brand equity that they can leverage once battery cost curves allow. Conversely, scooter incumbents risk losing aspirational buyers unless they extend line-ups into motorcycle silhouettes. Segment innovation, therefore, revolves around expanding form factors rather than incremental range gains.
By Motor Power: Mid-Range Dominates, High-Power Gains Traction
Models in the 1.1–3.0 kW bracket accounted for 39.78% of sales in 2025, balancing cost, curb weight, and city-grade performance. They suit daily commutes under 60 km and remain the default for price-sensitive buyers. Yet the above-5.0 kW class is the fastest-growing, logging an 11.67% CAGR as ASEAN and Latin American regulators align licensing norms so higher-output scooters can share arterial roads with cars. Ather’s 450 Apex demonstrates the appeal of near-instant torque at traffic lights without sacrificing range.
The low-power less than or equal to 1.0 kW sub-segment, once popular in China’s rural regions, is losing relevance because dropping battery prices erode the savings that justified limited performance. Conversely, the mid-power 3.1–5.0 kW tier is becoming a transitional step for riders upgrading from entry scooters but not yet ready to absorb the price premium or added weight of larger batteries. Power-class distribution will keep tilting upward as the cost per kWh settles below USD 90, enabling OEMs to ship larger packs without overshooting mass-market price bands.
By Voltage Platform: Sixty-Volt Leads, Seventy-Two-Volt Surges on Fast Charging
Sixty-volt systems held 37.73% of the electric two-wheeler market share in 2025, largely because their component ecosystem—controllers, chargers, and battery modules—is mature and cost-optimized. Seventy-two-volt platforms, however, are growing at an 11.71% CAGR, aided by DC fast-chargers that deliver 3 kW and reduce minimal charge times to around 90 minutes. Gogoro uses 50.4 V packs in series to reach 100.8 V for high-duty cycles, demonstrating the flexibility of modular configurations.
Growing public-charging density influences voltage selection more than intrinsic efficiency because owners now cross-shop vehicles against the availability of compatible hardware. Forty-eight-volt architectures, once dominant in lead-acid conversions, are sliding as lithium chemistries eliminate past voltage ceilings. Experimental 96-V and 120-V prototypes will remain niche until standards emerge. OEMs therefore face a strategic trade-off: align with prevailing grid voltage norms or risk orphaning customers when traveling outside urban centers.
By Battery Configuration: Fixed Packs Stay Mainstream, Dual-Swappable Earn Fleet Preference
Fixed batteries accounted for 67.37% of units in 2025 owing to lower bill-of-materials cost and straightforward assembly. Dual-swappable formats, although under a minimal total volume, are climbing at 11.79% CAGR because courier fleets prize uptime over sticker price. Zypp Electric alone deployed 25,000 dual-pack scooters across three Indian metros by mid-2025.
Single-swappable solutions appeal to individual riders lacking dense swap infrastructure but wanting occasional rapid turnaround. India’s AIS-156 Phase 2 standard now enforces mechanical and electrical interoperability for swappable kits, a move expected to widen OEM participation. Fixed-pack advocates argue that upcoming sodium-ion chemistries could deliver an acceptable range at even lower cost, extending the lifecycle of fixed architectures. Configuration choice thus maps to business model: fleets chase operational uptime, while consumers still value simplified ownership.
Note: Segment shares of all individual segments available upon report purchase
By Motor Type: BLDC Dominates Cost Curve, PMSM Targets Premium Efficiency
Brushless DC units claimed 68.71% of shipments in 2025 due to lower magnet material content and simpler control electronics. Permanent-magnet synchronous motors are expanding at an 11.63% CAGR by delivering better efficiency, extending range for the same battery capacity. Ather’s 450 range leverages PMSM to extract 26 Nm of peak torque from a 7.2 kW motor.
Rare-earth supply concentration in China is a strategic risk for PMSM scale-up, prompting brands like Bajaj to dual-source. Switched-reluctance and induction types remain fringe because of audible noise and control complexity. Motor choice increasingly tracks price band: sub-USD 1,500 scooters default to BLDC, while premium models standardize PMSM to justify higher MSRPs through superior acceleration and hill-climb capability.
By Price Band: Mid-Segment Leads, Premium Bracket Accelerates
Scooters priced USD 1,001–1,500 captured 34.46% of global sales in 2025, aligning with the median disposable income in major Asian economies. The USD 3,001–5,000 segment, although just a few in volume, is growing at 11.78% CAGR as urban professionals pay for longer warranties, smartphone-grade displays, and advanced safety aids. Ola’s S1 Pro sits in the sweet spot at USD 1,350 and bundles a 3.97 kWh battery good for 181 km of claimed range.
Sub-USD 1,000 units are being commoditized out of profitability because falling battery expenses enable better-spec models for only modest extra cost. In Europe and North America, the premium above-USD 5,000 band remains niche but profitable, anchored by brands that bundle ABS, traction control, and 70 km/h top speeds. Rising GDP per capita in Asia will nudge buyers toward higher brackets, flattening the steepness of the current price pyramid.
By End User: B2C Retains Volume, Fleets Drive Incremental Growth
Individual consumers owned 73.37% of the electric two-wheeler market size in 2025, attracted by reduced maintenance and avoidance of fuel price volatility. Delivery fleets, however, are posting an 11.72% CAGR because high mileage amplifies operating savings. Zomato, Swiggy, and Amazon Fresh now require eight-year battery warranties and real-time state-of-health telemetry before signing supply contracts.
Ride-hail, rental, and corporate security fleets form a strategic niche, often benefiting from bulk discounts and shared charging infrastructure. Government procurement is small in unit terms yet symbolically influential; India’s postal service ordered numerous electric scooters in March 2025, signaling rural deployment potential. The future share balance hinges on the pace at which gig-economy platforms electrify and on policy directives that link license renewals to emission targets.
Note: Segment shares of all individual segments available upon report purchase
By Sales Channel: Physical Stores Dominate, Digital Direct Gains Momentum
Offline dealers processed 66.61% of transactions in 2025 because many buyers demand test rides and in-person financing assistance. Online direct-to-consumer models are expanding at 11.75% CAGR, especially in markets with mature digital-payment systems such as India, where UPI handled numerous transactions in March 2025. Ola sells exclusively through its app and website, shipping scooters directly to customers' homes.
Hybrid approaches are emerging: Ather operates multiple experience centers while fulfilling almost half of orders online, blending tactile engagement with digital convenience. Offline share will erode gradually, but will not vanish because after-sales perception remains tied to physical service centers. Eventually, omnichannel models will dominate as OEMs recognize that discovery often happens online, even when the final payment occurs in a showroom.
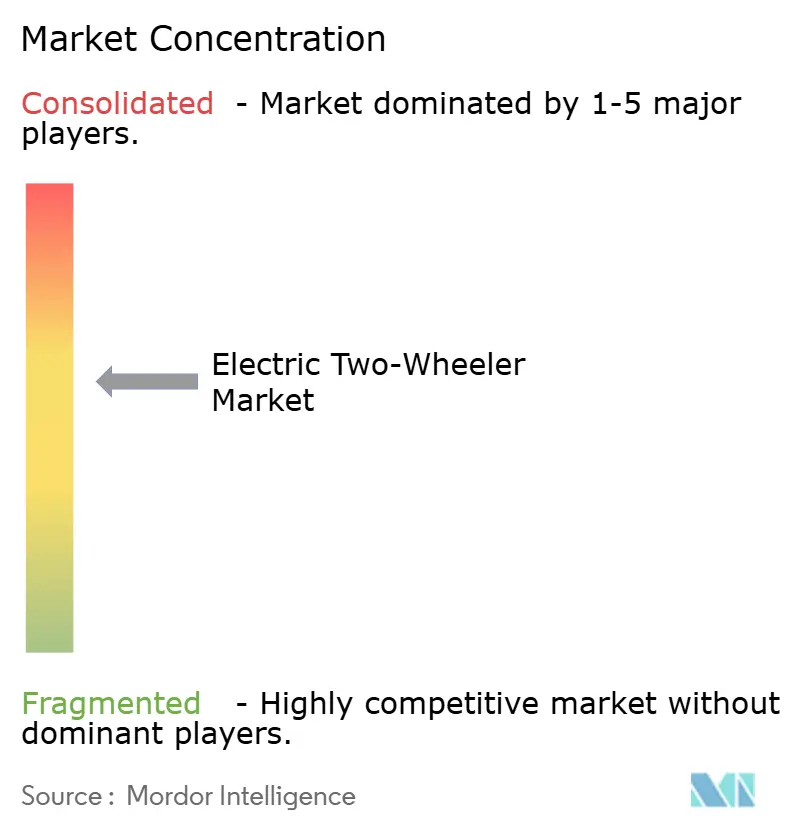
Competitive Landscape
In the mid-term future, the top five brands—Yadea, Aima, Xinri, Hero Electric, and Ola Electric—accounted for a significant portion of global shipments, highlighting a moderate market concentration. As subsidy buffers diminish, the competitive landscape has shifted from mere price reductions to emphasizing feature differentiation. Manufacturers are now touting benefits like long-term warranty coverage, over-the-air software updates, and predictive maintenance dashboards leveraging battery telemetry. These assurances have become pivotal for fleet managers during bulk order negotiations, given that any downtime can significantly impact earnings.
Geographical nuances shape strategic directions. In response to waning domestic demand, Chinese frontrunners are steering towards export-led growth, forging partnerships in Southeast Asia and Latin America. Meanwhile, Indian contenders are channeling investments into expansive domestic capacities, eyeing a rapidly growing market. In a bid to alleviate range anxiety and secure consistent revenue from energy subscriptions, Gogoro, in collaboration with Hero MotoCorp, is set to unveil a substantial number of swap stations in the coming years, under a pioneering open-battery alliance.
As the availability and cost of cells play a pivotal role in determining margins, vertical integration is becoming increasingly prevalent. Ola’s Futurefactory, which integrates cell-to-pack, motor winding, and final assembly processes, is not only reducing logistics costs but also expediting cash cycles. Compliance mandates, like Europe’s Battery Passport, are poised to elevate entry barriers by necessitating disclosures on recycled content and ensuring supply-chain traceability. This could spell trouble for smaller players, who might find themselves priced out unless they either participate in pooling programs or secure technology licenses from their larger counterparts. In this evolving landscape, brands that excel in battery analytics, prioritize customer experience, and invest in localized manufacturing stand to solidify their market share.
Electric Two-Wheeler Industry Leaders
Gogoro Limited
Hero Electric Vehicles Pvt. Ltd.
Jiangsu Xinri E-Vehicle Co. Ltd.
VMOTO SOCO ITALY SRL
Yadea Group Holdings Ltd.
- *Disclaimer: Major Players sorted in no particular order
Recent Industry Developments
- January 2026: TVS Motor unveiled a revised electric scooter with higher battery capacity, stronger motor output, and faster charging to address prior range anxiety concerns.
- January 2026: Simple Energy introduced Gen 2 versions of Simple One and One S and revealed the Simple Ultra equipped with a 6.5 kWh battery, claiming 400 km IDC range—the largest pack offered on an Indian scooter.
Global Electric Two-Wheeler Market Report Scope
The scope of the report includes Vehicle Type (Scooters and Motorcycles), Motor Power (Less Than or Equal To 1. 0 KW and More), Voltage (48 V, 60 V, 72 V, and Others), Battery Config (Fixed and More), Motor Type (BLDC and Others), Price Band (Less Than or Equal To USD 1, 000 and More), End User (B2C and More), Sales Channel (Online and Offline), and Geography.
| Scooters |
| Motorcycles |
| Less than or equal to 1.0 kW |
| 1.1–3.0 kW |
| 3.1–5.0 kW |
| More than 5.0 kW |
| 48 V |
| 60 V |
| 72 V |
| Others |
| Fixed Pack |
| Swappable (Single) |
| Swappable (Dual) |
| BLDC |
| PMSM |
| Others |
| Less than or equal to 1,000 |
| 1,000–1,500 |
| 1,501–2,000 |
| 2,001–3,000 |
| 3,001–5,000 |
| More than 5,000 |
| B2C |
| B2B |
| Ride-hail / Bike-Taxi / Rental / Tourism |
| Delivery & Logistics |
| Corporate & SME Fleets |
| Others (Govt., NGO, Institutional) |
| Online |
| Offline |
| North America | United States |
| Canada | |
| Rest of North America | |
| South America | Brazil |
| Argentina | |
| Rest of South America | |
| Europe | Germany |
| United Kingdom | |
| France | |
| Italy | |
| Russia | |
| Spain | |
| Rest of Europe | |
| Asia Pacific | China |
| India | |
| Japan | |
| South Korea | |
| Rest of Asia Pacific | |
| Middle East and Africa | Saudi Arabia |
| United Arab Emirates | |
| South Africa | |
| Turkey | |
| Rest of Middle East and Africa |
| By Vehicle Type | Scooters | |
| Motorcycles | ||
| By Motor Power | Less than or equal to 1.0 kW | |
| 1.1–3.0 kW | ||
| 3.1–5.0 kW | ||
| More than 5.0 kW | ||
| By Voltage Platform | 48 V | |
| 60 V | ||
| 72 V | ||
| Others | ||
| By Battery Configuration | Fixed Pack | |
| Swappable (Single) | ||
| Swappable (Dual) | ||
| By Motor Type | BLDC | |
| PMSM | ||
| Others | ||
| By Price Band (USD) | Less than or equal to 1,000 | |
| 1,000–1,500 | ||
| 1,501–2,000 | ||
| 2,001–3,000 | ||
| 3,001–5,000 | ||
| More than 5,000 | ||
| By End User | B2C | |
| B2B | ||
| Ride-hail / Bike-Taxi / Rental / Tourism | ||
| Delivery & Logistics | ||
| Corporate & SME Fleets | ||
| Others (Govt., NGO, Institutional) | ||
| By Sales Channel | Online | |
| Offline | ||
| By Geography | North America | United States |
| Canada | ||
| Rest of North America | ||
| South America | Brazil | |
| Argentina | ||
| Rest of South America | ||
| Europe | Germany | |
| United Kingdom | ||
| France | ||
| Italy | ||
| Russia | ||
| Spain | ||
| Rest of Europe | ||
| Asia Pacific | China | |
| India | ||
| Japan | ||
| South Korea | ||
| Rest of Asia Pacific | ||
| Middle East and Africa | Saudi Arabia | |
| United Arab Emirates | ||
| South Africa | ||
| Turkey | ||
| Rest of Middle East and Africa | ||
Market Definition
- Vehicle Type - The category covers motorized two-wheelers.
- Vehicle Body Type - This includes Scooters and Motorcycles, while Kick-scooters and Bicycles are excluded.
- Fuel Category - The category exclusively covers electric propulsion systems, while Internal Combustion Engines (ICE) are excluded.
| Keyword | Definition |
|---|---|
| Electric Vehicle (EV) | A vehicle which uses one or more electric motors for propulsion. Includes cars, buses, and trucks. This term includes all-electric vehicles or battery electric vehicles and plug-in hybrid electric vehicles. |
| BEV | A BEV relies completely on a battery and a motor for propulsion. The battery in the vehicle must be charged by plugging it into an outlet or public charging station. BEVs do not have an ICE and hence are pollution-free. They have a low cost of operation and reduced engine noise as compared to conventional fuel engines. However, they have a shorter range and higher prices than their equivalent gasoline models. |
| PEV | A plug-in electric vehicle is an electric vehicle that can be externally charged and generally includes all-electric vehicles as well as plug-in hybrids. |
| Plug-in Hybrid EV | A vehicle that can be powered either by an ICE or an electric motor. In contrast to normal hybrid EVs, they can be charged externally. |
| Internal combustion engine | An engine in which the burning of fuels occurs in a confined space called a combustion chamber. Usually run with gasoline/petrol or diesel. |
| Hybrid EV | A vehicle powered by an ICE in combination with one or more electric motors that use energy stored in batteries. These are continually recharged with power from the ICE and regenerative braking. |
| Commercial Vehicles | Commercial vehicles are motorized road vehicles designed for transporting people or goods. The category includes light commercial vehicles (LCVs) and medium and heavy-duty vehicles (M&HCV). |
| Passenger Vehicles | Passenger cars are electric motor– or engine-driven vehicles with at least four wheels. These vehicles are used for the transport of passengers and comprise no more than eight seats in addition to the driver’s seat. |
| Light Commercial Vehicles | Commercial vehicles that weigh less than 6,000 lb (Class 1) and in the range of 6,001–10,000 lb (Class 2) are covered under this category. |
| M&HDT | Commercial vehicles that weigh in the range of 10,001–14,000 lb (Class 3), 14,001–16,000 lb (Class 4), 16,001–19,500 lb (Class 5), 19,501–26,000 lb (Class 6), 26,001–33,000 lb (Class 7) and above 33,001 lb (Class 8) are covered under this category. |
| Bus | A mode of transportation that typically refers to a large vehicle designed to carry passengers over long distances. This includes transit bus, school bus, shuttle bus, and trolleybuses. |
| Diesel | It includes vehicles that use diesel as their primary fuel. A diesel engine vehicle have a compression-ignited injection system rather than the spark-ignited system used by most gasoline vehicles. In such vehicles, fuel is injected into the combustion chamber and ignited by the high temperature achieved when gas is greatly compressed. |
| Gasoline | It includes vehicles that use gas/petrol as their primary fuel. A gasoline car typically uses a spark-ignited internal combustion engine. In such vehicles, fuel is injected into either the intake manifold or the combustion chamber, where it is combined with air, and the air/fuel mixture is ignited by the spark from a spark plug. |
| LPG | It includes vehicles that use LPG as their primary fuel. Both dedicated and bi-fuel LPG vehicles are considered under the scope of the study. |
| CNG | It includes vehicles that use CNG as their primary fuel. These are vehicles that operate like gasoline-powered vehicles with spark-ignited internal combustion engines. |
| HEV | All the electric vehicles that use batteries and an internal combustion engine (ICE) as their primary source for propulsion are considered under this category. HEVs generally use a diesel-electric powertrain and are also known as hybrid diesel-electric vehicles. An HEV converts the vehicle momentum (kinetic energy) into electricity that recharges the battery when the vehicle slows down or stops. The battery of HEV cannot be charged using plug-in devices. |
| PHEV | PHEVs are powered by a battery as well as an ICE. The battery can be charged through either regenerative breaking using the ICE or by plugging into some external charging source. PHEVs have a better range than BEVs but are comparatively less eco-friendly. |
| Hatchback | These are compact-sized cars with a hatch-type door provided at the rear end. |
| Sedan | These are usually two- or four-door passenger cars, with a separate area provided at the rear end for luggage. |
| SUV | Popularly known as SUVs, these cars come with four-wheel drive, and usually have high ground clearance. These cars can also be used as off-road vehicles. |
| MPV | These are multi-purpose vehicles (also called minivans) designed to carry a larger number of passengers. They carry between five and seven people and have room for luggage too. They are usually taller than the average family saloon car, to provide greater headroom and ease of access, and they are usually front-wheel drive. |
Research Methodology
Mordor Intelligence follows a four-step methodology in all its reports.
- Step-1: Identify Key Variables: To build a robust forecasting methodology, the variables and factors identified in Step-1 are tested against available historical market numbers. Through an iterative process, the variables required for market forecast are set and the model is built based on these variables.
- Step-2: Build a Market Model: Market-size estimations for the historical and forecast years have been provided in revenue and volume terms. Market revenue is calculated by multiplying the sales volume with their respective average selling price (ASP). While estimating ASP factors like average inflation, market demand shift, manufacturing cost, technological advancement, and varying consumer preference, among others have been taken into account.
- Step-3: Validate and Finalize: In this important step, all market numbers, variables, and analyst calls are validated through an extensive network of primary research experts from the market studied. The respondents are selected across levels and functions to generate a holistic picture of the market studied.
- Step-4: Research Outputs: Syndicated Reports, Custom Consulting Assignments, Databases & Subscription Platforms.


