
E-prescribing Market Size and Share
Market Overview
| Study Period | 2020 - 2031 |
|---|---|
| Market Size (2026) | USD 5.19 Billion |
| Market Size (2031) | USD 14.82 Billion |
| Growth Rate (2026 - 2031) | 23.35 % |
| Fastest Growing Market | Asia Pacific |
| Largest Market | North America |
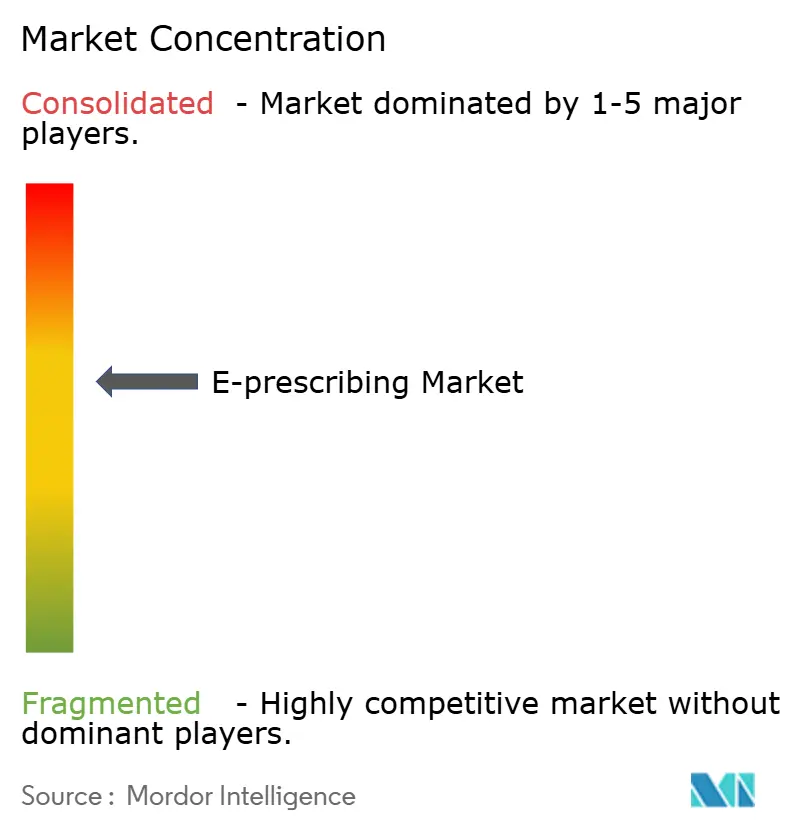
| Market Concentration | Medium |
Major Players *Disclaimer: Major Players sorted in no particular order Image © Mordor Intelligence. Reuse requires attribution under CC BY 4.0. | |
E-prescribing Market Analysis by Mordor Intelligence
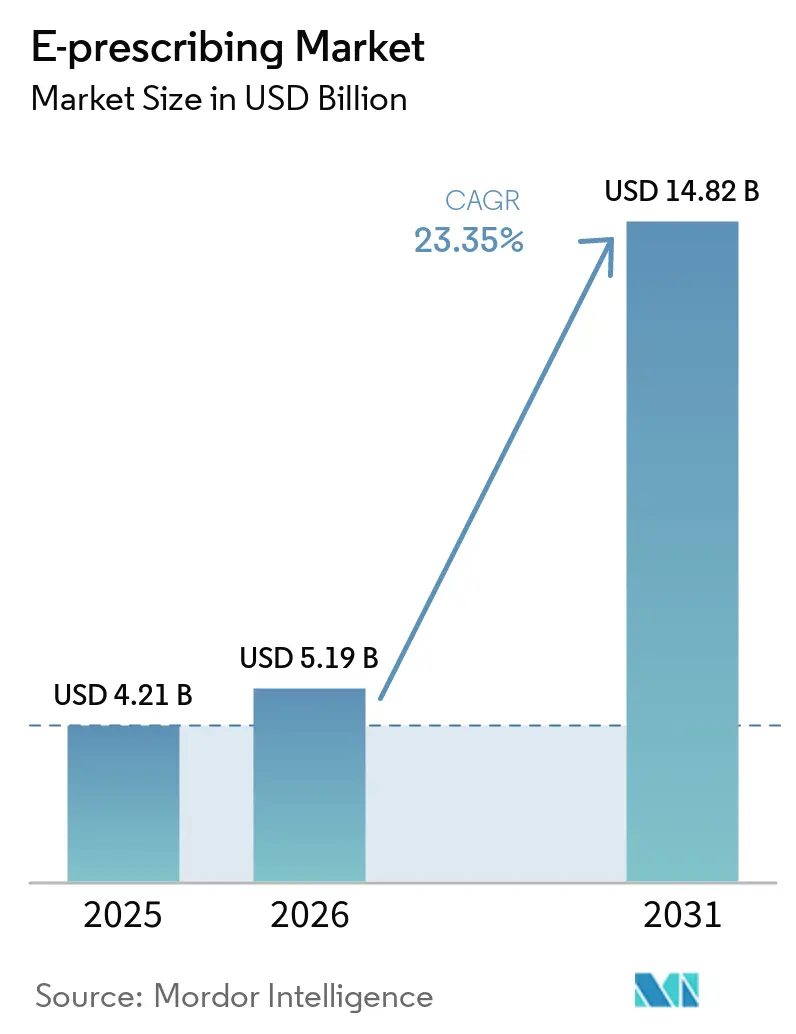
The E-prescribing Market size is projected to expand from USD 4.21 billion in 2025 and USD 5.19 billion in 2026 to USD 14.82 billion by 2031, registering a CAGR of 23.35% between 2026 and 2031.
Regulatory mandates, healthcare digitization, and the need to curb prescription fraud that costs the United States about USD 250 billion every year continue to accelerate demand. Momentum is further supported by the Drug Enforcement Administration’s decision to extend telemedicine prescribing flexibilities for Schedule II-V medications through December 2025[1]. Rapid adoption across hospitals, clinics, pharmacies, and growing telehealth networks keeps the electronic prescribing market on a robust growth path.
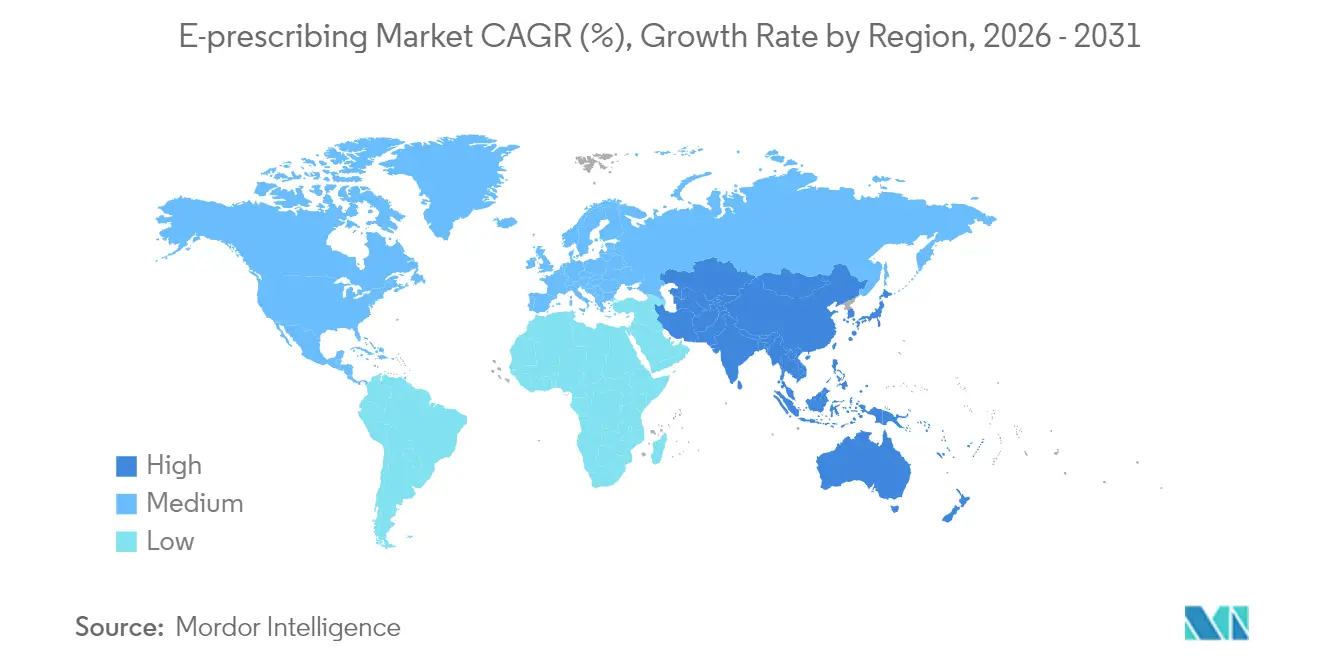
North America held 38.54% of the electronic prescribing market in 2024, lifted by the Centers for Medicare & Medicaid Services (CMS) rule obligating providers to write at least 70% of controlled substance prescriptions electronically, with enforcement that began in 2023[2]. Asia-Pacific is expanding at a 25.02% CAGR through 2031 due to Japan’s medical DX program that links My Number cards to electronic prescriptions and China’s three-medical linkage reforms that connect care, insurance, and pharmaceutical supply chains. Software remained dominant with 65.45% share in 2024, yet services are the fastest-growing component at 26.45% CAGR. Integrated EHR or hospital information systems account for 72.34% of usage, but mobile-first apps are rising at 26.56% CAGR. Cloud delivery leads with 54.34%, and controlled substances (EPCS) form the largest prescription class at 38.54%, while specialty drugs grow fastest at 25.67% CAGR.
Key Report Takeaways
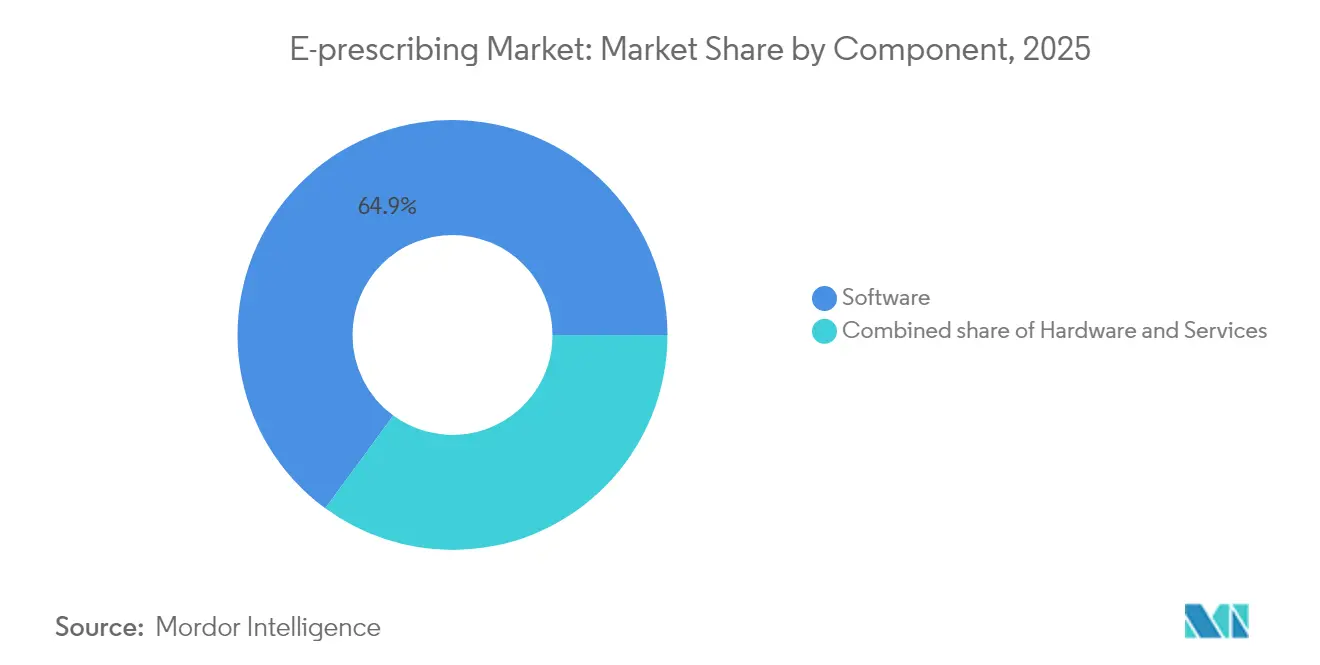
- By component, the software segment led with 64.92% of 2025 revenue; services are forecast to grow at 26.12% CAGR to 2031.
- By type of system, integrated EHR/HIS platforms commanded 71.62% electronic prescribing market share in 2025, while mobile-first applications are tracking a 26.05% CAGR.
- By delivery mode, cloud-based solutions captured 53.77% of the electronic prescribing market size in 2025; web-based platforms are advancing at 26.43% CAGR through 2031.
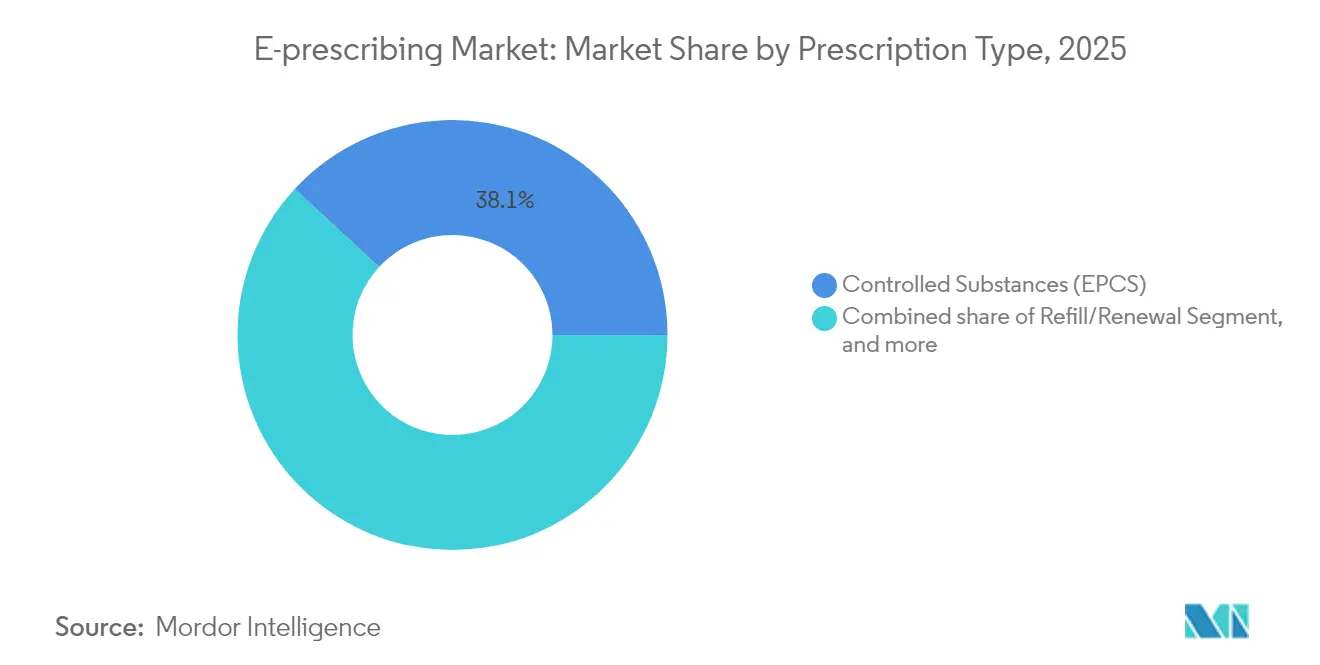
- By prescription type, controlled substances held 38.12% electronic prescribing market share in 2025; specialty drugs are projected to expand at 25.21% CAGR to 2031.
- By end user, hospitals accounted for 46.12% of the electronic prescribing market size in 2025; telehealth providers exhibit the quickest growth at 27.12% CAGR.
- By geography, North America led with 38.11% revenue share in 2025, whereas Asia-Pacific is set to rise at a 25.02% CAGR.
Note: Market size and forecast figures in this report are generated using Mordor Intelligence’s proprietary estimation framework, updated with the latest available data and insights as of 2026.
Market Trends and Insights
Drivers Impact Analysis of E-prescribing Market*
| Driver | % Impact on CAGR Forecast | Geographic Relevance | Impact Timeline |
|---|---|---|---|
| Government mandates for electronic prescription adoption | +6.2% | Global, strongest in North America & EU | Medium term (2-4 years) |
| Rising focus on medication safety and quality of care | +4.8% | Global, especially North America | Long term (≥ 4 years) |
| Need for healthcare cost reduction and operational efficiency | +3.9% | Global, emphasis on APAC & emerging markets | Long term (≥ 4 years) |
| Growing penetration of cloud-based healthcare IT infrastructure | +3.2% | Global, accelerated in APAC & Latin America | Medium term (2-4 years) |
| Expansion of telehealth and digital pharmacy ecosystems | +2.8% | Global, highest uptake in rural and underserved areas | Short term (≤ 2 years) |
| Emerging value-based care and medication price transparency | +2.1% | North America & EU, pilots in APAC | Long term (≥ 4 years) |
| Source: Mordor Intelligence | |||
Government Mandates for Electronic Prescription Adoption
Mandatory e-prescribing laws are realigning prescription workflows worldwide. The DEA’s forthcoming special registration framework introduces three tiers of telemedicine authorization, obliging clinicians to hold state-specific telemedicine credentials and use electronic prescriptions for Schedule II-V drugs. California’s rule that all prescriptions—controlled or not—be electronic since January 2022 shows how quickly mandates expand, with 35 states now enforcing EPCS legislation. CMS has already confirmed the transition to NCPDP SCRIPT Standard version 2023011 in January 2028, compelling systems to support real-time benefit tools and enhanced formulary data. A federal requirement to check state Prescription Drug Monitoring Programs is set for implementation within three years, further cementing e-prescribing as the only secure route for controlled substances. These cascading rules create a replacement cycle that drives the electronic prescribing market far beyond organic growth.
Rising Focus On Medication Safety And Quality Of Care
Patient-safety imperatives push healthcare systems to adopt advanced prescribing tools that reduce errors linked to 125,000 deaths a year in the United States. Surescripts’ Sig IQ translated 4.1 billion patient directions in 2024, converting free text to structured instructions that cut emergency department visits for adverse events. Epic Systems embedded more than 100 AI-based prescription management features that screen interactions and suggest optimal dosing. The DEA also requires biometric authentication with a false match rate below 0.001 for EPCS, escalating security needs that favor premium platforms. Medication therapy management systems now combine prescription histories with real-time adherence monitoring, addressing USD 250 billion in annual non-adherence costs. Real-time benefit tools further enhance safety by saving patients USD 37 per prescription through on-screen cost and formulary feedback.
Need For Healthcare Cost Reduction And Operational Efficiency
Provider groups look to e-prescribing to relieve budget pressure and streamline operations. Medicare Shared Savings Program ACOs reported USD 1.8 billion in 2022 savings, with optimized medication management a core driver. Electronic prescriptions paired with benefit verification now allow prescribers to choose cost-effective substitutes, cutting prior-authorization-related overhead estimated at USD 31 billion each year. E-prescribing also lowers pharmacy callback rates by 40%, improving staff productivity. Cloud-native deployments reduce on-premise hardware spending, and AI transcription tools such as eClinicalWorks’ Sunoh.ai save clinicians around two hours daily while improving billing precision. Centralized medication management platforms like Omnicell OmniSphere add enterprise level control across multi-site networks.
Growing Penetration Of Cloud-Based Healthcare IT Infrastructure
Widespread cloud adoption cuts implementation time and scales access to e-prescribing. Automatic software updates, continuous security patches, and subscription pricing remove capital barriers for smaller practices. HITRUST r2 certifications awarded to leading networks underscore the maturity of cloud security controls. Multi-tenant designs give clinics enterprise-grade functions without dedicated IT teams and enable seamless integration with telehealth platforms that became mission-critical during the pandemic. Combining cloud e-prescribing with AI analytics and natural language processing is creating extended digital health ecosystems that go beyond simple prescription routing.
Restraints Impact Analysis of E-prescribing Market*
| Restraints Impact Analysis | (~) % Impact on CAGR Forecast | Geographic Relevance | Impact Timeline |
|---|---|---|---|
| Data privacy and cybersecurity concerns | -3.4% | Global, heightened in EU under GDPR | Short term (≤ 2 years) |
| Lack of interoperability and data standardization | -2.8% | Global, more acute in fragmented systems | Medium term (2-4 years) |
| Provider workflow disruption and usability barriers | -2.3% | Global, impacts high-volume clinical settings | Short term (≤ 2 years) |
| Limited technical expertise in small and rural practices | -1.9% | Rural areas in North America, APAC & Africa | Medium term (2-4 years) |
| Source: Mordor Intelligence | |||
Data Privacy And Cybersecurity Concerns
Healthcare remains a prime ransomware target. The Change Healthcare attack interrupted prescription workflows for more than one-third of U.S. patients, forcing emergency paper-based processes. The DEA has also warned about EHR credential theft that allows criminals to generate massive volumes of fraudulent scripts. Legislative proposals like the Health Care Cybersecurity Improvement Act would tie Medicare payments to security readiness, adding cost burdens for small practices. Mandatory two-factor authentication, digital signatures, and detailed audit trails further raise operating complexity. Rural or small providers often lack funds and expertise to meet stringent requirements, slowing adoption and narrowing the electronic prescribing market in underserved regions.
Lack Of Interoperability And Data Standardization
Inconsistent data models hamper seamless exchange even where electronic prescribing is widespread. Only 23% of U.S. physicians say external health information is very easy to use, pointing to gaps that complicate medication reconciliation. Fragmented systems leave patients vulnerable when moving between providers that operate incompatible platforms. Upgrading to NCPDP SCRIPT 2023011 demands extensive testing between every network participant and can disrupt workflows. Semantic interoperability issues remain because different EHRs label medication fields in unique ways, requiring manual mapping that risks errors[3]. Absent uniform APIs, health systems must maintain bespoke interfaces for each vendor, inflating maintenance costs and discouraging platform switching.
*Our forecasts treat driver/restraint impacts as directional, not additive. The impact forecasts reflect baseline growth, mix effects, and variable interactions.
E-prescribing Market Segment Analysis
By Component:
Services Drive Integration ComplexityIn 2025 software accounted for 64.92% of revenue, reflecting core licensing demand across hospitals and clinics. Services, however, projected at a 26.12% CAGR, underline how organizations now value onboarding support, regulatory guidance, and continuous optimization. Surescripts’ 4.1 billion Sig IQ instructions in 2024 illustrate a shift from basic data transport to value-added medication management.
The services boom reinforces that technology alone does not solve prescribing challenges. Implementation now routinely covers classroom training, change-management workshops, and help-desk outsourcing. This service overlay creates sticky, subscription-like income for vendors and sustains the electronic prescribing market even in mature geographies. Recurrent upgrades to meet DEA biometrics or upcoming SCRIPT standards secure the segment’s long-term growth trajectory.

By Type of System:
Mobile Innovation Challenges EHR DominanceIntegrated EHR or HIS solutions held 71.62% of the electronic prescribing market in 2025, capitalizing on their embedded role in point-of-care workflow. Mobile-first apps are catching up with a 26.05% CAGR thanks to secure tablets and smartphones that enable immediate order entry during rounds or home visits. Stand-alone systems stay relevant in niche environments where full EHR rollouts remain impractical.
Epic’s wave of AI-enabled prescribing tools demonstrates how EHR giants defend share, while smaller mobile entrants compete on usability and low upfront cost. Mobile solutions also serve outreach programs, pop-up clinics, and disaster zones. Yet integrated suites still provide deeper access to lab values, problem lists, and decision support—capabilities crucial for complex polypharmacy management.
By Delivery Mode:
Web-Based Solutions Gain MomentumCloud platforms already represent 53.77% revenue in 2025, but browser-based deployments are growing fastest at 26.43% CAGR as providers prefer log-in-and-go convenience. On-premise installations linger where policy or security demands local control, while API Platform-as-a-Service models appeal to health tech firms that embed prescribing into broader applications.
Cloud migration simplifies version control and accelerates security patching, benefits recognized by systems that process millions of scripts each day. Web access also eases multi-site expansion for retail pharmacy chains and telehealth networks. Browser-based tools keep pace with stringent authentication rules and eliminate local software conflicts, ensuring the electronic prescribing market remains accessible for organizations large and small.
By Prescription Type:
Specialty Drugs Drive Premium GrowthControlled substances represented 38.12% electronic prescribing market share in 2025, reflecting the regulatory push to digitize opioids and stimulants. Specialty medications, though smaller in volume, generate the quickest value growth at 25.21% CAGR because biologics and gene therapies demand rigorous tracking. NewRx scripts remain foundation volume, while automated refill modules trim staff workload.
Surescripts recorded 310.5 million electronic controlled-substance scripts in 2024, with 83.9% of active prescribers EPCS-enabled and 96.3% of pharmacies ready to dispense digitally. Specialty therapy often triggers prior authorizations and financial-assistance requests, so advanced platforms that integrate payer workflows command premium fees, further enlarging the electronic prescribing market size for high-complexity drugs.
By End User:
Telehealth Providers Accelerate AdoptionHospitals contributed 46.12% of 2025 revenue, reflecting enterprise EHR penetration and high script volumes. Telehealth providers, however, record a 27.12% CAGR as remote visits become a standard care pathway. Clinics and pharmacy or mail-order channels adopt e-prescribing steadily, driven by compliance and efficiency targets.
The DEA’s extended flexibilities let virtual clinicians continue to e-prescribe Schedule II-V medications, removing geographic barriers that once limited remote addiction and mental-health therapy. Hospital groups benefit from economies of scale, yet telehealth networks gain ground by offering convenient home delivery and medication coaching. The resulting multichannel landscape broadens reach and diversifies the electronic prescribing industry revenue base.
Geography Analysis
North America E-prescribing Market
North America dominated the electronic prescribing market with 38.11% share in 2025, sustained by mature network infrastructure and strong federal mandates. Surescripts routed 2.5 billion prescriptions on its U.S. platform that year, highlighting entrenched adoption. Persistent cybersecurity events such as the Change Healthcare breach and ongoing data-sharing challenges underscore the region’s future investment needs, yet incentives embedded in Medicare and commercial insurance maintain growth momentum.
APAC E-prescribing Market
Asia-Pacific posted the fastest trajectory at 25.02% CAGR through 2031. Japan is rolling out a nationwide database that links every citizen’s My Number ID to prescription histories, while China builds integrated treatment-insurance-pharmacy networks under its three-medical linkage policy. Governments in India, South Korea, and Australia are equally prioritizing national drug monitoring systems, creating leapfrog opportunities that let providers deploy cloud and mobile solutions without legacy constraints. A projected USD 138 billion healthcare outlay in China by 2027 offers substantial room for electronic prescribing market expansion.
EMEA and South America E-prescribing Market
Europe exhibits steady progress driven by Germany’s e-Rezept program and the NHS mobile-app prescription service that now handles 3.1 million repeat requests monthly. Diverse regulatory environments across 27 EU states slow harmonization, but strict data-protection frameworks bolster consumer trust. South America along with the Middle East & Africa remain nascent but attractive; public-sector digitization drives early projects in Brazil, Saudi Arabia, and the United Arab Emirates. The global outlook therefore pairs mature usage in North America and Europe with rapid scale-up in Asia-Pacific and selective pilot adoption across emerging regions, sustaining long-term growth for the electronic prescribing market.
Regulatory Landscape
Regulation continues to formalize e-prescribing as a safety and anti-fraud control, especially for controlled substances and cross-border exchange. In the United States, CMS enforcement for electronic prescribing of controlled substances (EPCS) accelerated adoption from 2023, while the DEA extended telemedicine prescribing flexibilities for Schedule II-V medications through December 2025. ONC finalized the HTI-4 rule in 2025, updating Health IT Module certification requirements (45 CFR 170.315(b)(3)) to support NCPDP SCRIPT version 2023011 by December 31, 2027, and ONC opened the 2026 SVAP pathway for voluntary adoption of newer standards beginning August 29, 2026, with associated test tools scheduled to align by December 31, 2026.
In Europe, policy is moving toward interoperable, cross-border e-prescriptions. Regulation (EU) 2025/327 (European Health Data Space) requires Member States to connect to MyHealth@EU for e-prescription exchange, with interoperability obligations effective March 26, 2029, which reinforces the need for standardized identifiers and cross-border workflows. Global standardization is also advancing, including ISO 17523:2025 (published July 2025), which defines generic principles and essential data elements for electronic prescriptions and supports vendor harmonization across regions implementing national e-prescribing and digital identity programs.
Competitive Landscape
The electronic prescribing market is moderately concentrated. Surescripts anchors the ecosystem, connecting over 2.14 million providers and enabling 24 billion health-information exchanges in 2023. Epic Systems expanded its acute-care EHR footprint to 42.3% of U.S. hospitals after onboarding 176 multispecialty facilities in 2024, deepening its integrated prescribing base. Oracle Health’s share dropped to 22.9% after it lost 74 hospital clients post-acquisition, illustrating competitive pressure.
Technology differentiation centers on AI decision support, seamless network interoperability, and compliance tooling. Epic introduced over 100 AI features that flag interactions and suggest personalized dosing. Oracle Health is rolling out voice commands and facial ID to streamline clinician logins. New entrants target specialized niches: Surescripts extended its network to veterinary prescriptions via DAW Systems and digital pharmacies pursue direct-to-consumer refills. Platforms with advanced biometrics and full DEA compliance attract hospitals managing high-risk controlled substances, while lightweight mobile apps appeal to telehealth startups. Vendor roadmaps increasingly integrate value-based analytics and outcome tracking to align with payer incentives, pushing the electronic prescribing industry toward data-rich, AI-assisted ecosystems.
Strategic partnerships and acquisitions illustrate market dynamics. Omnicell launched its cloud-native OmniSphere to link robotics and smart cabinets, securing HITRUST certification. McKesson’s USD 850 million move for PRISM Vision Holdings added ophthalmology reach and augmented data-analytics capacity. Francisco Partners bought AdvancedMD for USD 1.125 billion, betting on integrated ambulatory software that embeds prescribing tools. These deals underscore how scale, data depth, and workflow breadth define competitiveness in the electronic prescribing market.
E-prescribing Industry Leaders
-
Allscripts Healthcare Solutions (Veradigm)
-
Surescripts
-
Epic Systems Corporation
-
Oracle (Cerner)
-
DrFirst
- *Disclaimer: Major Players sorted in no particular order
E-prescribing Market Companies Covered in this Report
- Veradigm
- Surescripts
- Epic Systems
- Oracle
- DrFirst
- eClinicalWorks
- NextGen Healthcare
- Meditech
- Greenway Health
- Practice Fusion
- McKesson (CoverMyMeds)
- Omnicell
- RelayHealth (Change Healthcare)
- RxNT
- DoseSpot
- CompuGroup Medical (eMDs)
- WellSky
- Altera Digital Health
Market Opportunities and Future Outlook
Regulatory standard upgrades and mandated transactions are creating a modernization cycle for e-prescribing platforms, particularly around benefit, formulary, and prior-authorization capabilities embedded at the point of prescribing. In the United States, HTI-4 aligns certification with newer e-prescribing and Real-Time Prescription Benefit (RTPB) standards, and CMS has published Part D timelines that move plans and prescriber tools toward exclusive use of NCPDP Formulary and Benefit (F&B) version 60 and RTPB version 13 by January 2027, followed by NCPDP SCRIPT version 2023011 by January 2028. That sequencing requires coordinated upgrades across EHRs, networks, and pharmacies, and it lifts demand for testing, integration services, and ongoing compliance support alongside core software.
Workflow automation and patient-facing affordability tools are also extending use cases beyond basic NewRx transmission. Surescripts reported 1 billion uses of RTPB tools in 2025 and scaled network volume to 2.64 billion prescriptions, and in May 2026 it expanded prior authorization automation across 42 health systems and 68,000 prescribers, reporting an 18-second median approval time. Separately, the January 2026 Surescripts and GoodRx partnership to surface discounted cash prices within the Script Corner experience highlights a commercial path for e-prescribing vendors to add price transparency and access support directly into the prescribing workflow, tying adoption to measurable reductions in abandonment and administrative burden rather than message delivery alone.
Recent Industry Developments in E-prescribing Market
- May 2026: Surescripts expanded its prior authorization automation program to reach 68,000 prescribers across 42 health systems, targeting broader touchless processing for medication access. The announcement highlighted an 18-second median approval time for automated prior authorizations, strengthening the link between e-prescribing networks and payer workflow automation. This shifts competitive differentiation toward standards-based prior authorization, not just electronic transmission of prescriptions.
- February 2026: Epic rolled out Epic AI Charting, a built-in capability that drafts clinical notes and queues orders using conversation audio, with Group Health Cooperative of South Central Wisconsin named as the first adopter. By embedding generative AI into documentation and ordering, Epic reinforced the trend of pairing e-prescribing with upstream workflow automation inside the EHR. The launch raises the bar for integrated prescribing experiences, particularly in high-volume hospital and clinic settings.
- January 2026: Surescripts and GoodRx announced a partnership to integrate discounted cash prices into the Script Corner patient experience. The collaboration extends e-prescribing beyond clinician-to-pharmacy routing by adding point-of-care affordability cues that can influence medication pickup and adherence. It also strengthens the role of network intermediaries in delivering price transparency within prescribing workflows.
E-prescribing Market Report Scope and Research Methodology
Market Definition and Coverage
For this methodology, the e-prescribing market covers software and related services that let a prescriber create, review, and send prescriptions electronically to a pharmacy through secure health information networks, including compliance features and workflow support.
Scope exclusions: Dedicated hardware and adjacent pharmacy automation equipment are excluded (for example, signature pads, card readers, and dispensing robotics). We also do not count simple fax-to-digital workflows as full e-prescribing.
Segments Covered in This Report
- By Component
- Hardware
- Software
- Services
- By Type of System
- Stand-alone Systems
- Integrated EHR/HIS Systems
- Mobile-first Apps
- By Delivery Mode
- Cloud-based
- Web-based
- On-premise
- API Platform-as-a-Service
- By Prescription Type
- NewRx
- Refill / Renewal
- Controlled Substances (EPCS)
- Specialty Drugs
- By End User
- Hospitals
- Clinics
- Pharmacies & Mail-order
- Telehealth Providers
- Geography
- North America
- United States
- Canada
- Mexico
- Europe
- Germany
- United Kingdom
- France
- Italy
- Spain
- Rest of Europe
- Asia-Pacific
- China
- Japan
- India
- Australia
- South Korea
- Rest of Asia-Pacific
- Middle East & Africa
- GCC
- South Africa
- Rest of Middle East & Africa
- South America
- Brazil
- Argentina
- Rest of South America
- North America
Data Sources, Market Sizing, and Validation
Desk Research
Desk research was used to build the base structure of the market model and to set guardrails for geography, regulation, and adoption patterns. We reviewed public health IT and digital health references from national health agencies, regulator publications on e-prescribing for controlled substances, and reimbursement or claims guidance where it was publicly available.
To quantify and cross-check inputs, we relied on sources such as the World Health Organization, OECD health statistics, World Bank population and health spend indicators, peer-reviewed journals on medication safety and prescribing errors, and public websites of health ministries and e-health programs. Alongside this, we used company filings, investor presentations, association publications, and reputable press to confirm product positioning and rollout timelines, then supplemented gaps with paid subscription sources for company financials and news intelligence, plus a patent database to identify innovation direction. The desk sources listed here are illustrative only, and other public references were also used during collection, validation, and clarification.
Primary Interviews and Surveys
Primary work focused on validating what is actually deployed as e-prescribing versus nearby workflows, and on understanding pricing and adoption in real buying cycles. We spoke with a mix of solution providers, healthcare IT implementers, prescribers, pharmacy-side stakeholders, and compliance or operations leaders across APAC, EMEA, and the Americas to confirm adoption drivers and to pressure-test assumptions used in the model.
Distribution of primary research fieldwork respondents
| Company type | Respondent position | Region |
|---|---|---|
| Top tier: 29% | CXOs: 12% | APAC: 46% |
| Mid tier: 53% | Functional/Unit leaders: 40% | EMEA: 34% |
| Smaller Players: 18% | Managers: 48% | Americas: 20% |
Market-Sizing & Forecasting
Sizing starts from a top-down build where adoption is reconstructed by country using healthcare delivery indicators, the prescriber and facility base, and the maturity of national e-health rules, then translated into active e-prescribing usage. After that demand pool is formed, results are corroborated with selective bottom-up checks using sampled vendor revenue signals, channel feedback on typical contract values, and volume times average pricing ranges, before totals are adjusted.
Key model inputs included e-prescribing mandate coverage, electronic health record penetration, share of controlled substances routed through compliant workflows, pharmacy connectivity levels, and typical subscription or transaction pricing for cloud versus on-premise deployments. Where some countries had limited public visibility, gap handling used proxy indicators such as health IT spend and provider density, then normalized with interview feedback so outliers did not pull the global total.
Forecasting uses scenario analysis, since policy-driven adoption and compliance timelines can shift faster than a purely trend-based curve. Scenarios were anchored on expert views about regulatory enforcement pace, cloud migration speed, and the rate at which prescribers switch from legacy methods to connected electronic routing.
Data Validation & Update Cycle
Validation is done through multiple checks so the final number remains consistent with real-world adoption signals. Analysts compare outputs against independent metrics such as digital health program milestones, EHR usage trends, and observed rollout timing for controlled-substance enablement, then investigate large variances before sign-off.
A second review step is used to re-check assumptions, currency conversions, and year alignment across regions. Respondents are re-contacted when a key input moves outside an expected range. Reports are refreshed annually, and interim updates are made when material events occur, followed by a final pre-delivery pass so clients receive the latest view.
Mordor Intelligence's Global E Prescribing Market Sizing Compared With Other Published Estimates
Published e-prescribing market estimates often differ because each publisher draws the scope line differently and applies its own adoption and pricing logic. Variations usually come from what is counted as true e-prescribing, how services are treated, and which year is used as the base for the forecast.
The largest gap is whether fax-to-digital and adjacent hardware are treated as part of the market. Mordor Intelligence counts only software and related services tied to secure electronic transmission, excluding dedicated devices like signature pads and card readers.
Benchmark comparison
| Source | Market Size | Gaps in Research Methodology |
|---|---|---|
| Mordor Intelligence | USD 5.19 B (2026) | |
| Industry Research Publisher A | USD 4.51 B (2025) | Uses a different base year and appears to apply a broader component view that can blend hardware and service layers, which can shift the counted revenue pool versus a software-first definition. |
| Healthcare Insights Portal B | USD 4.71 B (2024) | Anchors sizing on an earlier base year with limited stated inclusion rules, and may mix adoption narratives with aggressive ramp assumptions, which can move totals when compliance-driven use is not separated from general digital prescribing activity. |
Overall, the spread is explained by year alignment and what is included in the counted solution stack, followed by how fast adoption and pricing are assumed to progress. Using a tighter definition tied to secure transmission and validating assumptions with real deployment and compliance signals helps keep the estimate traceable and repeatable.
Key Questions Answered in the Report
What is the size of the electronic prescribing market and how fast is it growing?
The market reached USD 5.19 billion in 2026 and is forecast to climb to USD 14.82 billion by 2031, reflecting a 23.35% CAGR during the forecast period (2026-2031)
Which regions are leading and which are expanding fastest?
North America held 38.11% of 2025 revenue, while Asia-Pacific is projected to advance at a 25.02% CAGR through 2031, driven by national digital-health initiatives
What regulatory changes are driving wider adoption?
Federal and state mandates such as the U.S. DEA’s extended telemedicine flexibilities and CMS rules requiring electronic transmission of most controlled-substance scripts are accelerating deployment
Why is electronic prescribing important for controlled substances?
Controlled substances accounted for 38.12% of 2025 revenue, and electronic workflows support biometric authentication, audit trails, and Prescription Drug Monitoring Program checks that curb diversion and fraud
What cybersecurity risks affect electronic prescribing systems?
Ransomware incidents such as the Change Healthcare attack, along with credential-theft schemes targeting DEA numbers, highlight the need for two-factor authentication, encryption, and continuous threat monitoring
Who are the main vendors and how consolidated is the market?
Surescripts, Epic Systems, Oracle Health, Omnicell, and McKesson lead the space; the top five players collectively control just over 60% of transactions, indicating moderate concentration.