Dog Food Market Size and Share
Market Overview
| Study Period | 2018 - 2031 |
|---|---|
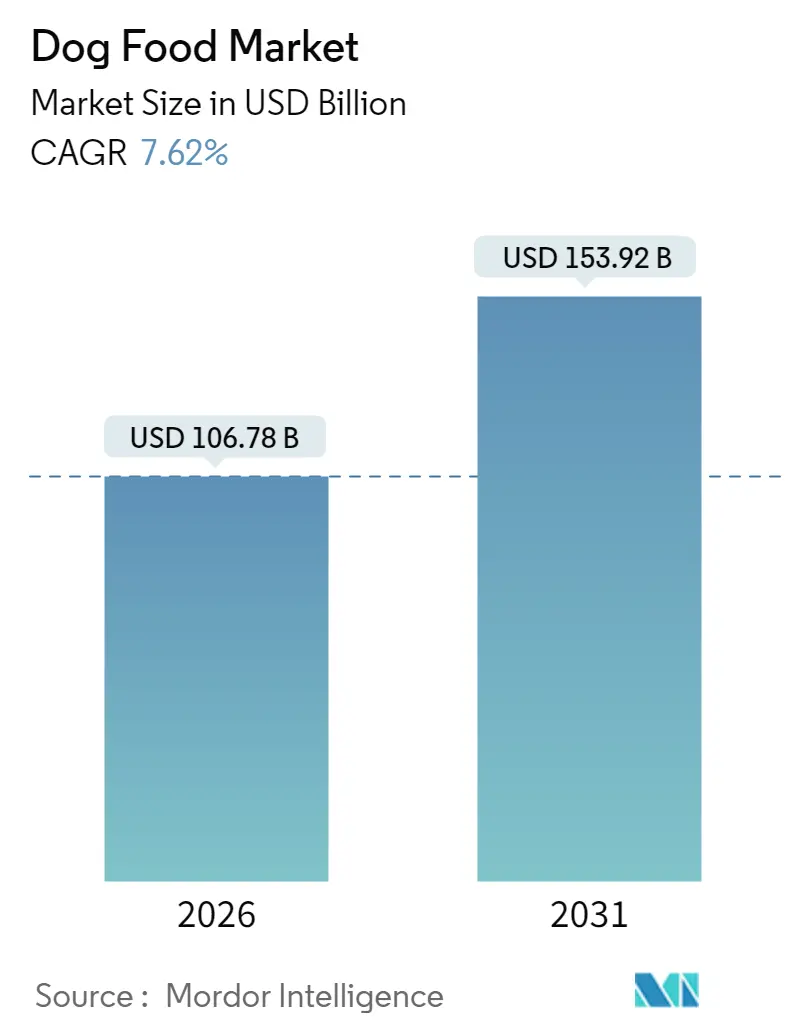
| Market Size (2026) | USD 106.78 Billion |
| Market Size (2031) | USD 153.92 Billion |
| Growth Rate (2026 - 2031) | 7.62% CAGR |
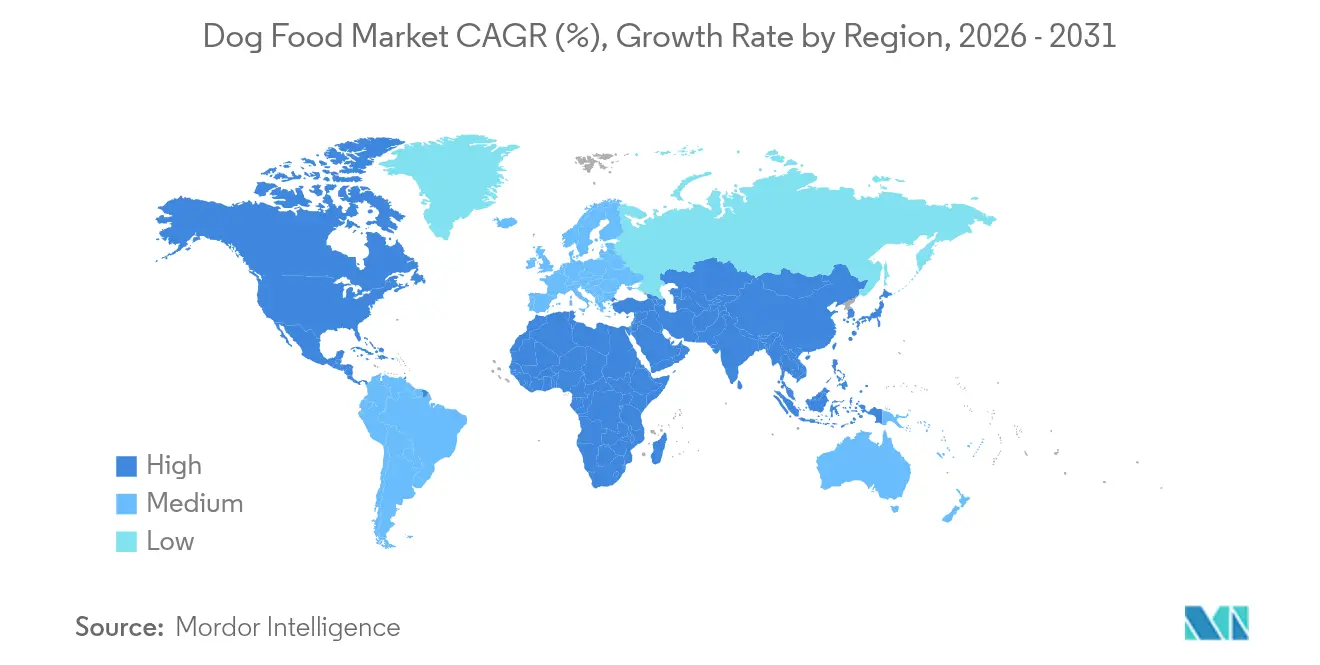
| Fastest Growing Market | Africa |
| Largest Market | North America |
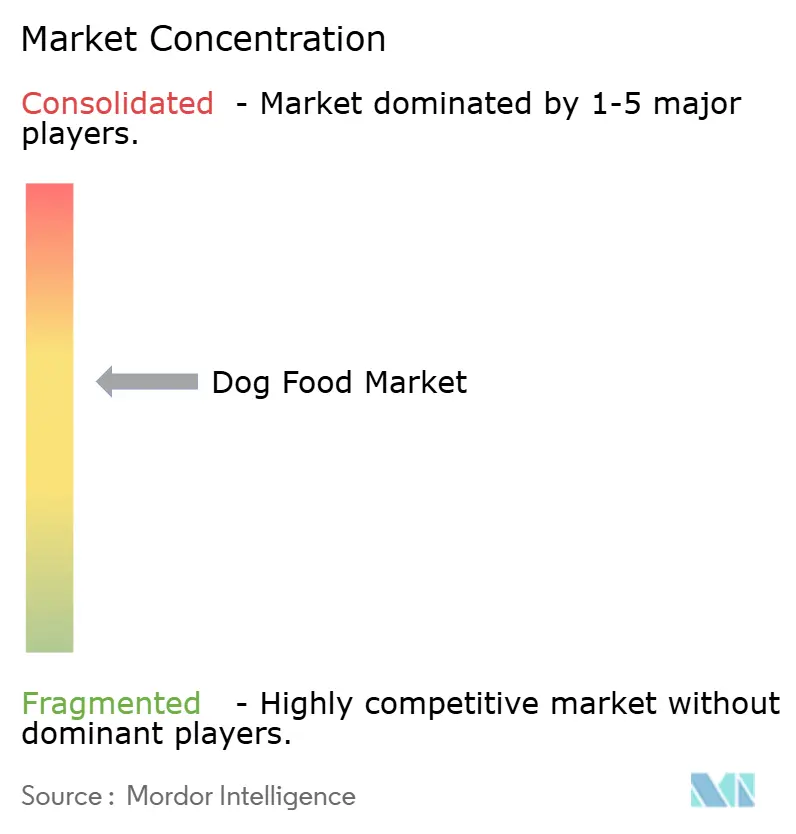
| Market Concentration | Medium |
Major Players *Disclaimer: Major Players sorted in no particular order Image © Mordor Intelligence. Reuse requires attribution under CC BY 4.0. | |
Dog Food Market Analysis by Mordor Intelligence
The Dog Food Market was valued at USD 99.22 billion in 2025 and estimated to grow from USD 106.78 billion in 2026 to reach USD 153.92 billion by 2031, at a CAGR of 7.62% during the forecast period (2026-2031). Elevated pet humanization, the rapid migration toward premium and functional recipes, and the rise of e-commerce subscription services underpin the sector’s robust growth momentum. Manufacturers continue to prioritize human-grade meat, novel proteins, and clean-label ingredients to secure price premiums while meeting transparency demands. Digital commerce reshapes route-to-market economics by lowering customer acquisition costs and enabling data-driven product personalization. Meanwhile, supply chain investments in upcycling and alternative proteins support both sustainability positioning and margin insulation against meat price swings. Competitive intensity remains high as global food conglomerates and venture-backed startups deploy acquisitions, direct-to-consumer models, and AI-enabled nutrition platforms to protect and expand their dog food market footprints.
Key Report Takeaways
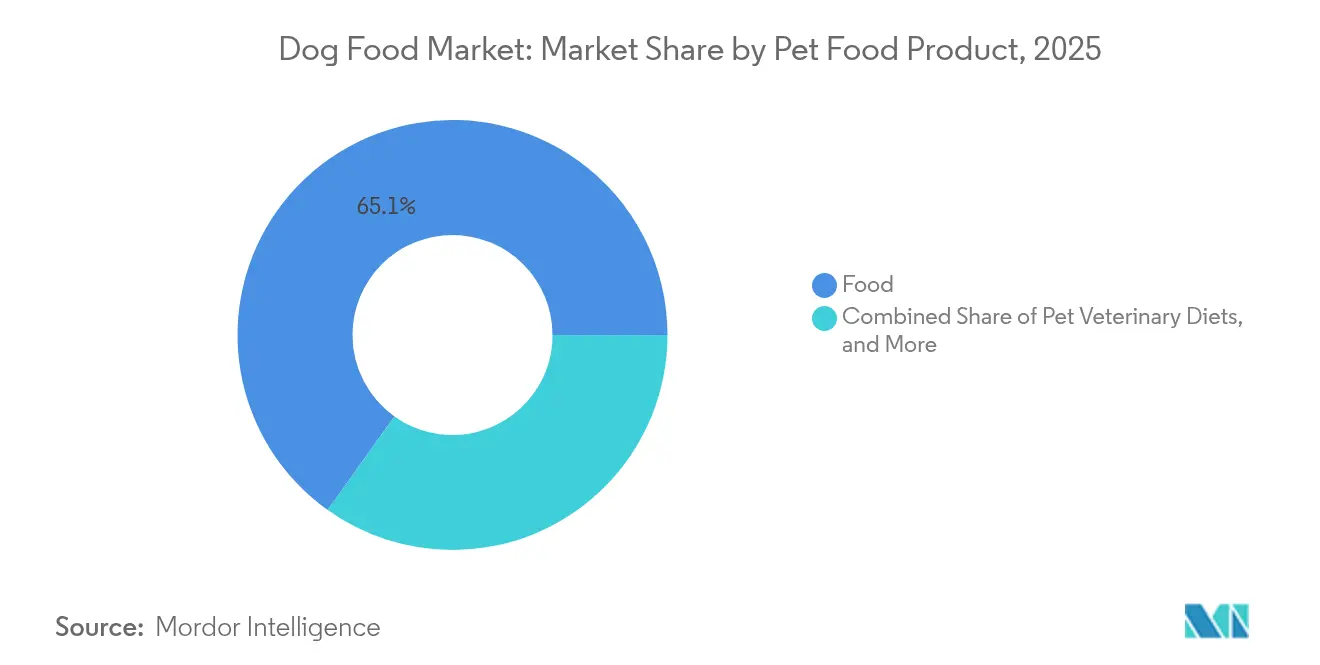
- By pet food product, food held 65.14% of the dog food market share in 2025, while pet veterinary diets is advancing at an 8.41% CAGR through 2031.
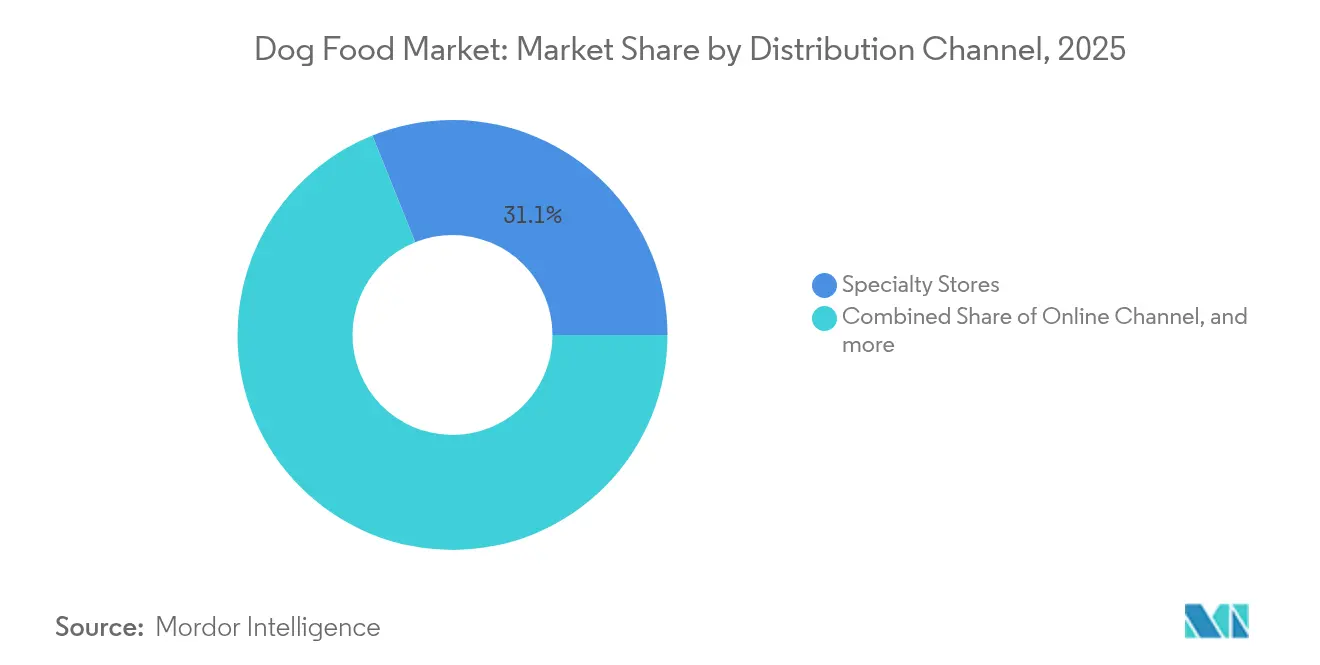
- By distribution channel, specialty stores accounted for a 31.08% share of the dog food market size in 2025, whereas online channels are projected to expand at a 9.56% CAGR between 2026 and 2031.
- By geography, North America led with 45.02% revenue share in 2025; Africa is forecast to record the fastest regional CAGR at 9.18% to 2031.
- The Dog food market exhibits a moderate competitive landscape with a mix of global multinational corporations and regional players. Global conglomerates like Mars, Incorporated, Nestlé, The J. M. Smucker Company, Colgate-Palmolive Company (Hill's Pet Nutrition Inc.), and General Mills maintain significant market presence with a share of 38.12% in 2025.
Note: Market size and forecast figures in this report are generated using Mordor Intelligence’s proprietary estimation framework, updated with the latest available data and insights as of January 2026.
Global Dog Food Market Trends and Insights
Drivers Impact Analysis
| Driver | (~) % Impact on CAGR Forecast | Geographic Relevance | Impact Timeline |
|---|---|---|---|
| Premiumization of dog diets | +2.1% | Global, strongest in North America and Europe | Medium term (2-4 years) |
| Human-grade ingredient adoption | +1.8% | North America, Europe, and urban Asia-Pacific | Medium term (2-4 years) |
| E-commerce private-label expansion | +1.4% | Global, led by North America and China | Short term (≤ 2 years) |
| Functional and fortified recipes | +1.2% | Global, premium segments | Long term (≥ 4 years) |
| Growth of subscription delivery models | +0.9% | North America, Europe, and urban Asia-Pacific | Short term (≤ 2 years) |
| Upcycling of food waste into kibble | +0.3% | Europe, North America, and sustainability-focused markets | Long term (≥ 4 years) |
| Source: Mordor Intelligence | |||
Premiumization of Dog Diets
Premium positioning constitutes the largest growth catalyst within the dog food market. Manufacturers leverage organic and ethically sourced proteins, superfood inclusions such as chia and kale, and recyclable packaging to justify double-digit price premiums. Retailers reinforce the trend by dedicating incremental shelf space to super-premium assortments and by curating in-store education programs that highlight nutrient density and provenance. Premiumization also filters into emerging markets where upper-income households replicate Western consumption patterns.
Adoption of Human-Grade Ingredients
Human-grade sourcing bolsters consumer confidence and underpins the shift from commodity kibble toward recognizable whole-food inclusions. Brands now publish supplier maps, run third-party audits, and obtain USDA or equivalent certification to validate claims. Blue Buffalo grew its United States market share by 7.5% in 2021 on the back of natural ingredient messaging[1]Source: Agriculture and Agri-Food Canada, “Sector Trend Analysis – Pet Food in Japan,” AGRICULTURE.CANADA . Post-pandemic health awareness persists, with 60% of supplement buyers reporting closer scrutiny of ingredient panels since 2020. The dog food market rewards transparency with loyalty, enabling premium price retention even during commodity inflation.
Expansion of E-commerce Private-Label Brands
Digital commerce lowers barriers to entry and lets retailers monetize proprietary data by launching in-house dog food lines. Chewy’s Autoship customers generated USD 2.08 billion in net sales in Q1 2023, equal to 75% of the company's revenue. Amazon’s Subscribe and Save program mirrors that scale. Margins benefit because private-label brands avoid trade promotion fees typical of brick-and-mortar. In China, white-label and OEM offerings account for about 48% of value share, illustrating runway for similar models elsewhere. Robust fulfillment networks support next-day delivery, reducing stock-out risk for perishables.
Functional and Fortified Recipes
Functional nutrition transforms dog food from mere sustenance to proactive healthcare. Prescription and over-the-counter formulas now include glucosamine for joint health, DHA for cognitive support, and heat-stable probiotics for gut balance. Hill’s Prescription Diet w/d multi-benefit stew integrates L-carnitine and proprietary fiber blends to address obesity and glycemic control[2]Source: Vetopia, “Hill’s Prescription Diet Canine w/d Multi-Benefit Vegetable and Chicken Stew 5.5 oz,” VETOPIA.COM.HK. Veterinary endorsements legitimize health claims and foster long-term switching. Aging canine populations in developed markets amplify demand for joint, renal, and metabolic support formulations.
Restraints Impact Analysis
| Restraint | (~) % Impact on CAGR Forecast | Geographic Relevance | Impact Timeline |
|---|---|---|---|
| Volatility of meat-based input prices | -1.8% | Global, particularly affecting North America and Europe | Short term (≤ 2 years) |
| Regulatory scrutiny on sustainability claims | -0.9% | Europe, North America, developed markets | Medium term (2-4 years) |
| Rising prevalence of canine allergies to grains | -0.6% | North America, Europe, urban markets | Medium term (2-4 years) |
| Competition from fresh home-cooked alternatives | -0.4% | Urban markets globally, strongest in North America | Long term (≥ 4 years) |
| Source: Mordor Intelligence | |||
Volatility of Meat-Based Input Prices
Protein sourcing remains the largest cost line for most manufacturers. Drought, animal disease outbreaks, and geopolitical trade disruptions can lift poultry and red meat prices by double digits within quarters. Companies hedge exposure using futures contracts and diversify into insect or plant proteins, yet these tactics cannot eliminate margin compression when spot prices spike. The constraint weighs most heavily on premium meat-forward brands that lack formulation flexibility.
Regulatory Scrutiny on Sustainability Claims
Authorities in the United States, the European Union, and Australia are intensifying oversight of “carbon neutral” and “zero waste” marketing language. Fines and public notices dent brand equity when substantiation falls short. Compliance costs climb as firms commission life-cycle assessments, install traceability software, and engage third-party certification bodies. Smaller entrants face disproportionate burdens, slowing product launches and innovation pace.
Segment Analysis
By Pet Food Product: Veterinary Diets Drive Therapeutic Innovation
The food category dominated the dog food market, accounting for a 65.14% revenue share in 2025, thanks to its wide household penetration and multipack convenience. Dry kibble alone captured about three-quarters of the category, supported by its shelf life and cost efficiency. Pet Veterinary Diets, although only a mid-single-digit slice of the overall dog food market, is projected to post an 8.41% CAGR outlook to 2031, as veterinarians increasingly advocate for nutrition therapy in addressing obesity, diabetes, and renal conditions. Functional treats and toppers extend these clinical solutions into between-meal occasions, reinforcing owner compliance.
Pet veterinary diets achieve price points two to three times higher than mainstream kibble because of research and clinical trial investment. Formulations incorporate enzymatically hydrolyzed proteins, precise omega-3 to omega-6 ratios, and soluble fiber blends that have been validated for their glycemic modulation effects. Hill’s, Purina Pro Plan Veterinary, and Royal Canin lead this segment, leveraging global research centers and robust distribution through veterinary clinics. Smaller specialty brands partner with contract researchers to validate claims and secure distribution, often utilizing prescription-only models that secure professional endorsement. Growth tailwinds include rising canine lifespan, pet insurance coverage expansion, and increasing diagnosis rates due to affordable diagnostic imaging.
Note: Segment shares of all individual segments available upon report purchase
By Distribution Channel: Online Growth Reshapes Retail Landscape
Specialty stores maintained a 31.08% market share of the dog food market in 2025, underpinned by experiential services, curated assortments, and pet health expertise. In-store events such as nutrition consultations and grooming services elevate foot traffic and basket size. Online Channels recorded the fastest expansion, with a forecasted 9.56% CAGR through 2031, transforming fulfillment economics and marketing strategies. Subscription platforms secure recurring volume and enhance data capture, informing targeted product innovation.
E-commerce success rests on last-mile delivery infrastructure, AI-driven recommendation engines, and flexible fulfillment models like buy-online-pick-up-in-store. Social commerce accelerates discovery, with TikTok Shop and Instagram galvanizing impulse purchases via short-form video. Omnichannel leaders synchronize inventory across physical and digital storefronts to minimize stock-outs and harmonize pricing. Supermarkets and Hypermarkets remain crucial for mass-market penetration, especially in developing regions where online penetration lags. Convenience Stores cater to immediate replenishment in urban cores, although their share remains modest due to limited shelf space and lower price competitiveness.
Note: Segment shares of all individual segments available upon report purchase
Geography Analysis
North America commanded 45.02% market share of the dog food market in 2025, owing to high dog ownership, premium purchasing behavior, and an established regulatory scaffold that bolsters consumer confidence. The United States remains the single largest national market, with high sales and robust per-capita spending supported by rising insurance adoption and premiumization. Continuous innovation in subscription models and functional snacks further fuels regional value growth. South America exhibits moderate growth anchored by Brazil and Argentina. Economic volatility tempers high-end trade-up, but domestic producers capitalize on favorable soybean and corn supply for cost-competitive formulations. Government programs encouraging local sourcing under sustainability agendas also influence procurement strategies.
Africa represents the fastest regional upside with a projected 9.18% CAGR to 2031. Rising disposable income, urban migration, and expanding modern retail fuel commercial dog food adoption, particularly in South Africa, Nigeria, and Kenya. The region attracts investment for local production facilities to circumvent import tariffs and currency volatility. Marketing focuses on education campaigns highlighting nutritional adequacy compared with table scraps. Although infrastructure gaps persist, smartphone penetration supports digital commerce leapfrogging, shortening the path to premium formats.
Europe maintains steady mid-single-digit expansion anchored by stringent labeling laws, sustainability leadership, and a consolidated private-label manufacturing base. German and French consumers display strong adoption of organic and insect-protein products, aligning with broader environmental priorities. Although pet ownership penetration still trails Western levels, rapid urbanization and one-child household structures drive incremental dog adoptions and premium spend.
Japan’s aging dog population led to flat volumes, yet value gains continue as owners trade up to therapeutic and fresh formats. Emerging markets like Indonesia and India record double-digit volume growth but from low per-capita bases, presenting fertile grounds for mainstream and value brands.
Competitive Landscape
The Dog food market exhibits a moderate competitive landscape with a mix of global multinational corporations and regional players. Global conglomerates like Mars, Incorporated, Nestlé, The J. M. Smucker Company, Colgate-Palmolive Company (Hill's Pet Nutrition Inc.), and General Mills maintain significant market presence with a share of 38.6% in 2024. They leverage scale advantages in procurement, R&D, and marketing. General Mills sharpened its pet focus by purchasing Whitebridge Pet Brands for USD 1.45 billion in November 2024, adding Tiki Pets and Cloud Star to complement Blue Buffalo. Earlier in April 2024, General Mills also acquired Belgium-based Edgard and Cooper for EUR 100 million (USD 108 million), signaling confidence in premium European growth lanes.[3]Source: General Mills, “General Mills Advances Accelerate Strategy and Expands Pet Food Portfolio with Acquisition of Edgard and Cooper,” GENERALMILLS.COM.
Private equity plays a catalytic role in market dynamism. The Nutriment Company executed four acquisitions in 2024, including Germany-based PETMAN and United Kingdom-based Pet Treats Wholesale, to assemble a pan-European raw pet food portfolio. Technology-centric insurgents challenge incumbents through direct-to-consumer supply chains. Ollie’s acquisition of DIG Labs’ AI platform in December 2024 allows algorithmic formulation adjustments based on real-time bio-markers collected through stool analysis. Plant-based specialist HOWND joined Pets Choice Limited in October 2024, highlighting the traction of alternative protein narratives.
Incumbents respond by bolstering omnichannel engagement, doubling R&D investment in novel proteins, and forming strategic co-manufacturing partnerships to secure capacity. Proprietary kibble extrusion technologies enable nutrient density while meeting clean-label constraints. Marketing budgets embrace influencer campaigns and veterinarian education to reinforce trust. Regulatory compliance acumen differentiates large players when navigating evolving packaging, ingredient, and claim frameworks across multiple jurisdictions.
Dog Food Industry Leaders
Colgate-Palmolive Company (Hill's Pet Nutrition Inc.)
General Mills Inc.
Nestle (Purina)
The J. M. Smucker Company
Mars, Incorporated
- *Disclaimer: Major Players sorted in no particular order
Recent Industry Developments
- December 2024: General Mills has acquired Whitebridge Pet Brands for USD 1.45 billion, adding the Tiki Pets and Cloud Star brands and 2 United States manufacturing plants
- July 2023: Hill's Pet Nutrition introduced its new MSC (Marine Stewardship Council) certified pollock and insect protein products for pets with sensitive stomachs and skin lines. They contain vitamins, omega-3 fatty acids, and antioxidants.
- March 2023: Mars, Incorporated opened its first pet food research and development center in Asia-Pacific. This new facility, called the APAC pet center, will support the company's product development.
Global Dog Food Market Report Scope
Food, Pet Nutraceuticals/Supplements, Pet Treats, Pet Veterinary Diets are covered as segments by Pet Food Product. Convenience Stores, Online Channel, Specialty Stores, Supermarkets/Hypermarkets are covered as segments by Distribution Channel. Africa, Asia-Pacific, Europe, North America, South America are covered as segments by Region.| Food | By Sub Product | Dry Pet Food | By Sub Dry Pet Food | Kibbles |
| Other Dry Pet Food | ||||
| Wet Pet Food | ||||
| Pet Nutraceuticals/Supplements | By Sub Product | Milk Bioactives | ||
| Omega-3 Fatty Acids | ||||
| Probiotics | ||||
| Proteins and Peptides | ||||
| Vitamins and Minerals | ||||
| Other Nutraceuticals | ||||
| Pet Treats | By Sub Product | Crunchy Treats | ||
| Dental Treats | ||||
| Freeze-dried and Jerky Treats | ||||
| Soft and Chewy Treats | ||||
| Other Treats | ||||
| Pet Veterinary Diets | By Sub Product | Derma Diets | ||
| Diabetes | ||||
| Digestive Sensitivity | ||||
| Obesity Diets | ||||
| Oral Care Diets | ||||
| Renal | ||||
| Urinary tract disease | ||||
| Other Veterinary Diets |
| Convenience Stores |
| Online Channel |
| Specialty Stores |
| Supermarkets/Hypermarkets |
| Other Channels |
| Africa | Country | South Africa |
| Rest of Africa | ||
| Asia-Pacific | Country | Australia |
| China | ||
| India | ||
| Indonesia | ||
| Japan | ||
| Malaysia | ||
| Philippines | ||
| Taiwan | ||
| Thailand | ||
| Vietnam | ||
| Rest of Asia-Pacific | ||
| Europe | Country | France |
| Germany | ||
| Italy | ||
| Netherlands | ||
| Poland | ||
| Russia | ||
| Spain | ||
| United Kingdom | ||
| Rest of Europe | ||
| North America | Country | Canada |
| Mexico | ||
| United States | ||
| Rest of North America | ||
| South America | Country | Argentina |
| Brazil | ||
| Rest of South America |
| By Pet Food Product | Food | By Sub Product | Dry Pet Food | By Sub Dry Pet Food | Kibbles |
| Other Dry Pet Food | |||||
| Wet Pet Food | |||||
| Pet Nutraceuticals/Supplements | By Sub Product | Milk Bioactives | |||
| Omega-3 Fatty Acids | |||||
| Probiotics | |||||
| Proteins and Peptides | |||||
| Vitamins and Minerals | |||||
| Other Nutraceuticals | |||||
| Pet Treats | By Sub Product | Crunchy Treats | |||
| Dental Treats | |||||
| Freeze-dried and Jerky Treats | |||||
| Soft and Chewy Treats | |||||
| Other Treats | |||||
| Pet Veterinary Diets | By Sub Product | Derma Diets | |||
| Diabetes | |||||
| Digestive Sensitivity | |||||
| Obesity Diets | |||||
| Oral Care Diets | |||||
| Renal | |||||
| Urinary tract disease | |||||
| Other Veterinary Diets | |||||
| By Distribution Channel | Convenience Stores | ||||
| Online Channel | |||||
| Specialty Stores | |||||
| Supermarkets/Hypermarkets | |||||
| Other Channels | |||||
| By Geography | Africa | Country | South Africa | ||
| Rest of Africa | |||||
| Asia-Pacific | Country | Australia | |||
| China | |||||
| India | |||||
| Indonesia | |||||
| Japan | |||||
| Malaysia | |||||
| Philippines | |||||
| Taiwan | |||||
| Thailand | |||||
| Vietnam | |||||
| Rest of Asia-Pacific | |||||
| Europe | Country | France | |||
| Germany | |||||
| Italy | |||||
| Netherlands | |||||
| Poland | |||||
| Russia | |||||
| Spain | |||||
| United Kingdom | |||||
| Rest of Europe | |||||
| North America | Country | Canada | |||
| Mexico | |||||
| United States | |||||
| Rest of North America | |||||
| South America | Country | Argentina | |||
| Brazil | |||||
| Rest of South America | |||||
Market Definition
- FUNCTIONS - Pet foods are usually intended to provide complete and balanced nutrition to the pet but are primarily used as functional products. The scope includes the food and supplements consumed by pets including veterinary diets. Supplements/nutraceuticals that are directly supplied to pets are considered within the scope.
- RESELLERS - Companies engaged in reselling of pet food without value addition have been excluded from the market scope, in order to avoid double counting.
- END CONSUMERS - Pet owners are considered to be the end-consumers in the market studied.
- DISTRIBUTION CHANNELS - Supermarkets/hypermarkets, specialty stores, convenience stores, online channels and other channels are considered within the scope. The stores which are exclusively providing pet related basic and custom products are considered within the scope of specialty stores.
| Keyword | Definition |
|---|---|
| Pet Food | The scope of pet food includes the food that is eatable by pets including food, treats, veterinary diets, and nutraceuticals/supplements. |
| Food | Food is animal feed intended for consumption by pets. It is formulated to provide essential nutrients and meet the dietary needs of various types of pets, including dogs, cats, and other animals. These are generally segmented into dry and wet pet foods. |
| Dry Pet Food | Dry pet foods may be extruded/baked (kibbles) or flaked. They have a lower moisture content, typically around 12-20%. |
| Wet Pet Food | Wet pet food, also known as canned pet food or moist pet food, generally has a higher moisture content compared to dry pet food, often ranging from 70-80%. |
| Kibbles | Kibbles are dry, processed pet food in small, bite-sized pieces or pellets. They are specifically formulated to provide balanced nutrition for various domestic animals, such as dogs, cats, and other animals. |
| Treats | Pet Treats are special food items or rewards given to pets, to show affection, and encourage good behavior. They are especially used during training. Pet treats are made from various combinations of meat or meat-derived materials with other ingredients. |
| Dental Treats | Pet dental treats are specialized treats that are formulated to promote good oral hygiene in pets. |
| Crunchy Treats | It is a type of pet treat that has a firm and crispy texture which can be a good source of nutrition for pets. |
| Soft and chewy treats | Soft and Chewy pet treats are a type of pet food product that is formulated to be easy to chewy and digest. They are usually made from soft and pliable ingredients, such as meat, poultry, or vegetables, that have been blended and formed into bite-sized pieces or strips. |
| Freeze-dried & Jerky Treats | Freeze-dried and jerky treats are snacks given to pets, that are prepared through a special preservation process, without damaging the nutritional content, resulting in long-lasting, nutrient-rich treats. |
| Urinary Tract Disease Diets | These are commercial diets that are specifically formulated to promote urinary health and reduce the risk of urinary tract infections and other urinary problems. |
| Renal Diets | These are specialized pet foods formulated to support the health of pets with kidney disease or renal insufficiency. |
| Digestive Sensitivity Diets | Digestive-sensitive diets are specially formulated to meet the nutritional needs of pets with digestive issues such as food intolerances, allergies, and sensitivities. These diets are designed to be easily digestible and to reduce the symptoms of digestive problems in pets. |
| Oral Care Diets | Oral care diets for pets are specially formulated diets produced to promote oral health and hygiene in pets. |
| Grain-Free Pet Food | Pet food that does not contain common grains like wheat, corn, or soy. Grain-free diets are often preferred by pet owners seeking alternative options or if their pets have specific dietary sensitivities. |
| Premium Pet Food | High-quality pet food formulated with superior ingredients often offers additional nutritional benefits compared to standard pet food. |
| Natural Pet Food | Pet food made from natural ingredients, with minimal processing and without artificial preservatives. |
| Organic Pet Food | Pet food is produced using organic ingredients, free from synthetic pesticides, hormones, and genetically modified organisms (GMOs). |
| Extrusion | A manufacturing process used to produce dry pet food, where ingredients are cooked, mixed, and shaped under high pressure and temperature. |
| Other Pets | Other pets include birds, fish, rabbits, hamsters, ferrets, and reptiles. |
| Palatability | The taste, texture, and aroma of pet food influence its appeal and acceptance by pets. |
| Complete and Balanced Pet Food | Pet food that provides all essential nutrients in appropriate proportions to meet the nutritional needs of pets without additional supplementation. |
| Preservatives | These are the substances that are added to pet food to extend its shelf life and prevent spoilage. |
| Nutraceuticals | Food products that offer health benefits beyond basic nutrition, often contain bioactive compounds with potential therapeutic effects. |
| Probiotics | Live beneficial bacteria that promote a healthy balance of gut flora, supporting digestive health and immune function in pets. |
| Antioxidants | Compounds that help neutralize harmful free radicals in the body, promoting cellular health and supporting the immune system in pets. |
| Shelf-Life | The duration of which pet food remains safe and nutritionally viable for consumption after its production date. |
| Prescription diet | Specialized pet food formulated to address specific medical conditions under veterinary supervision. |
| Allergen | A substance that can cause allergic reactions in some pets, leading to food allergies or sensitivities. |
| Canned food | Wet pet food that is packed in cans and contains higher moisture content than dry food. |
| Limited ingredient diet (LID) | Pet food formulated with a reduced number of ingredients to minimize potential allergens. |
| Guaranteed Analysis | The minimum or maximum levels of certain nutrients present in pet food. |
| Weight management | Pet food designed to help pets maintain a healthy weight or support weight loss efforts. |
| Other Nutraceuticals | It includes prebiotics, antioxidants, digestive fiber, enzymes, essential oils and herbs. |
| Other Veterinary Diets | It includes weight management diets, skin and coat health, cardiac care, and joint care. |
| Other Treats | It includes rawhides, mineral blocks, lickables, and catnips. |
| Other Dry Foods | It includes cereal flakes, mixers, meal toppers, freeze-dried foods, and air-dried foods. |
| Other Animals | It includes birds, fish, reptiles, and small animals (rabbits, ferrets, hamsters). |
| Other Distribution Channels | It includes veterinary clinics, local unregulated stores, and feed and farm stores. |
| Proteins and Peptides | Proteins are large molecules composed of basic units called amino acids which help in the growth and development of pets. Peptides are the short string of 2 to 50 amino acids. |
| Omega-3 fatty acids | Omega-3 fatty acids are essential polyunsaturated fats that play a crucial role in the overall health and well-being of Pets |
| Vitamins | Vitamins are the essential organic compounds that are essential for vital physiological functioning. |
| Minerals | Minerals are naturally occurring inorganic substances that are essential for various physiological functions in pets. |
| CKD | Chronic Kidney Disease |
| DHA | Docosahexaenoic Acid |
| EPA | Eicosapentaenoic Acid |
| ALA | Alpha-linolenic Acid |
| BHA | Butylated Hydroxyanisol |
| BHT | Butylated Hydroxytoluene |
| FLUTD | Feline Lower Urinary Tract Disease |
Research Methodology
Mordor Intelligence follows a four-step methodology in all our reports.
- Step-1: IDENTIFY KEY VARIABLES: In order to build a robust forecasting methodology, the variables and factors identified in Step-1 are tested against available historical market numbers. Through an iterative process, the variables required for market forecast are set and the model is built on the basis of these variables.
- Step-2: Build a Market Model: Market-size estimations for the forecast years are in nominal terms. Inflation is not a part of the pricing, and the average selling price (ASP) is kept constant throughout the forecast period.
- Step-3: Validate and Finalize: In this important step, all market numbers, variables and analyst calls are validated through an extensive network of primary research experts from the market studied. The respondents are selected across levels and functions to generate a holistic picture of the market studied.
- Step-4: Research Outputs: Syndicated Reports, Custom Consulting Assignments, Databases & Subscription Platforms


