
Data Center Networking Market Size and Share
Market Overview
| Study Period | 2020 - 2031 |
|---|---|
| Market Size (2026) | USD 36.1 Billion |
| Market Size (2031) | USD 80.21 Billion |
| Growth Rate (2026 - 2031) | 17.32% CAGR |
| Fastest Growing Market | Asia Pacific |
| Largest Market | North America |
| Market Concentration | Medium |
Major Players
*Disclaimer: Major Players sorted in no particular order Image © Mordor Intelligence. Reuse requires attribution under CC BY 4.0. |
|
Data Center Networking Market Analysis by Mordor Intelligence
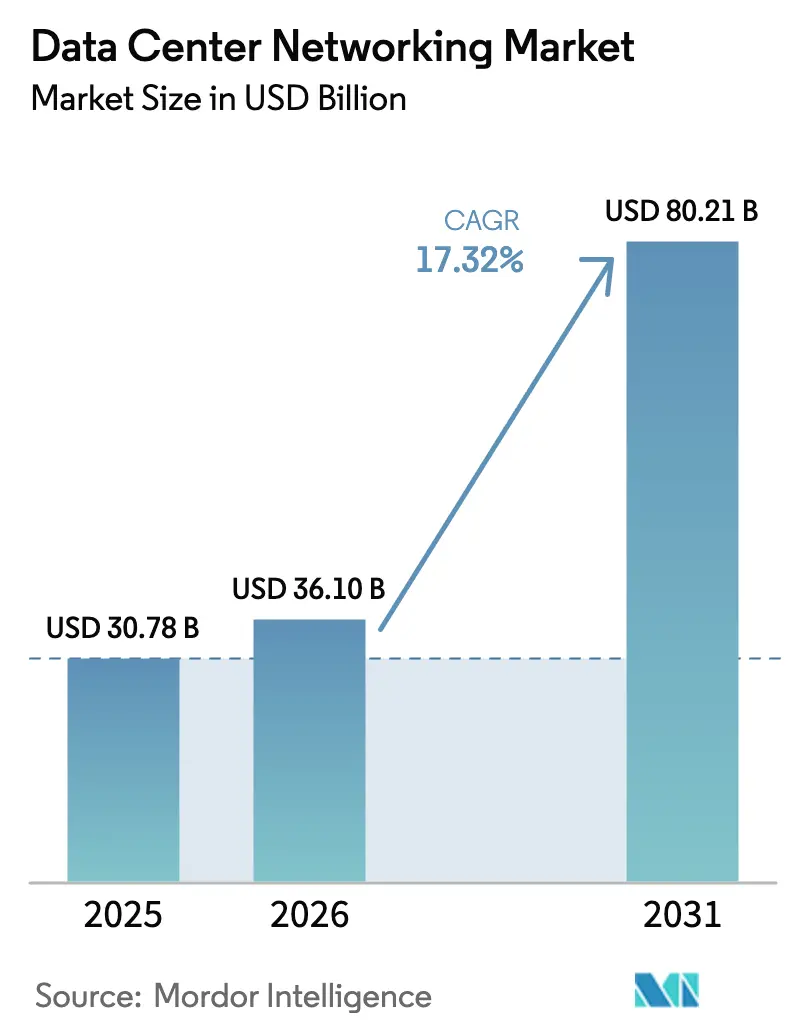
The global data center networking market size is expected to grow from USD 30.78 billion in 2025 to USD 36.1 billion in 2026 and is forecast to reach USD 80.21 billion by 2031 at 17.32% CAGR over 2026-2031. The data center networking market is expanding because enterprises are redesigning three-tier networks into AI-optimized fabrics that reduce east-west congestion and shorten model-training times. Growing hyperscale investments, rapid 400 GbE price erosion, and government-led digital sovereignty initiatives are accelerating new-build projects in both developed and emerging economies. Vendor competition now pivots on lossless Ethernet capabilities, merchant-silicon roadmaps, and ecosystem partnerships that simplify AI cluster deployment. Power density constraints and supply chain dependencies on switching ASICs pose the primary structural risks to growth.
Key Report Takeaways
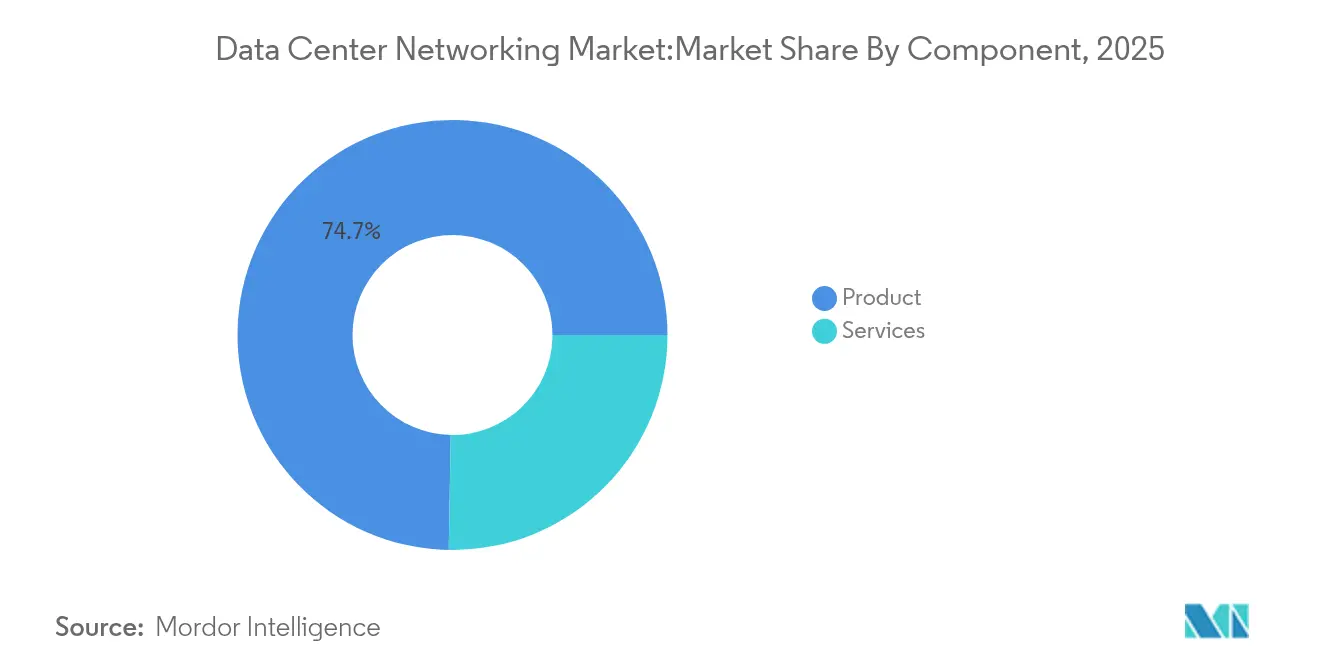
- By component, products led with 74.72% data center networking market share in 2025, while Services is projected to expand at a 17.7% CAGR to 2031.
- By end-user, IT and Telecommunications held 35.75% of the data center networking market size in 2025; Manufacturing and Industrial is forecast to grow at an 18.05% CAGR through 2031.
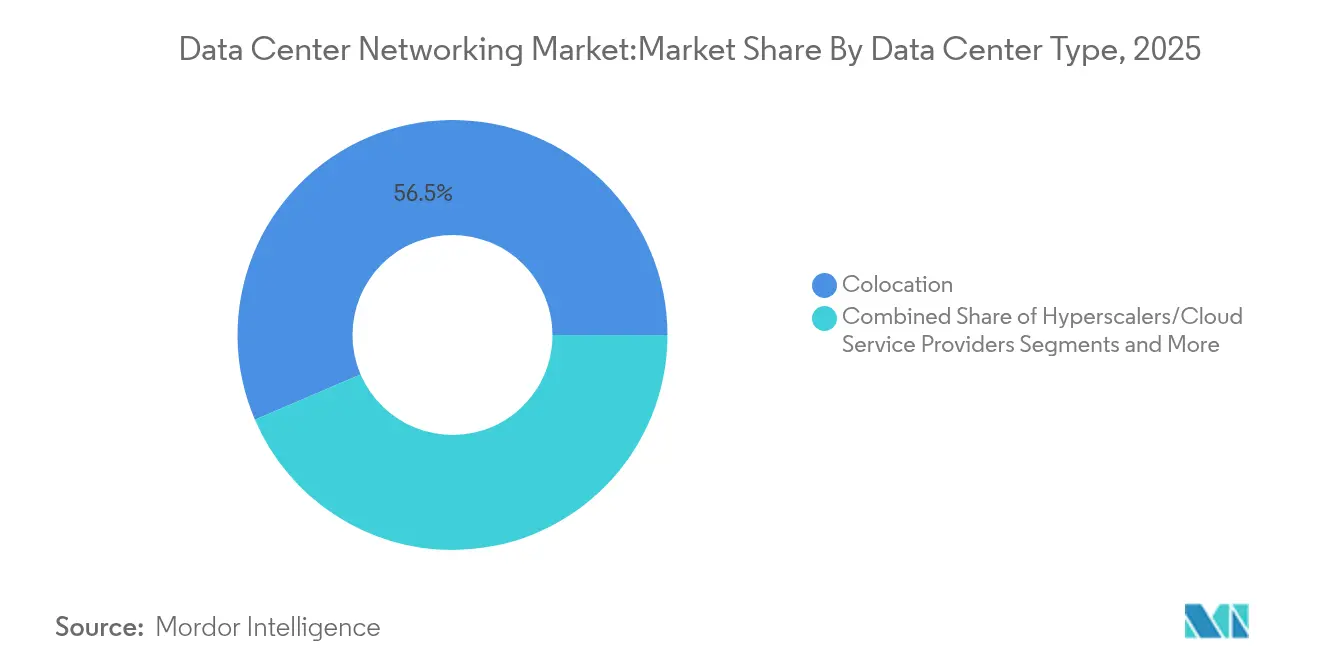
- By data-center type, colocation accounted for 56.45% of the data center networking market size in 2025; Hyperscaler/Cloud Service Provider facilities will advance at a 19.05% CAGR to 2031.
- By bandwidth, the 50–100 GbE class commanded 38.15% share of the data center networking market size in 2025, whereas ports above 100 GbE will increase at an 17.74% CAGR between 2026 and 2031.
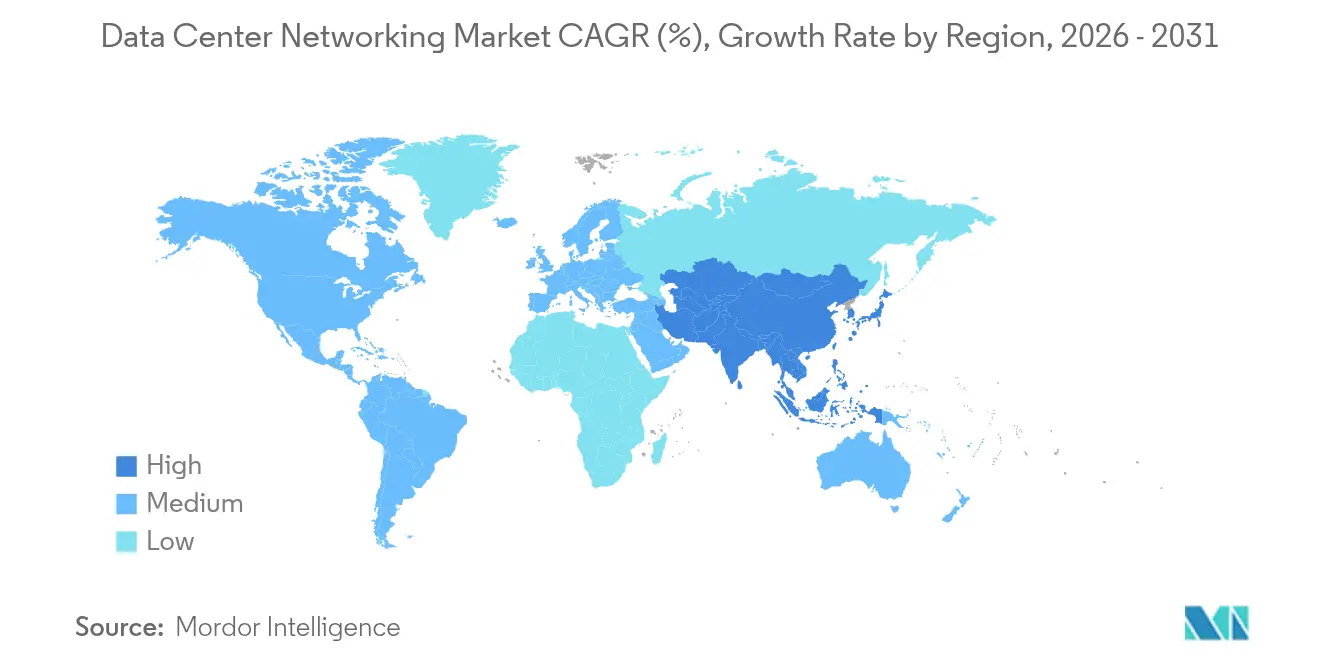
- Regionally, North America captured 26.05% of the 2025 data center networking market while Asia-Pacific is poised for the fastest 17.55% CAGR to 2031.
Note: Market size and forecast figures in this report are generated using Mordor Intelligence’s proprietary estimation framework, updated with the latest available data and insights as of 2026.
Global Data Center Networking Market Trends and Insights
Drivers Impact Analysis*
| Driver | (~) % Impact on CAGR Forecast | Geographic Relevance | Impact Timeline |
|---|---|---|---|
| Growing cloud-first enterprise IT strategies | +3.2% | Global, with concentration in North America and Europe | Medium term (2-4 years) |
| Surge in East-West traffic owing to AI/ML workloads | +4.1% | Global, led by Asia-Pacific hyperscale regions | Short term (≤ 2 years) |
| Edge data-center build-outs by telecom operators | +2.8% | Asia-Pacific core, spill-over to MEA and Latin America | Medium term (2-4 years) |
| 400 GbE port price erosion improves ROI | +1.9% | Global, early adoption in North America | Short term (≤ 2 years) |
| Adoption of lossless Ethernet for accelerated computing | +2.3% | North America and Asia-Pacific hyperscale markets | Medium term (2-4 years) |
| Hyperscalers' open-source network OS contributions | +1.5% | Global, concentrated in major cloud regions | Long term (≥ 4 years) |
| Source: Mordor Intelligence | |||
Growing Cloud-First Enterprise IT Strategies
Enterprises replacing hub-and-spoke designs with micro-services generate unpredictable traffic bursts that demand software-defined overlays and realtime telemetry. Programmable switches, cloud-native firewalls, and zero-trust segmentation become mandatory as financial institutions expand cloud budgets. This driver sustains refresh cycles for 400 GbE leaf-spine fabrics and analytics engines that discover and remediate latency hotspots.
AI/ML East-West Traffic Surge
GPU clusters move gradients and parameters at volumes up to 100 times higher than legacy workloads, overwhelming conventional north-south architectures. RoCE-v2 with Priority Flow Control and Explicit Congestion Notification prevents packet loss during collective operations, while demand for 800 G and 1.6 T interfaces accelerates merchant-silicon innovation. [1]Alibaba HPN, "A Data Center Network for Large Language Model Training | Proceedings of the ACM SIGCOMM 2024 Conference," dl.acm.orgTier-2 clouds adopt Ethernet rather than proprietary transports to balance cost and interoperability.
Telecom-Led Edge Data-Center Build-Outs
Operators integrate carrier-grade timing with high-density Top-of-Rack switches to support 5G, IoT, and generative-AI inference at the network edge. Converged boxes with both BGP and VXLAN shorten deployment cycles in space-constrained shelters. Over 15 global telcos are now building AI-enabled micro sites that shift traffic away from regional cores.
400 GbE Port Price Erosion
Optics and switch ASIC costs for 400 GbE fell more than 35% between 2023 and 2025, giving mid-market enterprises economic headroom to leapfrog 100 G upgrades. The virtuous volume-cost loop enables hyperscalers to pilot 800 G links for forthcoming GPU generations while stimulating broader ecosystem adoption of QSFP-DD and OSFP transceivers.[2]Dell ,"64 x 400GbE: A Faster, Greener Data Center," dell.com
Restraints Impact Analysis*
| Restraint | (~) % Impact on CAGR Forecast | Geographic Relevance | Impact Timeline |
|---|---|---|---|
| Multi-vendor interoperability challenges | -2.1% | Global, acute in enterprise environments | Medium term (2-4 years) |
| Rising network complexity and skill gaps | -1.8% | Global, concentrated in emerging markets | Long term (≥ 4 years) |
| Supply-chain risk for merchant silicon | -1.4% | Global, critical for APAC manufacturing | Short term (≤ 2 years) |
| Escalating data-center power density limits port upgrades | -2.3% | Global, severe in urban data centers | Medium term (2-4 years) |
| Source: Mordor Intelligence | |||
Multi-Vendor Interoperability Issues
Proprietary protocol extensions impede seamless integration across switches, optics, and telemetry agents, forcing enterprises to invest in costly validation labs. [3]Verizon Communications, “Multi-Vendor Automation Lessons Learned,” verizon.com Delays in open-standard controller support extend migration timelines and create operational silos, particularly where AI clusters require deterministic latency guarantees across dissimilar fabrics.
Rising Network Complexity and Skill Gaps
Administrators must master lossless Ethernet semantics, GPU workload telemetry, and intent-based automation simultaneously. Certified talent pools remain scarce outside tier-one economies, driving demand for managed-service contracts and vendor-delivered automation. Knowledge shortages lengthen mean-time-to-repair and inflate operational budgets.
*Our forecasts treat driver/restraint impacts as directional, not additive. The impact forecasts reflect baseline growth, mix effects, and variable interactions.
Segment Analysis
By Component: Services Gain Momentum Amid Complexity
Products retained 74.72% of data center networking market revenue in 2025, led by Ethernet switches that transitioned from 100 G to 400 G to satisfy AI workloads. Optical interconnects, storage fabrics, and application delivery controllers reinforced Product dominance but now face slowing unit growth as enterprises focus on architectural simplification. Vendors reported upticks in 51.2 Tbps chassis sales as GPU clusters expanded.
The Services segment is projected to grow at 17.7% CAGR as customers offload design, integration, and lifecycle management of lossless fabrics. Installation services for Priority Flow Control tuning, consulting on congestion metrics, and ongoing managed-fabric subscriptions fuel recurring revenue. Enterprises cite reduced mean-time-to-deploy by 38% after adopting turnkey managed operations, positioning Services as a critical enabler of AI business outcomes.


By End-User: Manufacturing Drives Edge Transformation
IT & Telecommunications captured 35.75% of the data center networking market in 2025 by virtue of hyperscale cloud, CDN, and telco investments that underpin digital-service delivery. Banking, media streaming, and e-commerce workloads dominate regional consumption across metro campuses.
Manufacturing & Industrial will advance at an 18.05% CAGR through 2031 as predictive-maintenance algorithms migrate from centralized clouds to factory-floor micro-data centers. Low-latency Ethernet fabrics link robotics, machine-vision cameras, and MES applications, cutting downtime and energy waste. Edge-native networking contracts have grown 2.4 times since 2023, underpinning sustained demand for compact, fanless 400 GbE leaf switches.
By Data-Center Type: Hyperscalers Lead AI Infrastructure
Colocation operators held 56.45% of 2025 revenue as enterprises pursued asset-light models but insisted on controlling their own layer-2 domains. Retrofit activity focused on liquid cooling loops and higher amperage feeds to accommodate racks exceeding 80 kW.
Hyperscaler and Cloud Service Provider campuses will rise at a 19.05% CAGR, accounting for the largest absolute addition to global optical backbones. AI clusters with 16,000+ GPUs require non-blocking Clos fabrics exceeding 2 Pbps, prompting system integrators to deploy fully integrated leaf-spine-superspine topologies pre-cabled at the factory. The result is an unprecedented pull-through effect for top-of-rack optics and 102.4 Tbps switching silicon.
By Bandwidth: Greater Than 100 GbE Segment Accelerates
Ports between 50 GbE and 100 GbE represented 38.15% of shipments in 2025 as enterprise refresh cycles caught up with hyperscale standards. However, the >100 GbE tier will grow 17.74% annually, driven by the data center networking market need for 400 G leafs and 800 G spines in AI clusters. In comparison, ≤10 GbE ports now concentrate in branch and management networks only.
The >100 GbE expansion correlates with merchant-silicon roadmaps offering 51.2 Tbps and 102.4 Tbps densities. Optoelectronic co-packaging and advanced PAM4 modulation further lower power per bit, partially offsetting rack-level thermal pressures. Early pilots of 1.6 T Ethernet are under evaluation by three hyperscalers for 2027 production clusters.
Geography Analysis
North America controlled 26.05% of 2025 revenue as the data center networking market scaled to support multi-billion-dollar hyperscale expansions. The United States dominates regional capex, while Canadian edge-cloud operators and Mexican near-shore campuses contribute incremental demand. Local equipment manufacturers benefit from favorable tax incentives and ultra-low carbon-intensity power grids.Asia-Pacific is the fastest-growing territory with a 17.55% CAGR through 2031, reflecting sovereign AI strategies that favor domestic processing. China’s Eastern-Data-Western-Compute backbone aligns eight desert-region hyperscale hubs with coastal interconnects, driving bulk transceiver procurement. India exceeded 950 MW installed IT load in 2025, triggering step-function demand for 400 GbE fabrics across both colocation and telco edge sites. Markets such as Indonesia and Vietnam reinforce the growth wave with supportive regulatory frameworks and regional subsea-cable investments.
Mordor Intelligence provides coverage of the data center networking market across other key regional markets, including Europe, Africa, North America, South America, Middle East, and Asia, each with their regulatory frameworks and demand patterns. Detailed country-level analysis extends to Belgium, Nigeria, Canada, and Brazil incorporating local coverage and market participation, as required.

Regulatory Landscape
Data center networking demand is increasingly shaped by cybersecurity, operational resilience, and product compliance regimes that extend beyond operators to equipment and managed-service providers. In the European Union, NIS 2 sets baseline security and supply-chain expectations across critical and important entities, while the Digital Operational Resilience Act (DORA) tightens incident reporting and third-party risk management requirements for covered financial services and their ICT service providers, reinforcing auditability and telemetry in network operations. The EU AI Act (2025) also raises governance expectations for AI systems, influencing how organizations document risk, transparency, and controls for AI workloads running on high-bandwidth fabrics.
Sustainability and hardware-compliance rules are adding parallel constraints on networking refresh cycles. EU Ecodesign and RoHS requirements affect design choices for switches, optics, and power-efficient architectures, increasing the emphasis on energy-per-bit metrics and lifecycle management across multi-vendor environments. Outside Europe, the United States continues to apply a more fragmented approach, including state-level AI-related transparency measures such as in Maryland and Colorado, which feeds into region-specific compliance playbooks for AI infrastructure deployments and the services built around them.
Competitive Landscape
Data center networking market competition is moderate but intensifying as AI optimizations shift value toward lossless fabrics and integrated telemetry. Arista Networks overtook Cisco in Q4 2023 switching revenue within hyperscale accounts by aligning its EOS operating system with AI congestion-control enhancements. NVIDIA capitalized on Spectrum-X to extend its GPU moat into Ethernet, targeting end-to-end AI platform ownership.
Cisco counters through Silicon One integration with NVIDIA’s platforms and by leveraging its enterprise installed base for cross-selling AI-ready fabrics. Juniper Networks’ impending acquisition by HPE signals a strategic move to fuse AI-native routing with edge-to-cloud stacks. Dell and Huawei compete on vertically-integrated racks that pre-stage copper-to-liquid cooling conversions. Start-ups such as Arrcus exploit cloud-neutral routing stacks to win Tier-2 cloud and colocation footprints where agility trumps vendor incumbency. Optical landscape dynamics include Nokia’s purchase of Infinera to create coherent-optics portfolios tuned for metro data-center-interconnect. The competitive frontier is now defined by co-packaged optics, adaptive routing for AI workloads, and cloud-native observability that unifies compute and network metrics.
Data Center Networking Industry Leaders
-
Cisco Systems Inc.
-
Arista Networks Inc.
-
Juniper Networks Inc.
-
Huawei Technologies Co. Ltd.
-
Dell Technologies (Dell EMC)
- *Disclaimer: Major Players sorted in no particular order


Market Opportunities and Future Outlook
AI-optimized fabrics are driving a step change in high-speed Ethernet, creating whitespace for platforms and services that simplify adoption of 800G and 1.6T-class networking in GPU-heavy environments. The opportunity is concentrated in validated, systems-level reference architectures that reduce integration risk across switches, optics, cabling, and operations tooling, a direction reflected in vendor moves toward end-to-end AI infrastructure bundles from Cisco, Arista, and HPE/Juniper. With products still accounting for 74.72% of market revenue in 2025, switch and optical platforms remain central, but lossless Ethernet tuning and congestion management are expanding the addressable scope for installation, integration, and managed-fabric offerings.
Operational automation is becoming a differentiator for east-west traffic patterns and multi-tenant environments where deterministic performance matters. Software-defined networking controllers, observability, and policy automation can expand as tools for congestion detection and QoS adjustments mature, including orchestration that spans on-prem and public cloud connectivity. On the hyperscale side, work on modular interconnect designs and optical switching concepts, including Google research on topologies and optical circuit switching, supports ongoing demand for higher port densities, power-aware designs, and DCI-capable optical interconnects. This aligns with the broader shift toward fabrics that treat networking as part of an AI supersystem rather than a standalone tier.
Recent Industry Developments
- July 2026: Updated Cisco Nexus Hyperfabric to include expanded support for N93108TC-FX3 and N9164E-NS4-O switches within its fabric-as-a-service operational model. The update expands multicloud fabric capabilities to better support AI-driven workloads across distributed data center environments. This strengthens Cisco's position in fabric-based AI deployments and broadens its addressable market for high performance networking fabrics.
- June 2026: Arista Networks Inc. introduced the 7060XE7 Series, a portfolio of 1.6T networking platforms featuring Broadcom Tomahawk 6 silicon, 224G SerDes technology, and specialized liquid-cooled variants for rack-scale AI infrastructure. The lineup enables higher density AI fabric deployments and accelerates bandwidth growth in hyperscale environments. This reinforces Arista's leadership in high performance AI data-center networks and supports expanded customer workloads.
- June 2026: Juniper Networks Inc. commenced shipping the QFX5250-64OE-L, a 102.4 Tbps switch featuring 64 x 1.6 Tbps OSFP-RHS ports and 100% liquid-cooling, compliant with the Open Compute ORv3 standard. The product improves cooling efficiency and port density for AI-enabled data centers. It aligns Juniper with hyperscale interconnect requirements and strengthens its position in next generation data center architectures.


Research Methodology Framework and Report Scope
Market Definition and Coverage
This market covers the revenue generated from networking products, software, and related services deployed inside data centers to connect servers, storage, and internet or cloud on-ramps, covering enterprise, colocation, and hyperscale sites.
Scope exclusions: We do not count general telecom carrier backbone buildouts or consumer premises networking that does not sit within data center network architectures.
Segmentation Overview
-
By Component
-
Products
- Ethernet Switches
- Routers
- Storage Area Network (SAN)
- Application Delivery Controllers (ADC)
- Network Security Appliances
- Software-Defined Networking (SDN) Controllers
- Optical Interconnects
-
Services
- Installation and Integration
- Training and Consulting
- Support and Maintenance
- Managed Network Services
-
Products
-
By End-User
- IT and Telecommunications
- Banking, Financial Services and Insurance (BFSI)
- Government and Defense
- Media and Entertainment
- Healthcare and Life Sciences
- Manufacturing and Industrial
- Other End-Users
-
By Data-Center Type
- Colocation
- Hyperscalers/Cloud Service Providers
- Edge/Micro Data Centers
-
By Bandwidth
- Less than 10 GbE
- 25-40 GbE
- 50-100 GbE
- Greater than 100 GbE
-
By Geography
-
North America
- United States
- Canada
- Mexico
-
South America
- Brazil
- Argentina
- Rest of South America
-
Europe
- Germany
- United Kingdom
- France
- Netherlands
- Rest of Europe
-
Asia-Pacific
- China
- Japan
- India
- South Korea
- Australia and New Zealand
- Rest of Asia-Pacific
-
Middle East and Africa
-
Middle East
- United Arab Emirates
- Saudi Arabia
- Turkey
- Rest of Middle East
-
Africa
- South Africa
- Nigeria
- Rest of Africa
-
Middle East
-
North America
Data Sources, Market Sizing, and Validation
Desk Research
Desk research was used to set the fact base and define what should be counted as data center networking spend before the model was built. We leaned on public sources such as ITU connectivity statistics, OECD digital economy indicators, World Bank macro series, U.S. Census trade releases for relevant electronics categories, and IEEE and IETF publications that signal technology shifts like 400G and 800G.
We also reviewed vendor annual reports and investor decks, data center association publications, and credible press coverage to understand upgrade cycles, supply constraints, and shipment commentary. Where available, paid subscriptions were used to cross-check company financials and to scan patent activity that can validate the timing of platform transitions. The sources listed here are illustrative only, and many additional public references were used to collect data, validate assumptions, and clarify open questions.
Primary Interviews and Surveys
Primary interviews and surveys helped convert broad demand signals into market-relevant assumptions that can be modeled. We spoke with data center operators, network architects, systems integrators, and component channel participants across APAC, EMEA, and the Americas, so gaps from desk research could be filled and then checked with multiple viewpoints.
Distribution of primary research fieldwork respondents
| Company type | Respondent position | Region |
|---|---|---|
| Top tier: 30% | CXOs: 16% | APAC: 53% |
| Mid tier: 52% | Functional/Unit leaders: 40% | EMEA: 29% |
| Smaller Players: 18% | Managers: 44% | Americas: 18% |
Market-Sizing & Forecasting
Sizing starts with a top-down build where data center footprint growth and upgrade intensity are reconstructed using a demand-pool view, then converted into spend across core networking categories. Inputs that matter in this market include installed and planned data center capacity (MW and floor space proxies), port speed migration (100G to 400G to 800G), switch and router average selling price trends, optics attach rates, and the share of spend routed through managed and integration services.
To keep the model realistic, results are corroborated with selective bottom-up approximations such as sampled price times volume checks for switching ports and transceiver volumes, plus channel feedback on lead times and discounting. When geography or component data is thin, we use conservative interpolation anchored to observable indicators like data center construction activity and cloud capex signals, and then re-check assumptions in follow-up calls. Forecasts are developed using scenario analysis supported by expert input on AI cluster build timing, Ethernet roadmaps, and likely pricing erosion by speed class, then consolidated into a single base case.
Data Validation & Update Cycle
Outputs are validated through multiple checks so that obvious overcounts and missing buckets are removed early. We compare totals against independent signals like data center capex direction, public shipment commentary, and regional build activity, and then anomalies are reviewed by another analyst before sign-off.
If a variance is material, the assumptions that drive it are revisited, and the interview loop is reopened for targeted reconfirmation. The report is refreshed annually, and interim updates are made when major events shift pricing, supply, or deployment pace. Before delivery, a final review pass is completed so clients get the most current view available at that time.
Mordor Intelligence's Global Data Center Networking Market Size Compared Against Other Published Estimates
Published market sizes for data center networking often do not match because counted spend can shift based on what is treated as in-scope networking, which year is used as the base, and how pricing changes are handled for high-speed ports and optics.
Some sources use a broader technology view that can blend adjacent data center technology spend into the networking total. In Mordor Intelligence, the number is limited to networking products, software, and services directly deployed to build and operate data center networks, and it is refreshed with pricing and mix checks tied to 100G to 800G transitions.
Benchmark comparison
| Source | Market Size | Gaps in Research Methodology |
|---|---|---|
| Mordor Intelligence | USD 30.78 B (2025) | |
| Trade Journal A | USD 45.80 B (2025) | Uses a wider definition labeled as data center networking technologies, which can pull in adjacent data center technology categories and a different base-year framing. |
| Global Consultancy B | USD 37.60 B (2024) | Anchors the model to an earlier base year and applies different price and mix assumptions for hardware and software, which can change the implied 2025 level after currency timing and upgrade-cycle normalization. |
The spread in the table mostly comes from scope breadth and base-year choices, and then from how fast pricing is assumed to move as 400G and 800G adoption rises. By keeping the counted spend tied to data center network deployments, and by checking port-speed mix and ASP direction with interview feedback, the estimate stays traceable to practical variables that can be repeated and audited.


Key Questions Answered in the Report
What is the current size of the data center networking market?
The data center networking market size stands at USD 36.1 billion in 2026.
How fast is the data center networking market expected to grow?
Industry revenue is projected to rise at a 17.32% CAGR, reaching USD 80.21 billion by 2031.
Which region is growing the quickest?
Asia-Pacific is forecast to post the fastest 17.55% CAGR through 2031, buoyed by China’s Eastern-Data-Western-Compute program and India’s 950 MW capacity build-out.
Why are services outpacing product growth?
The complexity of AI-optimized fabrics is driving enterprises to outsource design, integration, and lifecycle management, pushing the Services segment to a 17.7% CAGR.
Page last updated on:






