| Study Period | 2017 - 2030 |
| Base Year For Estimation | 2024 |
| Forecast Data Period | 2025 - 2030 |
| Market Size (2025) | USD 104.9 Billion |
| Market Size (2030) | USD 125.8 Billion |
| CAGR (2025 - 2030) | 3.68 % |
| Market Concentration | Low |
Major Players*Disclaimer: Major Players sorted in no particular order |

Dairy Desserts Market Analysis
The Dairy Desserts Market size is estimated at 104.9 billion USD in 2025, and is expected to reach 125.8 billion USD by 2030, growing at a CAGR of 3.68% during the forecast period (2025-2030).
The dairy desserts industry is experiencing significant transformation driven by evolving distribution channels and changing consumer preferences. Supermarkets and hypermarkets maintain dominance in the off-trade segment, leveraging their ability to offer competitive pricing through bulk purchasing power. Convenience stores have emerged as the second-largest distribution channel, with sales value increasing by 3.5% in 2022, reflecting consumers' growing preference for accessible purchase points. The foodservice sector has become increasingly important, with approximately 47% of global consumers dining at restaurants and 31% ordering through foodservice channels in 2022. This shift has prompted manufacturers to develop specialized product lines catering to the unique requirements of foodservice operators.
Health consciousness is reshaping product development strategies in the dairy desserts market, with manufacturers focusing on clean-label ingredients and better-for-you options. Key brands are experimenting with new formulations, including sugar-free or low-sugar ice creams and reduced or medium-fat variants. Premium and artisanal offerings have gained significant traction, with producers emphasizing natural ingredients and unique flavor profiles. The industry has witnessed a surge in innovative flavors and textures, particularly in traditional markets where consumers are increasingly seeking novel taste experiences.
Consumer consumption patterns vary significantly across regions, with ice cream remaining the dominant product category globally. In North America, approximately 73% of consumers enjoy ice cream at least once per week, with two-thirds preferring evening consumption. The average American consumes about 23 pounds of ice cream and other frozen desserts annually, highlighting the product's integration into regular dietary habits. This high consumption pattern has encouraged manufacturers to expand their product portfolios and invest in new flavor development.
The retail landscape continues to evolve with the rising importance of specialized distribution channels and digital platforms. Online retail channels have emerged as the fastest-growing distribution segment, driven by convenience and expanded product selection. Traditional retailers are adapting by implementing omnichannel strategies and enhancing their cold chain capabilities to ensure product quality. The industry has also witnessed increased collaboration between manufacturers and retailers to develop exclusive products and promotional strategies, creating differentiated offerings for specific retail channels.
Global Dairy Desserts Market Trends
The consumption of dairy desserts is boosted by factors such as growing consumer expenditure on food and beverage, the introduction of new flavors, and increasing impulse purchasing
- Dairy dessert is the second most consumed dairy product globally after milk. The industry accounted for a 14.74% share of the overall dairy product consumption in 2022. The rising demand for innovative flavors and formats, supported by the increasing demand to consume such products worldwide, is driving the demand.
- Frozen desserts in the United States observed a Y-o-Y growth of 2% in 2022. Developed markets like the United States, the United Kingdom, Germany, and Australia, have witnessed rising health concerns among the population. As a result, consumers across the region increasingly prefer ice cream products that are GMO-free, preservative-free, dairy-free, low in calories, and organic and fat-free in nature.
- The ice cream market in Asia is growing, with brands tapping into this trend to cater to indulgence and health preferences. For example, the per capita consumption of ice cream in India grew by 5.90% during 2023-2024. Growing consumer expenditure on food and beverage, the introduction of new flavors, increasing impulse purchasing, and strong demand for healthy ice cream products among consumers are some of the primary factors driving the consumption of ice cream. About 75% of consumers in the region often or even sometimes try new or different varieties while purchasing ice cream products.
- The increased consumer preference for gelato is one of the major factors driving its consumption in European countries. Due to the consumer demand for new and innovative flavors, there has been a rise in the preference for gelato in recent years. Gelato is considered a healthy dessert for a variety of reasons and is highly popular in countries like Italy, Germany, and Spain.

Understand The Key Trends Shaping This Market
Download PDF
OTHER KEY INDUSTRY TRENDS COVERED IN THE REPORT
- The growth in milk production can be attributed to factors such as improved weather conditions, increased volume of milk per cow, and changing dietary habits of consumers
Segment Analysis: Product Type
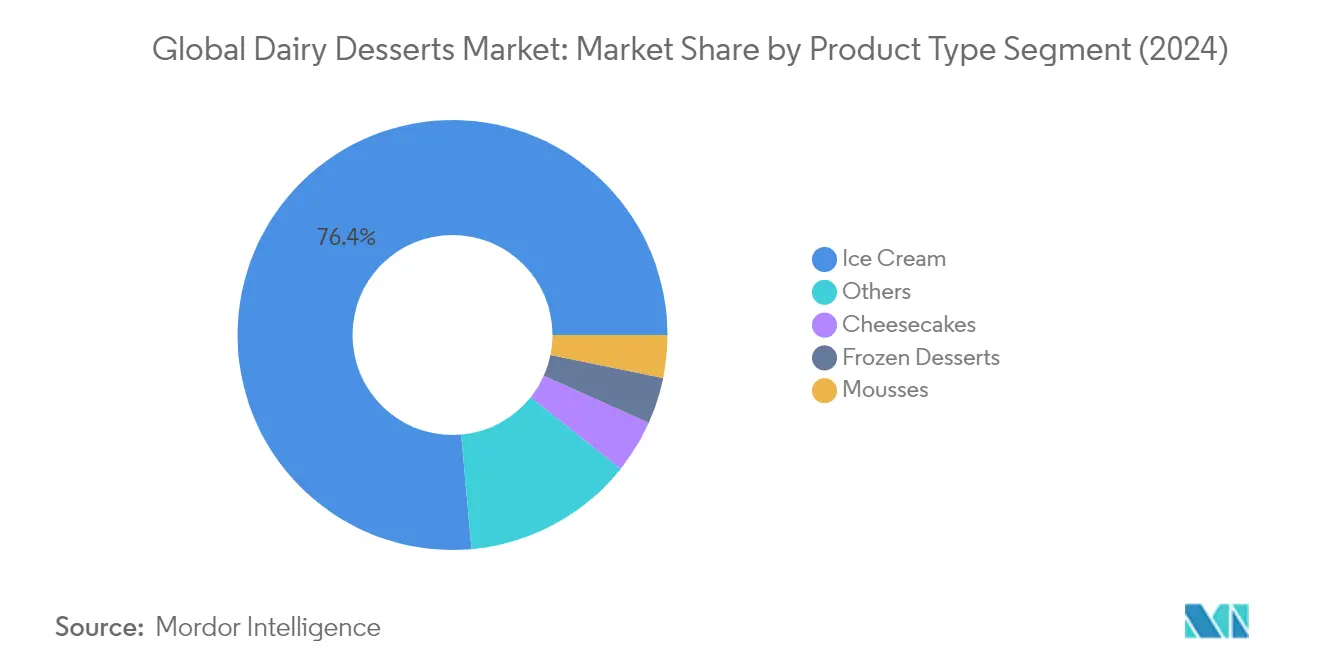
Ice Cream Segment in Global Dairy Desserts Market
Ice cream dominates the global dairy desserts market, commanding approximately 84% market share in 2024. The segment's strong performance is driven by rising consumer preference for premium ice creams and the growing popularity of intercontinental flavors. Manufacturers are actively innovating with new product variants, including sugar-free, low-sugar, and reduced-fat ice creams to cater to health-conscious consumers. Key brands like Ben & Jerry's are offering ice creams with 60-70% less fat and 35% fewer calories compared to conventional products. Europe represents a significant regional consumer of ice cream, accounting for about 37% of market volume. Traditional flavors like vanilla, strawberry, and chocolate remain popular across major European countries, with vanilla being particularly dominant about 84% of UK ice cream parlors reported it as their best-selling flavor.
Frozen Desserts Segment in Global Dairy Desserts Market
The frozen desserts segment is experiencing rapid growth in the global dairy desserts market, with an anticipated growth rate of approximately 6% during 2024-2029. This growth is primarily driven by increasing consumer interest in frozen appetizers and snacks across key regions. The segment's expansion is supported by factors like sensory appeal, convenience, and nutritional benefits. With rising health consciousness, consumers are increasingly preferring snacking products with low sugar and fat content, creating opportunities for low-calorie and zero-calorie frozen dairy desserts. This trend is supported by government dietary guidelines and programs in various countries. The segment offers a diverse range of products, including frozen tarts, frozen crumbles, ice cream cakes, fudge cakes, and sorbets, catering to evolving consumer preferences for healthier alternatives.
Remaining Segments in Global Dairy Desserts Market
The dairy desserts market includes other significant segments such as cheesecakes, mousses, and other traditional desserts. Cheesecakes have gained substantial traction, particularly in North America and Europe, with various flavors and styles available across different regions. The mousses segment has carved out its niche with popular variants like chocolate mousse cake, offering quick and easy preparation options for consumers with busy schedules. The "Others" category encompasses various traditional and regional dairy-based desserts, including trifles, fools, and local specialties that contribute to the market's diversity. These segments collectively enhance the market's product variety and cater to different consumer preferences across various regions.
Segment Analysis: Distribution Channel
Off-trade Segment in Global Dairy Desserts Market
The off-trade distribution channel dominates the global dairy desserts market, accounting for approximately 85% of the total market volume in 2024. This channel encompasses supermarkets, hypermarkets, convenience stores, online retail, specialist retailers, and other retail formats. The segment's dominance is attributed to the competitive pricing offered by these outlets, especially in supermarkets and hypermarkets, which can purchase dairy desserts in bulk and pass on the savings to consumers. These retail formats also provide consumers with a wide variety of brands and products, allowing them to compare different options and make informed purchasing decisions. The off-trade channel is also experiencing rapid growth through its online retail segment, which is projected to grow at around 5% annually from 2024 to 2029, driven by increasing consumer preference for convenient shopping options and the expanding e-commerce infrastructure globally.
On-trade Segment in Global Dairy Desserts Market
The on-trade channel, comprising restaurants, cafes, ice cream parlors, and other foodservice outlets, represents a significant segment of the dairy desserts market. This channel serves as a crucial platform for premium and artisanal cream desserts offerings, providing consumers with unique and customized options that are often not available through retail channels. The segment's growth is supported by the increasing trend of out-of-home consumption, with approximately 47% of consumers globally consuming meals at restaurants and 31% ordering from foodservice channels. On-trade establishments often differentiate themselves through unique flavors, premium ingredients, and specialized serving formats, creating experiential value for consumers beyond the product itself.
Dairy Desserts Market Geography Segment Analysis
Dairy Desserts Market in Africa
The African dairy desserts market demonstrates diverse consumption patterns across its key markets, including Egypt, Nigeria, and South Africa. The region's market is characterized by increasing urbanization, rising disposable incomes, and evolving consumer preferences for different dairy desserts varieties. Ice cream dominates the product category across these countries, while there is growing interest in other dairy desserts like cheesecakes and mousses. The market is supported by both domestic production and imports, with major international brands establishing their presence through local partnerships and distribution networks.
Dairy Desserts Market in Egypt
Egypt stands as the dominant force in Africa's dairy desserts market, holding approximately 35% market share in 2024. The country's market is driven by its large population base and strong tradition of dairy-based desserts consumption. Egyptian consumers show a particular preference for ice cream and traditional dairy-based desserts. The market is characterized by a mix of both modern retail formats and traditional distribution channels, with supermarkets and hypermarkets playing an increasingly important role. The country's hot climate contributes to year-round consumption of frozen dairy desserts, while the growing café culture supports the consumption of various dairy desserts varieties.
Dairy Desserts Market Growth in Egypt
Egypt also leads the region in terms of market growth, with an expected growth rate of approximately 4% from 2024 to 2029. This growth is driven by increasing urbanization and the expansion of modern retail formats. The country's dairy desserts industry manufacturers are increasingly focusing on product innovation, introducing new flavors and formats to meet evolving consumer preferences. Health-conscious variants, including low-fat and sugar-free options, are gaining traction among urban consumers. The market is also seeing increased investment in cold chain infrastructure, which is essential for the distribution of dairy desserts.
Dairy Desserts Market in Asia-Pacific
The Asia-Pacific dairy desserts market presents a diverse landscape with varying consumer preferences and consumption patterns across countries, including China, Japan, India, Australia, South Korea, and Malaysia. The region's market is characterized by a strong presence of both international and local players, with significant innovation in flavors and formats. Traditional Asian desserts continue to influence product development, while Western-style dairy desserts gain increasing acceptance. The market benefits from rapid urbanization, rising disposable incomes, and expanding modern retail infrastructure across the region.
Dairy Desserts Market in China
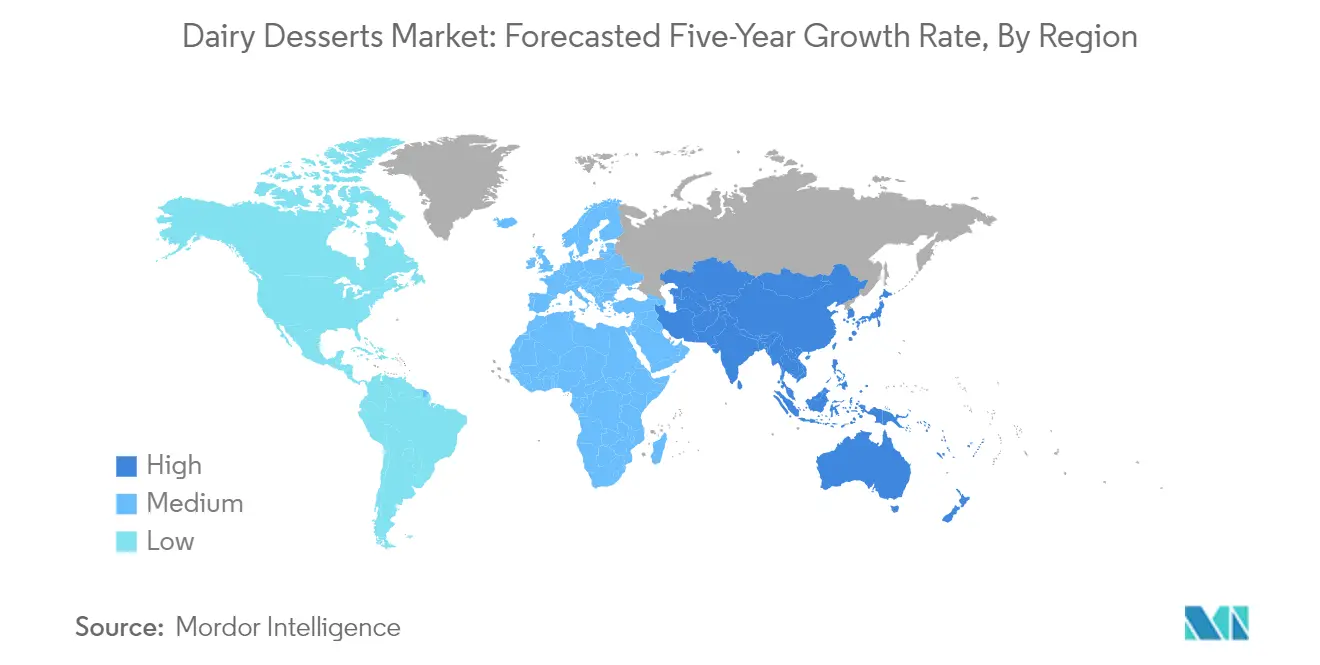
China dominates the Asia-Pacific dairy desserts market, commanding approximately 40% of the regional market share in 2024. The country's massive consumer base and growing middle class drive significant demand for dairy desserts. Chinese consumers show increasing sophistication in their preferences, with premium and innovative products gaining traction. The market is characterized by strong distribution networks, particularly in urban areas, and significant investment in cold chain infrastructure. Health and wellness trends are influencing product development, with manufacturers introducing products with reduced sugar and fat content.
Dairy Desserts Market Growth in India
India emerges as the fastest-growing market in the Asia-Pacific region, with an anticipated growth rate of approximately 9% from 2024 to 2029. The country's market is driven by changing consumer lifestyles, increasing urbanization, and rising disposable incomes. Indian consumers show a strong preference for both traditional dairy-based desserts and modern formats like ice cream. The market is witnessing significant expansion of cold chain infrastructure and modern retail formats. Local flavors and ingredients play a crucial role in product development, with manufacturers incorporating traditional Indian tastes into modern dairy dessert formats.
Dairy Desserts Market in Europe
The European dairy desserts market encompasses a mature and sophisticated landscape across countries, including Germany, France, the UK, Italy, Spain, and others. The region's market is characterized by high product innovation, strong quality standards, and diverse consumer preferences. European consumers show strong appreciation for both traditional and innovative dairy dessert formats. The market benefits from well-established cold chain infrastructure and sophisticated distribution networks.
Dairy Desserts Market in Germany
Germany leads the European dairy desserts market, demonstrating strong consumer demand across all product categories. The country's market is characterized by high quality standards and significant product innovation. German consumers show particular interest in premium and artisanal dairy desserts, with a growing focus on natural ingredients and sustainable production methods. The market benefits from extensive distribution networks and strong retail infrastructure.
Dairy Desserts Market Growth in Turkey
Turkey emerges as the fastest-growing market in Europe, showing remarkable development in its dairy desserts sector. The country's market benefits from its strategic location between Europe and Asia, incorporating influences from both regions in product development. Turkish consumers show strong appreciation for both traditional dairy-based desserts and modern formats. The market is witnessing significant investment in production capacity and distribution infrastructure.
Dairy Desserts Market in Middle East
The Middle Eastern dairy desserts market encompasses diverse markets, including Saudi Arabia, UAE, Kuwait, Qatar, and others. The region's hot climate drives strong demand for frozen dairy desserts, while traditional dairy-based desserts maintain their popularity. Modern retail formats and growing tourism contribute to market development. Saudi Arabia emerges as the largest market in the region, while the UAE shows the fastest growth rate, driven by its cosmopolitan consumer base and strong tourism sector.
Dairy Desserts Market in North America
The North American dairy desserts market, comprising the United States, Canada, and Mexico, demonstrates mature market characteristics with high per capita consumption. The region shows a strong preference for premium products and innovative flavors, with health-conscious alternatives gaining traction. The United States leads the regional market as the largest country, while Mexico shows the fastest growth potential, driven by expanding modern retail infrastructure and changing consumer preferences.
Dairy Desserts Market in South America
The South American dairy desserts market, including Brazil and Argentina, shows strong growth potential driven by increasing disposable incomes and evolving consumer preferences. The region's tropical climate supports year-round consumption of frozen dairy desserts, while traditional dairy-based desserts maintain their popularity. Brazil emerges as both the largest and fastest-growing market in the region, supported by its large population base and developing retail infrastructure.
Get Analysis on Important Geographic Markets
Download PDF
Dairy Desserts Industry Overview
Top Companies in Dairy Desserts Market
The global dairy desserts market is characterized by continuous product innovation and strategic expansion initiatives by major players. Companies are focusing on developing new flavors, healthier variants with reduced sugar and fat content, and premium offerings to cater to evolving consumer preferences. Operational agility is demonstrated through investments in manufacturing facilities, cold chain infrastructure, and distribution networks to ensure product quality and market reach. Strategic moves include partnerships with retail chains, food service operators, and e-commerce platforms to enhance market presence. Companies are also expanding their geographical footprint through acquisitions, joint ventures, and the establishment of new production facilities in emerging markets. The emphasis on sustainable practices, packaging innovations, and digital transformation initiatives further highlights the industry's dynamic nature.
Market Structure Shows Regional and Global Mix
The dairy desserts market exhibits a hybrid competitive structure with both global conglomerates and regional specialists maintaining significant market positions. Global players like Unilever, Nestlé, and Danone leverage their extensive distribution networks, brand portfolios, and research capabilities to maintain market leadership. Regional players such as Gujarat Co-operative Milk Marketing Federation and Inner Mongolia Yili Industrial Group have established a strong local presence through deep market understanding and cultural alignment. The market demonstrates moderate consolidation, with the top players holding significant market share while numerous medium and small-sized companies operate in specific regional markets or specialized product segments.
The industry is witnessing active merger and acquisition activity as companies seek to strengthen their market position and expand their product portfolios. Large companies are acquiring local brands to gain quick access to new markets and consumer segments. Vertical integration strategies are being employed to control supply chains and ensure product quality. Companies are also forming strategic alliances with technology providers and ingredient suppliers to enhance their innovation capabilities and operational efficiency. The market structure is evolving with the entry of new players, particularly in premium and specialized product segments.
Innovation and Distribution Key to Growth
Success in the dairy desserts industry increasingly depends on companies' ability to innovate while maintaining operational efficiency. Incumbents must focus on continuous product development, incorporating healthy ingredients, and introducing novel flavors to maintain their market position. Investment in research and development, along with strong supplier relationships, is crucial for product differentiation. Companies need to optimize their distribution networks, particularly in emerging markets, while strengthening their digital presence to capture the growing e-commerce opportunity. Building strong relationships with retailers and food service operators remains essential for market expansion.
For contenders looking to gain market share, focusing on niche segments and underserved markets presents significant opportunities. Success factors include developing unique value propositions, establishing efficient supply chains, and building strong brand identities. Companies must also prepare for potential regulatory changes regarding ingredient usage, labeling requirements, and sustainability practices. The ability to adapt to changing consumer preferences, particularly regarding health and wellness, will be crucial. Investment in sustainable practices and transparent supply chains will become increasingly important for maintaining competitive advantage in the market. Additionally, the integration of processed dairy products and innovations in ice cream offerings can further drive growth in the dessert industry.
Dairy Desserts Market Leaders
-
Danone SA
-
Inner Mongolia Yili Industrial Group Co. Ltd
-
Nestlé SA
-
Unilever Plc
-
Wells Enterprises Inc.
- *Disclaimer: Major Players sorted in no particular order

Need More Details on Market Players and Competiters?
Download PDF
Dairy Desserts Market News
- October 2022: Blue Ribbon's Street range launched three new two-liter tubs, each featuring two flavors. The range includes chocolate affair, caramel hokey pokey, and velvety caramel.
- July 2022: Wells Enterprises Inc., under its Halo Top brand, launched the New Vanilla Chocolate Twist ice cream in the United States.
- May 2022: Amul launched a variety of Isabgol ice cream flavors. Isabgol, also known as psyllium husk, helps in proper digestion if regularly consumed.
Free With This Report
We provide a comprehensive and exhaustive set of data pointers for global, regional, and country-level metrics that illustrate the fundamentals of the dairy industry. With the help of 45+ free charts, clients can access in-depth market analysis based on per capita consumption numbers and production data of raw materials for dairy, through granular-level segmental information supported by a repository of market data, trends, and expert analysis. Data and analysis on dairy, categories of dairy products, product types, etc., are available in the form of comprehensive reports as well as excel based data worksheets.


Dairy Desserts Market Report - Table of Contents
1. EXECUTIVE SUMMARY & KEY FINDINGS
2. REPORT OFFERS
3. INTRODUCTION
- 3.1 Study Assumptions & Market Definition
- 3.2 Scope of the Study
- 3.3 Research Methodology
4. KEY INDUSTRY TRENDS
- 4.1 Per Capita Consumption
-
4.2 Raw Material/commodity Production
- 4.2.1 Milk
-
4.3 Regulatory Framework
- 4.3.1 Belgium
- 4.3.2 Canada
- 4.3.3 China
- 4.3.4 Mexico
- 4.3.5 United States
- 4.4 Value Chain & Distribution Channel Analysis
5. MARKET SEGMENTATION (includes market size in Value in USD and Volume, Forecasts up to 2030 and analysis of growth prospects)
-
5.1 Product Type
- 5.1.1 Cheesecakes
- 5.1.2 Frozen Desserts
- 5.1.3 Ice Cream
- 5.1.4 Mousses
- 5.1.5 Others
-
5.2 Distribution Channel
- 5.2.1 Off-Trade
- 5.2.1.1 Convenience Stores
- 5.2.1.2 Online Retail
- 5.2.1.3 Specialist Retailers
- 5.2.1.4 Supermarkets and Hypermarkets
- 5.2.1.5 Others (Warehouse clubs, gas stations, etc.)
- 5.2.2 On-Trade
-
5.3 Region
- 5.3.1 Africa
- 5.3.1.1 By Product Type
- 5.3.1.2 By Distribution Channel
- 5.3.1.3 Egypt
- 5.3.1.4 Nigeria
- 5.3.1.5 South Africa
- 5.3.1.6 Rest of Africa
- 5.3.2 Asia-Pacific
- 5.3.2.1 By Product Type
- 5.3.2.2 By Distribution Channel
- 5.3.2.3 Australia
- 5.3.2.4 China
- 5.3.2.5 India
- 5.3.2.6 Indonesia
- 5.3.2.7 Japan
- 5.3.2.8 Malaysia
- 5.3.2.9 New Zealand
- 5.3.2.10 Pakistan
- 5.3.2.11 South Korea
- 5.3.2.12 Rest of Asia Pacific
- 5.3.3 Europe
- 5.3.3.1 By Product Type
- 5.3.3.2 By Distribution Channel
- 5.3.3.3 Belgium
- 5.3.3.4 France
- 5.3.3.5 Germany
- 5.3.3.6 Italy
- 5.3.3.7 Netherlands
- 5.3.3.8 Russia
- 5.3.3.9 Spain
- 5.3.3.10 Turkey
- 5.3.3.11 United Kingdom
- 5.3.3.12 Rest of Europe
- 5.3.4 Middle East
- 5.3.4.1 By Product Type
- 5.3.4.2 By Distribution Channel
- 5.3.4.3 Bahrain
- 5.3.4.4 Iran
- 5.3.4.5 Kuwait
- 5.3.4.6 Oman
- 5.3.4.7 Qatar
- 5.3.4.8 Saudi Arabia
- 5.3.4.9 United Arab Emirates
- 5.3.4.10 Rest of Middle East
- 5.3.5 North America
- 5.3.5.1 By Product Type
- 5.3.5.2 By Distribution Channel
- 5.3.5.3 Canada
- 5.3.5.4 Mexico
- 5.3.5.5 United States
- 5.3.5.6 Rest of North America
- 5.3.6 South America
- 5.3.6.1 By Product Type
- 5.3.6.2 By Distribution Channel
- 5.3.6.3 Argentina
- 5.3.6.4 Brazil
- 5.3.6.5 Rest of South America
6. COMPETITIVE LANDSCAPE
- 6.1 Key Strategic Moves
- 6.2 Market Share Analysis
- 6.3 Company Landscape
-
6.4 Company Profiles (includes Global Level Overview, Market Level Overview, Core Business Segments, Financials, Headcount, Key Information, Market Rank, Market Share, Products and Services, and Analysis of Recent Developments).
- 6.4.1 Cedar Crest Specialties Inc.
- 6.4.2 Danone SA
- 6.4.3 Groupe Lactalis
- 6.4.4 Gujarat Co-operative Milk Marketing Federation Ltd
- 6.4.5 HP Hood LLC
- 6.4.6 Inner Mongolia Yili Industrial Group Co. Ltd
- 6.4.7 Mother Dairy Fruit & Vegetable Pvt. Ltd
- 6.4.8 Nestlé SA
- 6.4.9 Unilever Plc
- 6.4.10 Wells Enterprises Inc.
7. KEY STRATEGIC QUESTIONS FOR DAIRY AND DAIRY ALTERNATIVE CEOS
8. APPENDIX
-
8.1 Global Overview
- 8.1.1 Overview
- 8.1.2 Porter’s Five Forces Framework
- 8.1.3 Global Value Chain Analysis
- 8.1.4 Market Dynamics (DROs)
- 8.2 Sources & References
- 8.3 List of Tables & Figures
- 8.4 Primary Insights
- 8.5 Data Pack
- 8.6 Glossary of Terms
You Can Purchase Parts Of This Report. Check Out Prices For Specific Sections
Get Price Break-up Now
List of Tables & Figures
- Figure 1:
- PER CAPITA CONSUMPTION OF DAIRY DESSERTS, KG, GLOBAL, 2017 - 2029
- Figure 2:
- PRODUCTION OF MILK, METRIC TONNES, GLOBAL, 2017 - 2021
- Figure 3:
- VOLUME OF DAIRY DESSERTS, METRIC TONNES, BY GLOBAL, 2017 - 2029
- Figure 4:
- VALUE OF DAIRY DESSERTS, USD MN, BY GLOBAL, 2017 - 2029
- Figure 5:
- VOLUME OF DAIRY DESSERTS MARKET BY PRODUCT TYPE, METRIC TONNES, GLOBAL, 2017 - 2029
- Figure 6:
- VALUE OF DAIRY DESSERTS MARKET BY PRODUCT TYPE, USD MN, GLOBAL, 2017 - 2029
- Figure 7:
- VOLUME SHARE OF DAIRY DESSERTS MARKET BY PRODUCT TYPE, %, GLOBAL, 2017 VS 2023 VS 2029
- Figure 8:
- VALUE SHARE OF DAIRY DESSERTS MARKET BY PRODUCT TYPE, %, GLOBAL, 2017 VS 2023 VS 2029
- Figure 9:
- VOLUME OF CHEESECAKES MARKET, METRIC TONNES, GLOBAL, 2017 - 2029
- Figure 10:
- VALUE OF CHEESECAKES MARKET, USD MN, GLOBAL, 2017 - 2029
- Figure 11:
- VALUE SHARE OF CHEESECAKES MARKET, BY DISTRIBUTION CHANNEL , %, GLOBAL, 2022 VS 2029
- Figure 12:
- VOLUME OF FROZEN DESSERTS MARKET, METRIC TONNES, GLOBAL, 2017 - 2029
- Figure 13:
- VALUE OF FROZEN DESSERTS MARKET, USD MN, GLOBAL, 2017 - 2029
- Figure 14:
- VALUE SHARE OF FROZEN DESSERTS MARKET, BY DISTRIBUTION CHANNEL , %, GLOBAL, 2022 VS 2029
- Figure 15:
- VOLUME OF ICE CREAM MARKET, METRIC TONNES, GLOBAL, 2017 - 2029
- Figure 16:
- VALUE OF ICE CREAM MARKET, USD MN, GLOBAL, 2017 - 2029
- Figure 17:
- VALUE SHARE OF ICE CREAM MARKET, BY DISTRIBUTION CHANNEL , %, GLOBAL, 2022 VS 2029
- Figure 18:
- VOLUME OF MOUSSES MARKET, METRIC TONNES, GLOBAL, 2017 - 2029
- Figure 19:
- VALUE OF MOUSSES MARKET, USD MN, GLOBAL, 2017 - 2029
- Figure 20:
- VALUE SHARE OF MOUSSES MARKET, BY DISTRIBUTION CHANNEL , %, GLOBAL, 2022 VS 2029
- Figure 21:
- VOLUME OF OTHERS MARKET, METRIC TONNES, GLOBAL, 2017 - 2029
- Figure 22:
- VALUE OF OTHERS MARKET, USD MN, GLOBAL, 2017 - 2029
- Figure 23:
- VALUE SHARE OF OTHERS MARKET, BY DISTRIBUTION CHANNEL , %, GLOBAL, 2022 VS 2029
- Figure 24:
- VOLUME OF DAIRY DESSERTS MARKET BY DISTRIBUTION CHANNEL, METRIC TONNES, GLOBAL, 2017 - 2029
- Figure 25:
- VALUE OF DAIRY DESSERTS MARKET BY DISTRIBUTION CHANNEL, USD MN, GLOBAL, 2017 - 2029
- Figure 26:
- VOLUME SHARE OF DAIRY DESSERTS MARKET, BY DISTRIBUTION CHANNEL , %, GLOBAL, 2017 VS 2023 VS 2029
- Figure 27:
- VALUE SHARE OF DAIRY DESSERTS MARKET, BY DISTRIBUTION CHANNEL , %, GLOBAL, 2017 VS 2023 VS 2029
- Figure 28:
- VOLUME OF DAIRY DESSERTS MARKET BY SUB DISTRIBUTION CHANNELS, METRIC TONNES, GLOBAL, 2017 - 2029
- Figure 29:
- VALUE OF DAIRY DESSERTS MARKET BY SUB DISTRIBUTION CHANNELS, USD MN, GLOBAL, 2017 - 2029
- Figure 30:
- VOLUME SHARE OF DAIRY DESSERTS MARKET, BY SUB DISTRIBUTION CHANNELS , %, GLOBAL, 2017 VS 2023 VS 2029
- Figure 31:
- VALUE SHARE OF DAIRY DESSERTS MARKET, BY SUB DISTRIBUTION CHANNELS , %, GLOBAL, 2017 VS 2023 VS 2029
- Figure 32:
- VOLUME OF DAIRY DESSERTS MARKET SOLD VIA CONVENIENCE STORES, METRIC TONNES, GLOBAL, 2017 - 2029
- Figure 33:
- VALUE OF DAIRY DESSERTS MARKET SOLD VIA CONVENIENCE STORES, USD MN, GLOBAL, 2017 - 2029
- Figure 34:
- VALUE SHARE OF DAIRY DESSERTS MARKET, SOLD VIA CONVENIENCE STORES, BY CATEGORY , %, GLOBAL, 2022 VS 2029
- Figure 35:
- VOLUME OF DAIRY DESSERTS MARKET SOLD VIA ONLINE RETAIL, METRIC TONNES, GLOBAL, 2017 - 2029
- Figure 36:
- VALUE OF DAIRY DESSERTS MARKET SOLD VIA ONLINE RETAIL, USD MN, GLOBAL, 2017 - 2029
- Figure 37:
- VALUE SHARE OF DAIRY DESSERTS MARKET, SOLD VIA ONLINE RETAIL, BY CATEGORY , %, GLOBAL, 2022 VS 2029
- Figure 38:
- VOLUME OF DAIRY DESSERTS MARKET SOLD VIA SPECIALIST RETAILERS, METRIC TONNES, GLOBAL, 2017 - 2029
- Figure 39:
- VALUE OF DAIRY DESSERTS MARKET SOLD VIA SPECIALIST RETAILERS, USD MN, GLOBAL, 2017 - 2029
- Figure 40:
- VALUE SHARE OF DAIRY DESSERTS MARKET, SOLD VIA SPECIALIST RETAILERS, BY CATEGORY , %, GLOBAL, 2022 VS 2029
- Figure 41:
- VOLUME OF DAIRY DESSERTS MARKET SOLD VIA SUPERMARKETS AND HYPERMARKETS, METRIC TONNES, GLOBAL, 2017 - 2029
- Figure 42:
- VALUE OF DAIRY DESSERTS MARKET SOLD VIA SUPERMARKETS AND HYPERMARKETS, USD MN, GLOBAL, 2017 - 2029
- Figure 43:
- VALUE SHARE OF DAIRY DESSERTS MARKET, SOLD VIA SUPERMARKETS AND HYPERMARKETS, BY CATEGORY , %, GLOBAL, 2022 VS 2029
- Figure 44:
- VOLUME OF DAIRY DESSERTS MARKET SOLD VIA OTHERS (WAREHOUSE CLUBS, GAS STATIONS, ETC.), METRIC TONNES, GLOBAL, 2017 - 2029
- Figure 45:
- VALUE OF DAIRY DESSERTS MARKET SOLD VIA OTHERS (WAREHOUSE CLUBS, GAS STATIONS, ETC.), USD MN, GLOBAL, 2017 - 2029
- Figure 46:
- VALUE SHARE OF DAIRY DESSERTS MARKET, SOLD VIA OTHERS (WAREHOUSE CLUBS, GAS STATIONS, ETC.), BY CATEGORY , %, GLOBAL, 2022 VS 2029
- Figure 47:
- VOLUME OF DAIRY DESSERTS MARKET SOLD VIA ON-TRADE, METRIC TONNES, GLOBAL, 2017 - 2029
- Figure 48:
- VALUE OF DAIRY DESSERTS MARKET SOLD VIA ON-TRADE, USD MN, GLOBAL, 2017 - 2029
- Figure 49:
- VALUE SHARE OF DAIRY DESSERTS MARKET, SOLD VIA ON-TRADE, BY CATEGORY , %, GLOBAL, 2022 VS 2029
- Figure 50:
- VOLUME OF DAIRY DESSERTS MARKET BY REGION, METRIC TONNES, GLOBAL, 2017 - 2029
- Figure 51:
- VALUE OF DAIRY DESSERTS MARKET BY REGION, USD MN, GLOBAL, 2017 - 2029
- Figure 52:
- VOLUME SHARE OF DAIRY DESSERTS MARKET, BY REGION , %, GLOBAL, 2017 VS 2023 VS 2029
- Figure 53:
- VALUE SHARE OF DAIRY DESSERTS MARKET, BY REGION , %, GLOBAL, 2017 VS 2023 VS 2029
- Figure 54:
- VOLUME OF DAIRY DESSERTS MARKET BY PRODUCT TYPE, METRIC TONNES, GLOBAL, 2017 - 2029
- Figure 55:
- VALUE OF DAIRY DESSERTS MARKET BY PRODUCT TYPE, USD MN, GLOBAL, 2017 - 2029
- Figure 56:
- VOLUME SHARE OF DAIRY DESSERTS MARKET BY PRODUCT TYPE, %, GLOBAL, 2017 VS 2023 VS 2029
- Figure 57:
- VALUE SHARE OF DAIRY DESSERTS MARKET BY PRODUCT TYPE, %, GLOBAL, 2017 VS 2023 VS 2029
- Figure 58:
- VOLUME OF DAIRY DESSERTS MARKET BY DISTRIBUTION CHANNEL, METRIC TONNES, AFRICA, 2017 - 2029
- Figure 59:
- VALUE OF DAIRY DESSERTS MARKET BY DISTRIBUTION CHANNEL, USD MN, AFRICA, 2017 - 2029
- Figure 60:
- VOLUME SHARE OF DAIRY DESSERTS MARKET, BY DISTRIBUTION CHANNEL , %, AFRICA, 2017 VS 2023 VS 2029
- Figure 61:
- VALUE SHARE OF DAIRY DESSERTS MARKET, BY DISTRIBUTION CHANNEL , %, AFRICA, 2017 VS 2023 VS 2029
- Figure 62:
- VOLUME OF DAIRY DESSERTS MARKET BY COUNTRY, METRIC TONNES, AFRICA, 2017 - 2029
- Figure 63:
- VALUE OF DAIRY DESSERTS MARKET BY COUNTRY, USD MN, AFRICA, 2017 - 2029
- Figure 64:
- VOLUME SHARE OF DAIRY DESSERTS MARKET, BY COUNTRY , %, AFRICA, 2017 VS 2023 VS 2029
- Figure 65:
- VALUE SHARE OF DAIRY DESSERTS MARKET, BY COUNTRY , %, AFRICA, 2017 VS 2023 VS 2029
- Figure 66:
- VOLUME OF DAIRY DESSERTS MARKET, METRIC TONNES, EGYPT, 2017 - 2029
- Figure 67:
- VALUE OF DAIRY DESSERTS MARKET, USD MN, EGYPT, 2017 - 2029
- Figure 68:
- VALUE SHARE OF DAIRY DESSERTS MARKET, BY PRODUCT TYPE , %, EGYPT, GLOBAL, 2022 VS 2029
- Figure 69:
- VOLUME OF DAIRY DESSERTS MARKET, METRIC TONNES, NIGERIA, 2017 - 2029
- Figure 70:
- VALUE OF DAIRY DESSERTS MARKET, USD MN, NIGERIA, 2017 - 2029
- Figure 71:
- VALUE SHARE OF DAIRY DESSERTS MARKET, BY PRODUCT TYPE , %, NIGERIA, GLOBAL, 2022 VS 2029
- Figure 72:
- VOLUME OF DAIRY DESSERTS MARKET, METRIC TONNES, SOUTH AFRICA, 2017 - 2029
- Figure 73:
- VALUE OF DAIRY DESSERTS MARKET, USD MN, SOUTH AFRICA, 2017 - 2029
- Figure 74:
- VALUE SHARE OF DAIRY DESSERTS MARKET, BY PRODUCT TYPE , %, SOUTH AFRICA, GLOBAL, 2022 VS 2029
- Figure 75:
- VOLUME OF DAIRY DESSERTS MARKET, METRIC TONNES, REST OF AFRICA, 2017 - 2029
- Figure 76:
- VALUE OF DAIRY DESSERTS MARKET, USD MN, REST OF AFRICA, 2017 - 2029
- Figure 77:
- VALUE SHARE OF DAIRY DESSERTS MARKET, BY PRODUCT TYPE , %, REST OF AFRICA, GLOBAL, 2022 VS 2029
- Figure 78:
- VOLUME OF DAIRY DESSERTS MARKET BY PRODUCT TYPE, METRIC TONNES, GLOBAL, 2017 - 2029
- Figure 79:
- VALUE OF DAIRY DESSERTS MARKET BY PRODUCT TYPE, USD MN, GLOBAL, 2017 - 2029
- Figure 80:
- VOLUME SHARE OF DAIRY DESSERTS MARKET BY PRODUCT TYPE, %, GLOBAL, 2017 VS 2023 VS 2029
- Figure 81:
- VALUE SHARE OF DAIRY DESSERTS MARKET BY PRODUCT TYPE, %, GLOBAL, 2017 VS 2023 VS 2029
- Figure 82:
- VOLUME OF DAIRY DESSERTS MARKET BY DISTRIBUTION CHANNEL, METRIC TONNES, ASIA-PACIFIC, 2017 - 2029
- Figure 83:
- VALUE OF DAIRY DESSERTS MARKET BY DISTRIBUTION CHANNEL, USD MN, ASIA-PACIFIC, 2017 - 2029
- Figure 84:
- VOLUME SHARE OF DAIRY DESSERTS MARKET, BY DISTRIBUTION CHANNEL , %, ASIA-PACIFIC, 2017 VS 2023 VS 2029
- Figure 85:
- VALUE SHARE OF DAIRY DESSERTS MARKET, BY DISTRIBUTION CHANNEL , %, ASIA-PACIFIC, 2017 VS 2023 VS 2029
- Figure 86:
- VOLUME OF DAIRY DESSERTS MARKET BY COUNTRY, METRIC TONNES, ASIA-PACIFIC, 2017 - 2029
- Figure 87:
- VALUE OF DAIRY DESSERTS MARKET BY COUNTRY, USD MN, ASIA-PACIFIC, 2017 - 2029
- Figure 88:
- VOLUME SHARE OF DAIRY DESSERTS MARKET, BY COUNTRY , %, ASIA-PACIFIC, 2017 VS 2023 VS 2029
- Figure 89:
- VALUE SHARE OF DAIRY DESSERTS MARKET, BY COUNTRY , %, ASIA-PACIFIC, 2017 VS 2023 VS 2029
- Figure 90:
- VOLUME OF DAIRY DESSERTS MARKET, METRIC TONNES, AUSTRALIA, 2017 - 2029
- Figure 91:
- VALUE OF DAIRY DESSERTS MARKET, USD MN, AUSTRALIA, 2017 - 2029
- Figure 92:
- VALUE SHARE OF DAIRY DESSERTS MARKET, BY PRODUCT TYPE , %, AUSTRALIA, GLOBAL, 2022 VS 2029
- Figure 93:
- VOLUME OF DAIRY DESSERTS MARKET, METRIC TONNES, CHINA, 2017 - 2029
- Figure 94:
- VALUE OF DAIRY DESSERTS MARKET, USD MN, CHINA, 2017 - 2029
- Figure 95:
- VALUE SHARE OF DAIRY DESSERTS MARKET, BY PRODUCT TYPE , %, CHINA, GLOBAL, 2022 VS 2029
- Figure 96:
- VOLUME OF DAIRY DESSERTS MARKET, METRIC TONNES, INDIA, 2017 - 2029
- Figure 97:
- VALUE OF DAIRY DESSERTS MARKET, USD MN, INDIA, 2017 - 2029
- Figure 98:
- VALUE SHARE OF DAIRY DESSERTS MARKET, BY PRODUCT TYPE , %, INDIA, GLOBAL, 2022 VS 2029
- Figure 99:
- VOLUME OF DAIRY DESSERTS MARKET, METRIC TONNES, INDONESIA, 2017 - 2029
- Figure 100:
- VALUE OF DAIRY DESSERTS MARKET, USD MN, INDONESIA, 2017 - 2029
- Figure 101:
- VALUE SHARE OF DAIRY DESSERTS MARKET, BY PRODUCT TYPE , %, INDONESIA, GLOBAL, 2022 VS 2029
- Figure 102:
- VOLUME OF DAIRY DESSERTS MARKET, METRIC TONNES, JAPAN, 2017 - 2029
- Figure 103:
- VALUE OF DAIRY DESSERTS MARKET, USD MN, JAPAN, 2017 - 2029
- Figure 104:
- VALUE SHARE OF DAIRY DESSERTS MARKET, BY PRODUCT TYPE , %, JAPAN, GLOBAL, 2022 VS 2029
- Figure 105:
- VOLUME OF DAIRY DESSERTS MARKET, METRIC TONNES, MALAYSIA, 2017 - 2029
- Figure 106:
- VALUE OF DAIRY DESSERTS MARKET, USD MN, MALAYSIA, 2017 - 2029
- Figure 107:
- VALUE SHARE OF DAIRY DESSERTS MARKET, BY PRODUCT TYPE , %, MALAYSIA, GLOBAL, 2022 VS 2029
- Figure 108:
- VOLUME OF DAIRY DESSERTS MARKET, METRIC TONNES, NEW ZEALAND, 2017 - 2029
- Figure 109:
- VALUE OF DAIRY DESSERTS MARKET, USD MN, NEW ZEALAND, 2017 - 2029
- Figure 110:
- VALUE SHARE OF DAIRY DESSERTS MARKET, BY PRODUCT TYPE , %, NEW ZEALAND, GLOBAL, 2022 VS 2029
- Figure 111:
- VOLUME OF DAIRY DESSERTS MARKET, METRIC TONNES, PAKISTAN, 2017 - 2029
- Figure 112:
- VALUE OF DAIRY DESSERTS MARKET, USD MN, PAKISTAN, 2017 - 2029
- Figure 113:
- VALUE SHARE OF DAIRY DESSERTS MARKET, BY PRODUCT TYPE , %, PAKISTAN, GLOBAL, 2022 VS 2029
- Figure 114:
- VOLUME OF DAIRY DESSERTS MARKET, METRIC TONNES, SOUTH KOREA, 2017 - 2029
- Figure 115:
- VALUE OF DAIRY DESSERTS MARKET, USD MN, SOUTH KOREA, 2017 - 2029
- Figure 116:
- VALUE SHARE OF DAIRY DESSERTS MARKET, BY PRODUCT TYPE , %, SOUTH KOREA, GLOBAL, 2022 VS 2029
- Figure 117:
- VOLUME OF DAIRY DESSERTS MARKET, METRIC TONNES, REST OF ASIA PACIFIC, 2017 - 2029
- Figure 118:
- VALUE OF DAIRY DESSERTS MARKET, USD MN, REST OF ASIA PACIFIC, 2017 - 2029
- Figure 119:
- VALUE SHARE OF DAIRY DESSERTS MARKET, BY PRODUCT TYPE , %, REST OF ASIA PACIFIC, GLOBAL, 2022 VS 2029
- Figure 120:
- VOLUME OF DAIRY DESSERTS MARKET BY PRODUCT TYPE, METRIC TONNES, GLOBAL, 2017 - 2029
- Figure 121:
- VALUE OF DAIRY DESSERTS MARKET BY PRODUCT TYPE, USD MN, GLOBAL, 2017 - 2029
- Figure 122:
- VOLUME SHARE OF DAIRY DESSERTS MARKET BY PRODUCT TYPE, %, GLOBAL, 2017 VS 2023 VS 2029
- Figure 123:
- VALUE SHARE OF DAIRY DESSERTS MARKET BY PRODUCT TYPE, %, GLOBAL, 2017 VS 2023 VS 2029
- Figure 124:
- VOLUME OF DAIRY DESSERTS MARKET BY DISTRIBUTION CHANNEL, METRIC TONNES, EUROPE, 2017 - 2029
- Figure 125:
- VALUE OF DAIRY DESSERTS MARKET BY DISTRIBUTION CHANNEL, USD MN, EUROPE, 2017 - 2029
- Figure 126:
- VOLUME SHARE OF DAIRY DESSERTS MARKET, BY DISTRIBUTION CHANNEL , %, EUROPE, 2017 VS 2023 VS 2029
- Figure 127:
- VALUE SHARE OF DAIRY DESSERTS MARKET, BY DISTRIBUTION CHANNEL , %, EUROPE, 2017 VS 2023 VS 2029
- Figure 128:
- VOLUME OF DAIRY DESSERTS MARKET BY COUNTRY, METRIC TONNES, EUROPE, 2017 - 2029
- Figure 129:
- VALUE OF DAIRY DESSERTS MARKET BY COUNTRY, USD MN, EUROPE, 2017 - 2029
- Figure 130:
- VOLUME SHARE OF DAIRY DESSERTS MARKET, BY COUNTRY , %, EUROPE, 2017 VS 2023 VS 2029
- Figure 131:
- VALUE SHARE OF DAIRY DESSERTS MARKET, BY COUNTRY , %, EUROPE, 2017 VS 2023 VS 2029
- Figure 132:
- VOLUME OF DAIRY DESSERTS MARKET, METRIC TONNES, BELGIUM, 2017 - 2029
- Figure 133:
- VALUE OF DAIRY DESSERTS MARKET, USD MN, BELGIUM, 2017 - 2029
- Figure 134:
- VALUE SHARE OF DAIRY DESSERTS MARKET, BY PRODUCT TYPE , %, BELGIUM, GLOBAL, 2022 VS 2029
- Figure 135:
- VOLUME OF DAIRY DESSERTS MARKET, METRIC TONNES, FRANCE, 2017 - 2029
- Figure 136:
- VALUE OF DAIRY DESSERTS MARKET, USD MN, FRANCE, 2017 - 2029
- Figure 137:
- VALUE SHARE OF DAIRY DESSERTS MARKET, BY PRODUCT TYPE , %, FRANCE, GLOBAL, 2022 VS 2029
- Figure 138:
- VOLUME OF DAIRY DESSERTS MARKET, METRIC TONNES, GERMANY, 2017 - 2029
- Figure 139:
- VALUE OF DAIRY DESSERTS MARKET, USD MN, GERMANY, 2017 - 2029
- Figure 140:
- VALUE SHARE OF DAIRY DESSERTS MARKET, BY PRODUCT TYPE , %, GERMANY, GLOBAL, 2022 VS 2029
- Figure 141:
- VOLUME OF DAIRY DESSERTS MARKET, METRIC TONNES, ITALY, 2017 - 2029
- Figure 142:
- VALUE OF DAIRY DESSERTS MARKET, USD MN, ITALY, 2017 - 2029
- Figure 143:
- VALUE SHARE OF DAIRY DESSERTS MARKET, BY PRODUCT TYPE , %, ITALY, GLOBAL, 2022 VS 2029
- Figure 144:
- VOLUME OF DAIRY DESSERTS MARKET, METRIC TONNES, NETHERLANDS, 2017 - 2029
- Figure 145:
- VALUE OF DAIRY DESSERTS MARKET, USD MN, NETHERLANDS, 2017 - 2029
- Figure 146:
- VALUE SHARE OF DAIRY DESSERTS MARKET, BY PRODUCT TYPE , %, NETHERLANDS, GLOBAL, 2022 VS 2029
- Figure 147:
- VOLUME OF DAIRY DESSERTS MARKET, METRIC TONNES, RUSSIA, 2017 - 2029
- Figure 148:
- VALUE OF DAIRY DESSERTS MARKET, USD MN, RUSSIA, 2017 - 2029
- Figure 149:
- VALUE SHARE OF DAIRY DESSERTS MARKET, BY PRODUCT TYPE , %, RUSSIA, GLOBAL, 2022 VS 2029
- Figure 150:
- VOLUME OF DAIRY DESSERTS MARKET, METRIC TONNES, SPAIN, 2017 - 2029
- Figure 151:
- VALUE OF DAIRY DESSERTS MARKET, USD MN, SPAIN, 2017 - 2029
- Figure 152:
- VALUE SHARE OF DAIRY DESSERTS MARKET, BY PRODUCT TYPE , %, SPAIN, GLOBAL, 2022 VS 2029
- Figure 153:
- VOLUME OF DAIRY DESSERTS MARKET, METRIC TONNES, TURKEY, 2017 - 2029
- Figure 154:
- VALUE OF DAIRY DESSERTS MARKET, USD MN, TURKEY, 2017 - 2029
- Figure 155:
- VALUE SHARE OF DAIRY DESSERTS MARKET, BY PRODUCT TYPE , %, TURKEY, GLOBAL, 2022 VS 2029
- Figure 156:
- VOLUME OF DAIRY DESSERTS MARKET, METRIC TONNES, UNITED KINGDOM, 2017 - 2029
- Figure 157:
- VALUE OF DAIRY DESSERTS MARKET, USD MN, UNITED KINGDOM, 2017 - 2029
- Figure 158:
- VALUE SHARE OF DAIRY DESSERTS MARKET, BY PRODUCT TYPE , %, UNITED KINGDOM, GLOBAL, 2022 VS 2029
- Figure 159:
- VOLUME OF DAIRY DESSERTS MARKET, METRIC TONNES, REST OF EUROPE, 2017 - 2029
- Figure 160:
- VALUE OF DAIRY DESSERTS MARKET, USD MN, REST OF EUROPE, 2017 - 2029
- Figure 161:
- VALUE SHARE OF DAIRY DESSERTS MARKET, BY PRODUCT TYPE , %, REST OF EUROPE, GLOBAL, 2022 VS 2029
- Figure 162:
- VOLUME OF DAIRY DESSERTS MARKET BY PRODUCT TYPE, METRIC TONNES, GLOBAL, 2017 - 2029
- Figure 163:
- VALUE OF DAIRY DESSERTS MARKET BY PRODUCT TYPE, USD MN, GLOBAL, 2017 - 2029
- Figure 164:
- VOLUME SHARE OF DAIRY DESSERTS MARKET BY PRODUCT TYPE, %, GLOBAL, 2017 VS 2023 VS 2029
- Figure 165:
- VALUE SHARE OF DAIRY DESSERTS MARKET BY PRODUCT TYPE, %, GLOBAL, 2017 VS 2023 VS 2029
- Figure 166:
- VOLUME OF DAIRY DESSERTS MARKET BY DISTRIBUTION CHANNEL, METRIC TONNES, MIDDLE EAST, 2017 - 2029
- Figure 167:
- VALUE OF DAIRY DESSERTS MARKET BY DISTRIBUTION CHANNEL, USD MN, MIDDLE EAST, 2017 - 2029
- Figure 168:
- VOLUME SHARE OF DAIRY DESSERTS MARKET, BY DISTRIBUTION CHANNEL , %, MIDDLE EAST, 2017 VS 2023 VS 2029
- Figure 169:
- VALUE SHARE OF DAIRY DESSERTS MARKET, BY DISTRIBUTION CHANNEL , %, MIDDLE EAST, 2017 VS 2023 VS 2029
- Figure 170:
- VOLUME OF DAIRY DESSERTS MARKET BY COUNTRY, METRIC TONNES, MIDDLE EAST, 2017 - 2029
- Figure 171:
- VALUE OF DAIRY DESSERTS MARKET BY COUNTRY, USD MN, MIDDLE EAST, 2017 - 2029
- Figure 172:
- VOLUME SHARE OF DAIRY DESSERTS MARKET, BY COUNTRY , %, MIDDLE EAST, 2017 VS 2023 VS 2029
- Figure 173:
- VALUE SHARE OF DAIRY DESSERTS MARKET, BY COUNTRY , %, MIDDLE EAST, 2017 VS 2023 VS 2029
- Figure 174:
- VOLUME OF DAIRY DESSERTS MARKET, METRIC TONNES, BAHRAIN, 2017 - 2029
- Figure 175:
- VALUE OF DAIRY DESSERTS MARKET, USD MN, BAHRAIN, 2017 - 2029
- Figure 176:
- VALUE SHARE OF DAIRY DESSERTS MARKET, BY PRODUCT TYPE , %, BAHRAIN, GLOBAL, 2022 VS 2029
- Figure 177:
- VOLUME OF DAIRY DESSERTS MARKET, METRIC TONNES, IRAN, 2017 - 2029
- Figure 178:
- VALUE OF DAIRY DESSERTS MARKET, USD MN, IRAN, 2017 - 2029
- Figure 179:
- VALUE SHARE OF DAIRY DESSERTS MARKET, BY PRODUCT TYPE , %, IRAN, GLOBAL, 2022 VS 2029
- Figure 180:
- VOLUME OF DAIRY DESSERTS MARKET, METRIC TONNES, KUWAIT, 2017 - 2029
- Figure 181:
- VALUE OF DAIRY DESSERTS MARKET, USD MN, KUWAIT, 2017 - 2029
- Figure 182:
- VALUE SHARE OF DAIRY DESSERTS MARKET, BY PRODUCT TYPE , %, KUWAIT, GLOBAL, 2022 VS 2029
- Figure 183:
- VOLUME OF DAIRY DESSERTS MARKET, METRIC TONNES, OMAN, 2017 - 2029
- Figure 184:
- VALUE OF DAIRY DESSERTS MARKET, USD MN, OMAN, 2017 - 2029
- Figure 185:
- VALUE SHARE OF DAIRY DESSERTS MARKET, BY PRODUCT TYPE , %, OMAN, GLOBAL, 2022 VS 2029
- Figure 186:
- VOLUME OF DAIRY DESSERTS MARKET, METRIC TONNES, QATAR, 2017 - 2029
- Figure 187:
- VALUE OF DAIRY DESSERTS MARKET, USD MN, QATAR, 2017 - 2029
- Figure 188:
- VALUE SHARE OF DAIRY DESSERTS MARKET, BY PRODUCT TYPE , %, QATAR, GLOBAL, 2022 VS 2029
- Figure 189:
- VOLUME OF DAIRY DESSERTS MARKET, METRIC TONNES, SAUDI ARABIA, 2017 - 2029
- Figure 190:
- VALUE OF DAIRY DESSERTS MARKET, USD MN, SAUDI ARABIA, 2017 - 2029
- Figure 191:
- VALUE SHARE OF DAIRY DESSERTS MARKET, BY PRODUCT TYPE , %, SAUDI ARABIA, GLOBAL, 2022 VS 2029
- Figure 192:
- VOLUME OF DAIRY DESSERTS MARKET, METRIC TONNES, UNITED ARAB EMIRATES, 2017 - 2029
- Figure 193:
- VALUE OF DAIRY DESSERTS MARKET, USD MN, UNITED ARAB EMIRATES, 2017 - 2029
- Figure 194:
- VALUE SHARE OF DAIRY DESSERTS MARKET, BY PRODUCT TYPE , %, UNITED ARAB EMIRATES, GLOBAL, 2022 VS 2029
- Figure 195:
- VOLUME OF DAIRY DESSERTS MARKET, METRIC TONNES, REST OF MIDDLE EAST, 2017 - 2029
- Figure 196:
- VALUE OF DAIRY DESSERTS MARKET, USD MN, REST OF MIDDLE EAST, 2017 - 2029
- Figure 197:
- VALUE SHARE OF DAIRY DESSERTS MARKET, BY PRODUCT TYPE , %, REST OF MIDDLE EAST, GLOBAL, 2022 VS 2029
- Figure 198:
- VOLUME OF DAIRY DESSERTS MARKET BY PRODUCT TYPE, METRIC TONNES, GLOBAL, 2017 - 2029
- Figure 199:
- VALUE OF DAIRY DESSERTS MARKET BY PRODUCT TYPE, USD MN, GLOBAL, 2017 - 2029
- Figure 200:
- VOLUME SHARE OF DAIRY DESSERTS MARKET BY PRODUCT TYPE, %, GLOBAL, 2017 VS 2023 VS 2029
- Figure 201:
- VALUE SHARE OF DAIRY DESSERTS MARKET BY PRODUCT TYPE, %, GLOBAL, 2017 VS 2023 VS 2029
- Figure 202:
- VOLUME OF DAIRY DESSERTS MARKET BY DISTRIBUTION CHANNEL, METRIC TONNES, NORTH AMERICA, 2017 - 2029
- Figure 203:
- VALUE OF DAIRY DESSERTS MARKET BY DISTRIBUTION CHANNEL, USD MN, NORTH AMERICA, 2017 - 2029
- Figure 204:
- VOLUME SHARE OF DAIRY DESSERTS MARKET, BY DISTRIBUTION CHANNEL , %, NORTH AMERICA, 2017 VS 2023 VS 2029
- Figure 205:
- VALUE SHARE OF DAIRY DESSERTS MARKET, BY DISTRIBUTION CHANNEL , %, NORTH AMERICA, 2017 VS 2023 VS 2029
- Figure 206:
- VOLUME OF DAIRY DESSERTS MARKET BY COUNTRY, METRIC TONNES, NORTH AMERICA, 2017 - 2029
- Figure 207:
- VALUE OF DAIRY DESSERTS MARKET BY COUNTRY, USD MN, NORTH AMERICA, 2017 - 2029
- Figure 208:
- VOLUME SHARE OF DAIRY DESSERTS MARKET, BY COUNTRY , %, NORTH AMERICA, 2017 VS 2023 VS 2029
- Figure 209:
- VALUE SHARE OF DAIRY DESSERTS MARKET, BY COUNTRY , %, NORTH AMERICA, 2017 VS 2023 VS 2029
- Figure 210:
- VOLUME OF DAIRY DESSERTS MARKET, METRIC TONNES, CANADA, 2017 - 2029
- Figure 211:
- VALUE OF DAIRY DESSERTS MARKET, USD MN, CANADA, 2017 - 2029
- Figure 212:
- VALUE SHARE OF DAIRY DESSERTS MARKET, BY PRODUCT TYPE , %, CANADA, GLOBAL, 2022 VS 2029
- Figure 213:
- VOLUME OF DAIRY DESSERTS MARKET, METRIC TONNES, MEXICO, 2017 - 2029
- Figure 214:
- VALUE OF DAIRY DESSERTS MARKET, USD MN, MEXICO, 2017 - 2029
- Figure 215:
- VALUE SHARE OF DAIRY DESSERTS MARKET, BY PRODUCT TYPE , %, MEXICO, GLOBAL, 2022 VS 2029
- Figure 216:
- VOLUME OF DAIRY DESSERTS MARKET, METRIC TONNES, UNITED STATES, 2017 - 2029
- Figure 217:
- VALUE OF DAIRY DESSERTS MARKET, USD MN, UNITED STATES, 2017 - 2029
- Figure 218:
- VALUE SHARE OF DAIRY DESSERTS MARKET, BY PRODUCT TYPE , %, UNITED STATES, GLOBAL, 2022 VS 2029
- Figure 219:
- VOLUME OF DAIRY DESSERTS MARKET, METRIC TONNES, REST OF NORTH AMERICA, 2017 - 2029
- Figure 220:
- VALUE OF DAIRY DESSERTS MARKET, USD MN, REST OF NORTH AMERICA, 2017 - 2029
- Figure 221:
- VALUE SHARE OF DAIRY DESSERTS MARKET, BY PRODUCT TYPE , %, REST OF NORTH AMERICA, GLOBAL, 2022 VS 2029
- Figure 222:
- VOLUME OF DAIRY DESSERTS MARKET BY PRODUCT TYPE, METRIC TONNES, GLOBAL, 2017 - 2029
- Figure 223:
- VALUE OF DAIRY DESSERTS MARKET BY PRODUCT TYPE, USD MN, GLOBAL, 2017 - 2029
- Figure 224:
- VOLUME SHARE OF DAIRY DESSERTS MARKET BY PRODUCT TYPE, %, GLOBAL, 2017 VS 2023 VS 2029
- Figure 225:
- VALUE SHARE OF DAIRY DESSERTS MARKET BY PRODUCT TYPE, %, GLOBAL, 2017 VS 2023 VS 2029
- Figure 226:
- VOLUME OF DAIRY DESSERTS MARKET BY DISTRIBUTION CHANNEL, METRIC TONNES, SOUTH AMERICA, 2017 - 2029
- Figure 227:
- VALUE OF DAIRY DESSERTS MARKET BY DISTRIBUTION CHANNEL, USD MN, SOUTH AMERICA, 2017 - 2029
- Figure 228:
- VOLUME SHARE OF DAIRY DESSERTS MARKET, BY DISTRIBUTION CHANNEL , %, SOUTH AMERICA, 2017 VS 2023 VS 2029
- Figure 229:
- VALUE SHARE OF DAIRY DESSERTS MARKET, BY DISTRIBUTION CHANNEL , %, SOUTH AMERICA, 2017 VS 2023 VS 2029
- Figure 230:
- VOLUME OF DAIRY DESSERTS MARKET BY COUNTRY, METRIC TONNES, SOUTH AMERICA, 2017 - 2029
- Figure 231:
- VALUE OF DAIRY DESSERTS MARKET BY COUNTRY, USD MN, SOUTH AMERICA, 2017 - 2029
- Figure 232:
- VOLUME SHARE OF DAIRY DESSERTS MARKET, BY COUNTRY , %, SOUTH AMERICA, 2017 VS 2023 VS 2029
- Figure 233:
- VALUE SHARE OF DAIRY DESSERTS MARKET, BY COUNTRY , %, SOUTH AMERICA, 2017 VS 2023 VS 2029
- Figure 234:
- VOLUME OF DAIRY DESSERTS MARKET, METRIC TONNES, ARGENTINA, 2017 - 2029
- Figure 235:
- VALUE OF DAIRY DESSERTS MARKET, USD MN, ARGENTINA, 2017 - 2029
- Figure 236:
- VALUE SHARE OF DAIRY DESSERTS MARKET, BY PRODUCT TYPE , %, ARGENTINA, GLOBAL, 2022 VS 2029
- Figure 237:
- VOLUME OF DAIRY DESSERTS MARKET, METRIC TONNES, BRAZIL, 2017 - 2029
- Figure 238:
- VALUE OF DAIRY DESSERTS MARKET, USD MN, BRAZIL, 2017 - 2029
- Figure 239:
- VALUE SHARE OF DAIRY DESSERTS MARKET, BY PRODUCT TYPE , %, BRAZIL, GLOBAL, 2022 VS 2029
- Figure 240:
- VOLUME OF DAIRY DESSERTS MARKET, METRIC TONNES, REST OF SOUTH AMERICA, 2017 - 2029
- Figure 241:
- VALUE OF DAIRY DESSERTS MARKET, USD MN, REST OF SOUTH AMERICA, 2017 - 2029
- Figure 242:
- VALUE SHARE OF DAIRY DESSERTS MARKET, BY PRODUCT TYPE , %, REST OF SOUTH AMERICA, GLOBAL, 2022 VS 2029
- Figure 243:
- MOST ACTIVE COMPANIES BY NUMBER OF STRATEGIC MOVES, COUNT, GLOBAL, 2017 - 2029
- Figure 244:
- MOST ADOPTED STRATEGIES, COUNT, GLOBAL, 2017 - 2029
- Figure 245:
- VALUE SHARE OF MAJOR PLAYERS, %, GLOBAL
Dairy Desserts Industry Segmentation
Cheesecakes, Frozen Desserts, Ice Cream, Mousses, Others are covered as segments by Product Type. Off-Trade, On-Trade are covered as segments by Distribution Channel. Africa, Asia-Pacific, Europe, Middle East, North America, South America are covered as segments by Region.| Product Type | Cheesecakes | ||
| Frozen Desserts | |||
| Ice Cream | |||
| Mousses | |||
| Others | |||
| Distribution Channel | Off-Trade | Convenience Stores | |
| Online Retail | |||
| Specialist Retailers | |||
| Supermarkets and Hypermarkets | |||
| Others (Warehouse clubs, gas stations, etc.) | |||
| On-Trade | |||
| Region | Africa | By Product Type | |
| By Distribution Channel | |||
| Egypt | |||
| Nigeria | |||
| South Africa | |||
| Rest of Africa | |||
| Asia-Pacific | By Product Type | ||
| By Distribution Channel | |||
| Australia | |||
| China | |||
| India | |||
| Indonesia | |||
| Japan | |||
| Malaysia | |||
| New Zealand | |||
| Pakistan | |||
| South Korea | |||
| Rest of Asia Pacific | |||
| Europe | By Product Type | ||
| By Distribution Channel | |||
| Belgium | |||
| France | |||
| Germany | |||
| Italy | |||
| Netherlands | |||
| Russia | |||
| Spain | |||
| Turkey | |||
| United Kingdom | |||
| Rest of Europe | |||
| Middle East | By Product Type | ||
| By Distribution Channel | |||
| Bahrain | |||
| Iran | |||
| Kuwait | |||
| Oman | |||
| Qatar | |||
| Saudi Arabia | |||
| United Arab Emirates | |||
| Rest of Middle East | |||
| North America | By Product Type | ||
| By Distribution Channel | |||
| Canada | |||
| Mexico | |||
| United States | |||
| Rest of North America | |||
| South America | By Product Type | ||
| By Distribution Channel | |||
| Argentina | |||
| Brazil | |||
| Rest of South America | |||
Need A Different Region or Segment?
Customize Now
Market Definition
- Butter - Butter is a yellow-to-white solid emulsion of fat globules, water, and inorganic salts produced by churning the cream from cows’ milk
- Dairy - Dairy product include milk and any of the foods made from milk, including butter, cheese, ice cream, yogurt, and condensed and dried milk.
- Frozen Desserts - Frozen dairy dessert means and includes products containing milk or cream and other ingredients which are frozen or semi-frozen prior to consumption, such as ice milk or sherbet, including frozen dairy desserts for special dietary purposes, and sorbet
- Sour Milk Drinks - Sour milk is thick, curdled milk, with a sour taste, obtained from the fermentation of milk. Sour milk drinks such as kefir, laban, buttermilk have been considered in the study
| Keyword | Definition |
|---|---|
| Cultured Butter | Cultured butter is prepared by having the raw butter go through chemical processing and has been added with certain emulsifiers and foreign ingredients. |
| Uncultured Butter | This type of butter is one which has not been processed in any way |
| Natural Cheese | The type of cheese in its most natural form. It is made from natural and simple products and ingredients, including fresh and natural salts, natural colors, enzymes, and high-quality milk. |
| Processed Cheese | Processed cheese undergoes the same processes as natural cheese; however, it requires more steps and many different forms of ingredients. Making processed cheese involves melting natural cheese, emulsifying it, and adding preservatives and other artificial ingredients or colorings. |
| Single Cream | Single cream contains around 18% fat. It’s a single layer of cream that appears over boiled milk. |
| Double Cream | Double cream contains 48% fat, more than double the amount of fat of single cream. It’s heavier and thicker than single cream |
| Whipping Cream | This has a much higher fat percentage than single cream (36%). Used to top cakes, pies, and puddings and as a thickener for sauces, soups, and fillings. |
| Frozen Desserts | Desserts that are meant to be eaten in frozen condition. E.g., sherbets, sorbets, frozen yogurts |
| UHT Milk (Ultra-high temperature milk) | Milk heated at a very high temperature. Ultra-high-temperature processing (UHT) of milk involves heating for 1–8 sec at 135–154°C. which kills the spore-forming pathogenic microorganism, resulting in a product with a shelf-life of several months. |
| Non-dairy butter/Plant-based butter | Butter made from plant-derived oil such as coconut, palm, etc. |
| Non-dairy Yogurt | Yogurt made from typically made from nuts, like almonds, cashews, coconuts, and even other foods like soybeans, plantains, oats, and peas |
| On-trade | It refers to restaurants, QSRs, and bars. |
| Off-trade | It refers to supermarkets, hypermarkets, on-line channels, etc. |
| Neufchatel cheese | One of the oldest kinds of cheese in France. It is a soft, slightly crumbly, mold-ripened, bloomy-rind cheese made in the Neufchâtel-en-Bray region of Normandy. |
| Flexitarian | It refers to a consumer preferring a semi-vegetarian diet, that is centered on plant foods with limited or occasional inclusion of meat. |
| Lactose Intolerance | Lactose intolerance is a reaction in digestive system to lactose, the sugar in milk. It causes uncomfortable symptoms in response to the consumption of dairy products. |
| Cream Cheese | Cream cheese is a soft and creamy fresh cheese with a tangy taste made from milk and cream. |
| Sorbets | Sorbet is a frozen dessert made using ice combined with fruit juice, fruit purée, or other ingredients, such as wine, liqueur, or honey. |
| Sherbet | Sherbet is a sweetened frozen dessert made with fruit and some sort of dairy product such as milk or cream. |
| Shelf stable | Foods that can be safely stored at room temperature, or "on the shelf," for at least one year and do not have to be cooked or refrigerated to eat safely. |
| DSD | Direct Store Delivery is the process in supply chain management wherein the product is delivered from manufacturing plant directly to the retailer. |
| OU Kosher | Orthodox Union Kosher is a kosher certification agency based in New York City. |
| Gelato | Gelato is a frozen creamy dessert made with milk, heavy cream and sugar. |
| Grass-fed Cows | Grass-fed cows are allowed to graze in pastures, where they eat a variety of grasses and clover. |
Need More Details on Market Definition?
Ask a Question
Research Methodology
Mordor Intelligence follows a four-step methodology in all our reports.
- Step-1: Identify Key Variables: In order to build a robust forecasting methodology, the variables and factors identified in Step 1 are tested against available historical market numbers. Through an iterative process, the variables required for market forecast are set, and the model is built on the basis of these variables.
- Step-2: Build a Market Model: Market-size estimations for the forecast years are in nominal terms. Inflation is not a part of the pricing, and the average selling price (ASP) is kept constant throughout the forecast period for each country.
- Step-3: Validate and Finalize: In this important step, all market numbers, variables, and analyst calls are validated through an extensive network of primary research experts from the market studied. The respondents are selected across levels and functions to generate a holistic picture of the market studied.
- Step-4: Research Outputs: Syndicated Reports, Custom Consulting Assignments, Databases & Subscription Platforms

Get More Details On Research Methodology
Download PDF


