Market Overview
| Study Period | 2018 - 2031 |
|---|---|
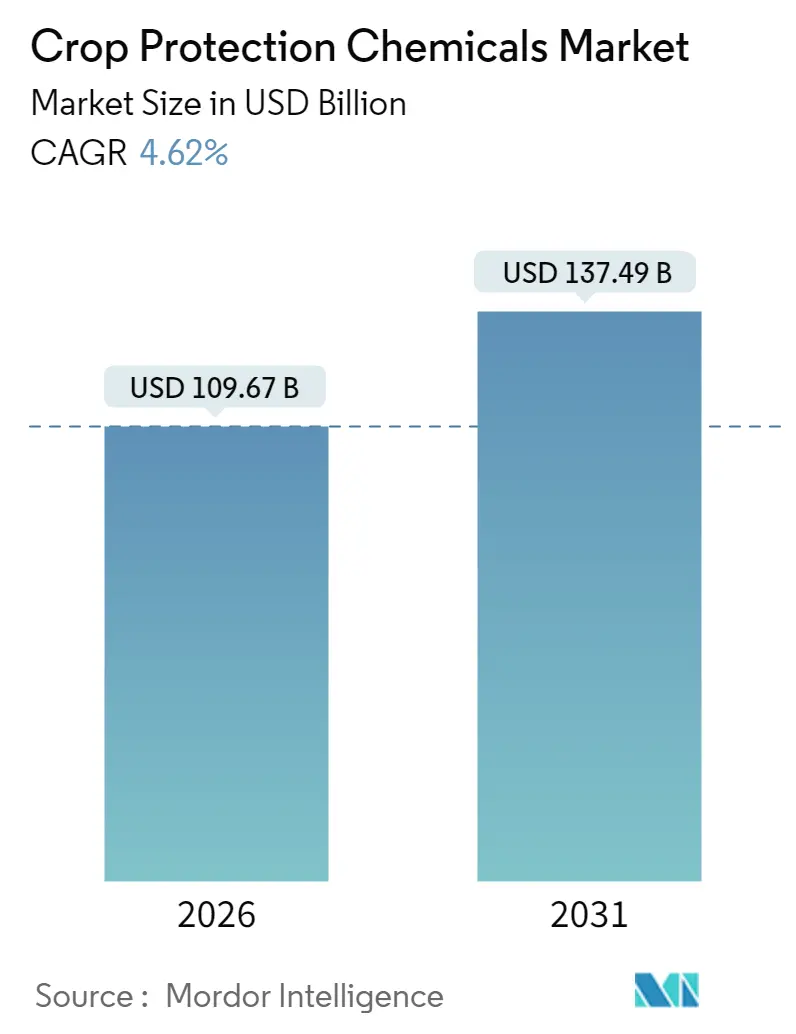
| Market Size (2026) | USD 109.67 Billion |
| Market Size (2031) | USD 137.49 Billion |
| Growth Rate (2026 - 2031) | 4.62% CAGR |
| Fastest Growing Market | Asia Pacific |
| Largest Market | South America |
| Market Concentration | Medium |
Major Players *Disclaimer: Major Players sorted in no particular order Image © Mordor Intelligence. Reuse requires attribution under CC BY 4.0. | |
Crop Protection Chemicals Market Analysis by Mordor Intelligence
The crop protection chemicals market is expected to grow from USD 104.83 billion in 2025 to USD 109.67 billion in 2026 and is forecast to reach USD 137.49 billion by 2031 at 4.62% CAGR over 2026-2031. Steady demand for herbicide-intensive, genetically modified crops, the adoption of precision agriculture, and climate-driven pest migration continue to sustain the growth curve, despite tighter regulatory oversight. Precision sprayers, drone-based spot treatments, and variable-rate application systems enable growers to cut waste while maintaining efficacy, helping the crop protection chemicals market capture productivity gains even in regions facing labor shortages. South America accounts for the largest share, driven by Brazil’s expansion of soybean production[1]Source: “Soybeans and Oil Crops Policy Analysis 2024,” United States Department of Agriculture Economic Research Service, ers.usda.gov, while the Asia-Pacific region records the fastest CAGR, largely due to commercial farming consolidation in India and China. Foliar treatments remain the most common delivery mode, yet soil treatments post the highest growth, and regenerative practices encourage pre-emergent chemistries.
Key Report Takeaways
- By function, herbicide led the crop protection chemicals market share with 42.35% in 2025, and also posted the highest forecast CAGR of 5.02% through 2031.
- By application mode, foliar treatments accounted for 43.25% of the crop protection chemicals market size in 2025. Soil treatment is projected to expand at a 4.92% CAGR to 2031.
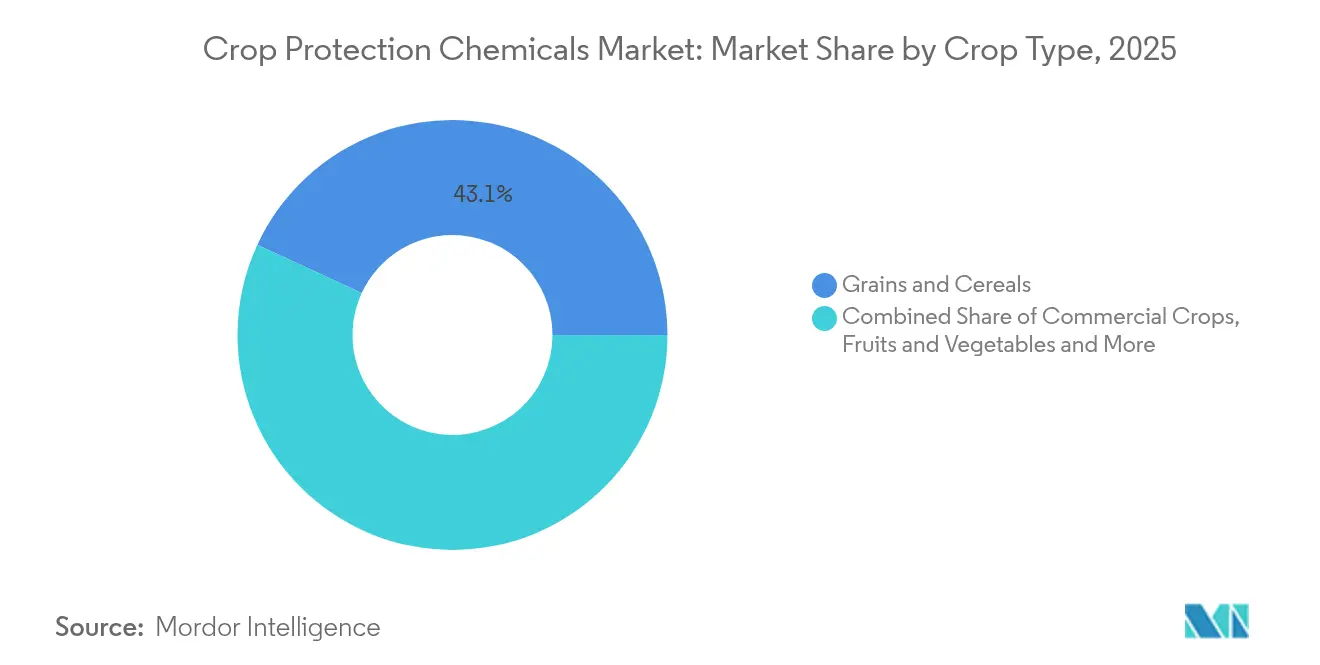
- By crop type, grains and cereals captured a 43.10% share of the crop protection chemicals market size in 2025, and pulses and oilseeds are projected to grow at a 4.71% CAGR between 2026-2031.
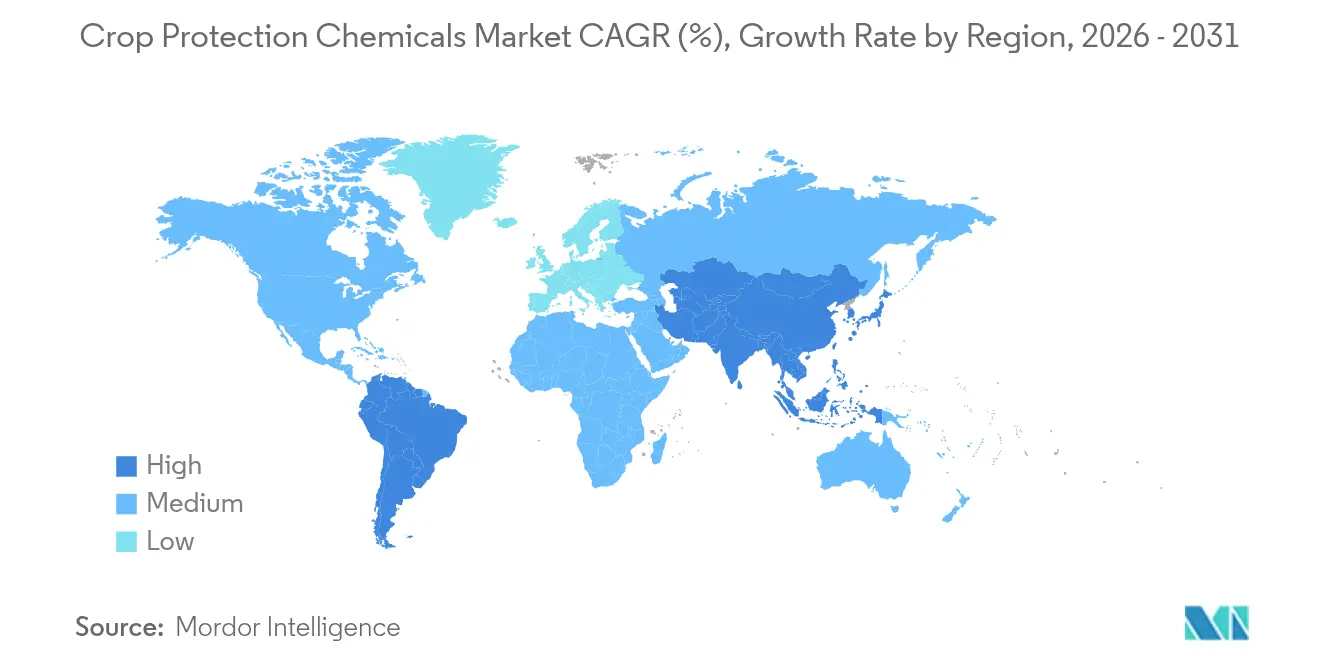
- By geography, South America commanded a 41.85% market share of the crop protection chemicals market in 2025, and the Asia-Pacific region is projected to advance at a 4.73% CAGR through 2031.
Note: Market size and forecast figures in this report are generated using Mordor Intelligence’s proprietary estimation framework, updated with the latest available data and insights as of January 2026.
Global Crop Protection Chemicals Market Trends and Insights
Drivers Impact Analysis
| Driver | (~) % Impact on CAGR Forecast | Geographic Relevance | Impact Timeline |
|---|---|---|---|
| GM-crop acreage expansion | +1.20% | South America and North America | Medium term (2-4 years) |
| Rising herbicide-resistant weeds | +0.90% | North America and South America | Short term (≤ 2 years) |
| Adoption of precision-ag technologies | +0.80% | North America, Europe, and expanding to Asia-Pacific | Medium term (2-4 years) |
| Rapid growth of commercial farming in Asia-Pacific and South America | +0.70% | Asia-Pacific core, and South America expansion | Long term (≥ 4 years) |
| Regenerative agriculture favoring selective chemistries | +0.50% | North America, Europe, and emerging in the Asia-Pacific | Long term (≥ 4 years) |
| Climate-driven pest migration into temperate zones | +0.40% | Global temperate regions | Medium term (2-4 years) |
| Source: Mordor Intelligence | |||
Understand The Key Trends Shaping This Market
Download PDF
GM-Crop Acreage Expansion
Herbicide-tolerant soybeans, corn, and cotton now dominate planting decisions in the Americas, lifting per-hectare chemical intensity even as overall farmland expands. Brazil planted GM soybeans on 95% of its area in 2024, which propelled glyphosate and dicamba sales to record highs[2]Source: “GM Crop Adoption Statistics Brazil 2024,” Brazilian Biosafety Commission, ctnbio.mcti.gov.br. Growers stack multiple modes of action to delay resistance, favoring suppliers with integrated seed and chemical bundles that lock in season-long revenue. Argentina’s approval of HB4 drought-tolerant soybeans further broadens the addressable acreage, especially in marginal regions that have been historically constrained by water stress. As patents expire, branded players accelerate the development of trait-plus-chemistry packages to protect their margins, while generic manufacturers focus on increasing volume in off-patent actives. Collectively, the GM wave sustains herbicide demand, supports premium pricing on combination products, and drives incremental investments in formulation technologies tailored to trait packages.
Rising Herbicide-Resistant Weeds
Glyphosate-resistant Palmer amaranth has spread to 27 U.S. states and is advancing across South America, forcing growers to rotate chemistries and increase application frequency. Resistant biotypes now challenge ALS inhibitors as well, making two- to four-way tank mixes the new norm. This resistance arms race elevates demand for novel modes of action and premium premixes that simplify stewardship. Chemical innovation pipelines regain urgency after a slow decade, while digital scouting tools gain traction to pinpoint outbreaks before they become unmanageable. The economic burden of higher herbicide costs per acre and potential yield loss keeps growers willing to pay for solutions that restore control, giving innovators a clear revenue runway in the near term.
Adoption of Precision-Ag Technologies
Variable-rate sprayers, machine-vision weed cameras, and drone spot treatments reached 35% adoption among large North American farms in 2024[3]Source: “Precision Agriculture Technology Adoption Survey 2024,” American Farm Bureau Federation, fb.org. These systems cut total active ingredient use by 20-40% on broad-acre crops and up to 90% in specialty operations, yet they rely on more concentrated, formulation-optimized chemistries. Manufacturers that supply low-volume, high-potency products compatible with aerial or robotic delivery capture pricing power. Precision data platforms tie in weather, soil, and pest pressure analytics, making chemical application a subscription-like service and boosting stickiness for suppliers that integrate seamlessly. As equipment costs decline and financing options expand to the Asia-Pacific region, precision deployment accelerates, sustaining demand for specialized chemistries even as the total kilograms applied plateau.
Rapid Growth of Commercial Farming in Asia-Pacific and South America
Government-backed land consolidation in India and China, plus corporate investment in Brazil and Argentina, drives larger field sizes and more export-oriented cropping systems. India reported a 15% jump in commercial chemical usage on consolidated farms in 2024[4]Source: “Commercial Farming Initiative Progress Report 2024,” Ministry of Agriculture and Farmers Welfare India, agricoop.nic.in. Larger operators favor branded portfolios, value dependable supply chains, and adopt multi-season contracts that lock in volume. Export certification demands push these farms toward newer, lower-residue active ingredients, benefiting companies with robust regulatory dossiers. Similar commercial scaling in Brazil’s Cerrado supports double-cropping cycles that require near-continuous pest control, further lifting seasonal demand.
Restraints Impact Analysis
| Restraint | (~) % Impact on CAGR Forecast | Geographic Relevance | Impact Timeline |
|---|---|---|---|
| Stringent pesticide bans and MRL tightening (European Union focus) | -0.80% | Europe primary, and spillover effects globally | Short term (≤ 2 years) |
| Accelerating weed resistance to glyphosate and ALS inhibitors | -0.60% | North America and South America | Medium term (2-4 years) |
| Volatile Chinese technical-grade supply chain | -0.40% | Global supply chain impact | Short term (≤ 2 years) |
| Fast uptake of biologicals cannibalizing synthetic sales | -0.30% | Europe, North America, and expanding globally | Long term (≥ 4 years) |
| Source: Mordor Intelligence | |||
Stringent Pesticide Bans and MRL Tightening (European Union focus)
European authorities continue to review active ingredients, with 15 key chemistries set to lose renewal in 2024, while maximum residue limits are being steadily lowered. Export-oriented producers in South America and Africa now face compliance costs to meet EU tolerances, even when selling to other destinations, because global grain buyers conform to the strictest standards. Smaller manufacturers struggle to finance new data packages, accelerating market share gains for top-tier firms that can invest in toxicology and environmental dossiers. Growers switch to newer, more expensive actives that carry lower residue profiles, lifting per-hectare spend but squeezing margins when commodity prices soften. Missing tools force some farmers to revert to older, more frequent applications, paradoxically increasing the overall chemical load despite the policy intent. Research priorities shift toward bio-based or low-residue molecules, lengthening development timelines and raising the bar for entry. The combined regulatory and commercial pressure subtracts 0.8 percentage points from the forecast CAGR, with the sharpest revenue impact projected to arrive before 2027 as grace periods expire. Companies with robust EU regulatory teams and pipeline actives positioned for fast approval gain a relative advantage under the new rules.
Fast Uptake of Biologicals Cannibalizing Synthetic Sales
The rapid adoption of biological crop protection products is increasingly displacing synthetic solutions. Demand is accelerating in high-value fruit and vegetable segments as retail chains and food processors emphasize residue-free sourcing, prompting growers to adopt microbial and biochemical alternatives that meet zero-tolerance standards. Greenhouse operations are leading this transition, where controlled conditions enhance the effectiveness of biocontrol and reduce the risk of application. The decline in synthetic fungicide and insecticide use is most pronounced in Europe and North America, driven by favorable regulations and a shift in public perception. Major chemical companies are responding by acquiring biological start-ups to strengthen their portfolios, though integration and distribution challenges continue to slow broad adoption. As synthetic sales stabilize in premium segments, suppliers with diversified biological portfolios continue to maintain growth while advancing their sustainability commitments.
Segment Analysis
By Function: Herbicide Anchor Revenue as Resistance Mounts
Herbicide captured a 42.35% market share of the crop protection chemicals market in 2025, representing the largest slice of the market size and generating the bulk of incremental revenue growth. Persistent resistance in Palmer amaranth and Conyza species necessitates multi-site programs, prompting growers to adopt stacked formulations that carry premium price points. Glyphosate still dominates the volume, but demand is increasingly shifting to HPPD inhibitors, PPO inhibitors, and new proprietary chemistries positioned for post-resistance control. The resulting mix upgrade underpins a robust 5.02% CAGR forecast to 2031.
Continued GM trait adoption, especially in Brazil and Argentina, sustains high herbicide intensity per hectare. Integrated seed-and-chemical offerings allow leading suppliers to bundle traits with tailored sprays, protecting both intellectual property and gross margins. Fungicides hold roughly significant share, supported by weather-linked disease flare-ups and the 2024 launch of Revysol in Brazil, which offers a new mode of action against soybean rust. Insecticides are seeing sporadic spikes when climate-driven pest incursions occur. Nematicides and molluscicides remain niche but essential for high-value horticulture, where even minor yield losses undermine profitability.

Note: Segment shares of all individual segments available upon report purchase
Get Detailed Market Forecasts at the Most Granular Levels
Download PDF
By Application Mode: Soil Treatments Accelerate Within a Foliar-Led Landscape
Foliar sprays accounted for 43.25% of the crop protection chemicals market size in 2025, benefiting from the widespread use of boom sprayers and the increasing adoption of drones for targeted spot applications. Adjuvant advances enhance retention, allowing lower active loading without sacrificing efficacy. Yet soil treatments, while still trailing in share, post the fastest 4.92% CAGR through 2031 as regenerative systems emphasize pre-emergent weed control and reduced tillage.
Seed treatments are expanding steadily because they deliver early-season pest suppression with minimal environmental impact, aligning with residue-reduction mandates from grain buyers. Chemigation uptake climbs in irrigated zones, where delivering fertigation and pesticides together cuts labor and water loss. Fumigation stays specialized, concentrated in high-value fruit, vegetable, and flower segments where soilborne diseases devastate returns. Across modes, formulation science increasingly tailors viscosity, particle size, and volatility profiles to suit precision equipment, amplifying the value proposition of premium actives.
By Crop Type: Grains and Cereals Drive Volume, Specialty Crops Drive Value
Grains and cereals secured 43.10% of the crop protection chemicals market share in 2025, reflecting both expansive acreage and heavy reliance on herbicides in corn and soybean rotations. Even modest percentage shifts in cereal demand translate to large absolute changes in the crop protection chemicals market size, making the segment the primary volume driver. Pulses and oilseeds post the quickest 4.71% CAGR as soybean plantings surge in Brazil’s Cerrado and India pivots toward protein-rich legumes to meet dietary change.
Fruits and vegetables, which account for only a quarter of the hectares treated, represent roughly the same share of market value because multiple spray passes and zero-tolerance residue rules require high-performance fungicides and insecticides. Commercial crops, such as cotton and sugarcane, generate stable demand in tropical regions. Cotton, in particular, benefits from stacked Bt and herbicide-tolerant traits, which increase chemical expenditures. Turf and ornamentals remain the smallest slice yet deliver attractive margins thanks to professional landscaping and golf course maintenance needs in urbanizing economies. Together, these patterns reveal a dual-engine market: bulk tonnage in broad-acre grains sustains base revenue, while specialty crops support premium growth.
Note: Segment shares of all individual segments available upon report purchase
Get Detailed Market Forecasts at the Most Granular Levels
Download PDF
Geography Analysis
South America accounted for 41.85% of the crop protection chemicals market share in 2025, driven by Brazil’s extensive soybean and corn production in the Cerrado savanna. Brazil alone consumed over 60% of the regional volume, supported by record pesticide purchases for consecutive planting cycles during the 2024 season. Argentina’s export-focused farms contributed to growth, with genetically modified (GM) crop adoption surpassing 95% of national acreage, reinforcing herbicide-intensive farming practices. Favorable weather conditions and government policies prioritizing foreign exchange earnings have supported steady growth in South America, despite occasional logistical challenges at ports.
The Asia-Pacific region is the fastest-growing market, with a compound annual growth rate (CAGR) of 4.73% projected through 2031. Growth is driven by land consolidation and increased mechanization in countries such as India, China, and Southeast Asia. In India, commercial farming initiatives led to a 15% increase in chemical usage in 2024, as larger field sizes required season-long pest control programs. In China, environmental policies have prompted pesticide plant consolidation while encouraging the use of higher-efficacy, lower-residue chemicals that align with national food safety standards. Additionally, Indonesia, Thailand, and Vietnam have contributed to incremental demand through expanding palm oil and intensive rice farming systems, which rely on specialized fungicides and insecticides to protect crops in humid climates.
North America represents a significant portion of global consumption, supported by the adoption of precision agriculture, which now covers 35% of large farms and optimizes application timing. In the United States, high GM-crop acreage and increasing weed resistance have sustained per-acre herbicide expenditures, despite tight profit margins. Europe accounts for a substantial share of demand, but stringent regulations and residue limits have shifted investments toward low-dose chemistries and biological solutions. Despite these restrictions, the specialty fruit and vegetable segments maintain high market value. Africa remains the smallest regional market; however, commercial farming projects in South Africa and emerging hubs in West Africa are beginning to adopt modern crop protection programs, indicating a gradual increase in long-term demand.
Get Analysis on Important Geographic Markets
Download PDF
Competitive Landscape
The crop protection chemicals market is moderately concentrated, with the top five suppliers accounting for a significant share of global revenue. These companies leverage substantial R&D budgets to navigate increasingly stringent regulatory reviews. Syngenta, Bayer, and BASF focus on integrated seed-plus-spray solutions, which encourage growers to adopt multi-year technology packages while maintaining premium pricing. Corteva enhances its market position by expanding capacity to ensure a steady supply of herbicides and seed treatments, catering to precision agriculture customers across North America.
Competitive dynamics in the market are evolving, with a growing emphasis on biological integration and data-driven alliances. In April 2024, BASF partnered with Climate Corporation to integrate real-time weather and pest pressure data into fungicide timing tools, thereby enhancing field efficacy and customer retention. Additionally, precision agriculture equipment manufacturers are increasingly collaborating with chemical firms to bundle analytics subscriptions with optimized formulations, providing digitally adept suppliers with a competitive cross-selling advantage.
Patent expirations continue to create opportunities for regional formulators. However, escalating data requirements in the EU and the U.S. have increased the costs associated with maintaining off-patent molecules. Generic players, such as Albaugh and Rotam, are focusing on volume growth in South America and Southeast Asia, where regulatory frameworks are less stringent but are gradually tightening. Mid-tier companies that can customize active ingredients to address local pest challenges, establish reliable non-Chinese supply chains, and integrate with drone-sprayer platforms are well-positioned to gain market share. These firms benefit as growers increasingly prioritize timely product availability and targeted performance.
Crop Protection Chemicals Industry Leaders
BASF SE
Bayer AG
Corteva Agriscience
FMC Corporation
Syngenta Group
- *Disclaimer: Major Players sorted in no particular order
Need More Details on Market Players and Competitors?
Download PDF
Recent Industry Developments
- October 2025: Syngenta secured over 1,200 synthetic crop protection product approvals in 2025, launching key new actives including SEGURIS Evo fungicide for rice and VESTORIA Pro insecticide for brown planthopper control in rice, alongside expanding ADEPIDYN and TYMIRIUM technologies for nematode and fungal disease management in Brazil and the Philippines.
- March 2025: BASF has partnered with Agmatix to create a digital detection tool for Soybean Cyst Nematode (SCN), aimed at improving risk assessment and optimizing synthetic nematicide application strategies.
- April 2023: Nufarm launched a new liquid formulation fungicide, Tourney EZ, exclusively for turf and ornamental crops based on customer demand, which further strengthens the company's role in turf and ornamental crop protection.
Global Crop Protection Chemicals Market Report Scope
Fungicide, Herbicide, Insecticide, Molluscicide, Nematicide are covered as segments by Function. Chemigation, Foliar, Fumigation, Seed Treatment, Soil Treatment are covered as segments by Application Mode. Commercial Crops, Fruits & Vegetables, Grains & Cereals, Pulses & Oilseeds, Turf & Ornamental are covered as segments by Crop Type. Africa, Asia-Pacific, Europe, North America, South America are covered as segments by Region.Function
| Fungicide |
| Herbicide |
| Insecticide |
| Molluscicide |
| Nematicide |
Application Mode
| Chemigation |
| Foliar |
| Fumigation |
| Seed Treatment |
| Soil Treatment |
Crop Type
| Commercial Crops |
| Fruits and Vegetables |
| Grains and Cereals |
| Pulses and Oilseeds |
| Turf and Ornamental |
Geography
| Africa | South Africa |
| Rest of Africa | |
| Asia-Pacific | Australia |
| China | |
| India | |
| Indonesia | |
| Japan | |
| Myanmar | |
| Pakistan | |
| Philippines | |
| Thailand | |
| Vietnam | |
| Rest of Asia-Pacific | |
| Europe | France |
| Germany | |
| Italy | |
| Netherlands | |
| Russia | |
| Spain | |
| Ukraine | |
| United Kingdom | |
| Rest of Europe | |
| North America | Canada |
| Mexico | |
| United States | |
| Rest of North America | |
| South America | Argentina |
| Brazil | |
| Chile | |
| Rest of South America |
| Function | Fungicide | |
| Herbicide | ||
| Insecticide | ||
| Molluscicide | ||
| Nematicide | ||
| Application Mode | Chemigation | |
| Foliar | ||
| Fumigation | ||
| Seed Treatment | ||
| Soil Treatment | ||
| Crop Type | Commercial Crops | |
| Fruits and Vegetables | ||
| Grains and Cereals | ||
| Pulses and Oilseeds | ||
| Turf and Ornamental | ||
| Geography | Africa | South Africa |
| Rest of Africa | ||
| Asia-Pacific | Australia | |
| China | ||
| India | ||
| Indonesia | ||
| Japan | ||
| Myanmar | ||
| Pakistan | ||
| Philippines | ||
| Thailand | ||
| Vietnam | ||
| Rest of Asia-Pacific | ||
| Europe | France | |
| Germany | ||
| Italy | ||
| Netherlands | ||
| Russia | ||
| Spain | ||
| Ukraine | ||
| United Kingdom | ||
| Rest of Europe | ||
| North America | Canada | |
| Mexico | ||
| United States | ||
| Rest of North America | ||
| South America | Argentina | |
| Brazil | ||
| Chile | ||
| Rest of South America | ||
Need A Different Region or Segment?
Customize Now
Market Definition
- Function - Crop Protection Chemicals are apllied to control or prevent pests, including insects, fungi, weeds, nematodes, and mollusks, from damaging the crop and to protect the crop yield.
- Application Mode - Foliar, Seed Treatment, Soil Treatment, Chemigation, and Fumigation are the different type of application modes through which crop protection chemicals are applied to the crops.
- Crop Type - This represents the consumption of crop protection chemicals by Cereals, Pulses, Oilseeds, Fruits, Vegetables, Turf, and Ornamental crops.
| Keyword | Definition |
|---|---|
| IWM | Integrated weed management (IWM) is an approach to incorporate multiple weed control techniques throughout the growing season to give producers the best opportunity to control problematic weeds. |
| Host | Hosts are the plants that form relationships with beneficial microorganisms and help them colonize. |
| Pathogen | A disease-causing organism. |
| Herbigation | Herbigation is an effective method of applying herbicides through irrigation systems. |
| Maximum residue levels (MRL) | Maximum Residue Limit (MRL) is the maximum allowed limit of pesticide residue in food or feed obtained from plants and animals. |
| IoT | The Internet of Things (IoT) is a network of interconnected devices that connect and exchange data with other IoT devices and the cloud. |
| Herbicide-tolerant varieties (HTVs) | Herbicide-tolerant varieties are plant species that have been genetically engineered to be resistant to herbicides used on crops. |
| Chemigation | Chemigation is a method of applying pesticides to crops through an irrigation system. |
| Crop Protection | Crop protection is a method of protecting crop yields from different pests, including insects, weeds, plant diseases, and others that cause damage to agricultural crops. |
| Seed Treatment | Seed treatment helps to disinfect seeds or seedlings from seed-borne or soil-borne pests. Crop protection chemicals, such as fungicides, insecticides, or nematicides, are commonly used for seed treatment. |
| Fumigation | Fumigation is the application of crop protection chemicals in gaseous form to control pests. |
| Bait | A bait is a food or other material used to lure a pest and kill it through various methods, including poisoning. |
| Contact Fungicide | Contact pesticides prevent crop contamination and combat fungal pathogens. They act on pests (fungi) only when they come in contact with the pests. |
| Systemic Fungicide | A systemic fungicide is a compound taken up by a plant and then translocated within the plant, thus protecting the plant from attack by pathogens. |
| Mass Drug Administration (MDA) | Mass drug administration is the strategy to control or eliminate many neglected tropical diseases. |
| Mollusks | Mollusks are pests that feed on crops, causing crop damage and yield loss. Mollusks include octopi, squid, snails, and slugs. |
| Pre-emergence Herbicide | Preemergence herbicides are a form of chemical weed control that prevents germinated weed seedlings from becoming established. |
| Post-emergence Herbicide | Postemergence herbicides are applied to the agricultural field to control weeds after emergence (germination) of seeds or seedlings. |
| Active Ingredients | Active ingredients are the chemicals in pesticide products that kill, control, or repel pests. |
| United States Department of Agriculture (USDA) | The Department of Agriculture provides leadership on food, agriculture, natural resources, and related issues. |
| Weed Science Society of America (WSSA) | The WSSA, a non-profit professional society, promotes research, education, and extension outreach activities related to weeds. |
| Suspension concentrate | Suspension concentrate (SC) is one of the formulations of crop protection chemicals with solid active ingredients dispersed in water. |
| Wettable powder | A wettable powder (WP) is a powder formulation that forms a suspension when mixed with water prior to spraying. |
| Emulsifiable concentrate | Emulsifiable concentrate (EC) is a concentrated liquid formulation of pesticide that needs to be diluted with water to create a spray solution. |
| Plant-parasitic nematodes | Parasitic Nematodes feed on the roots of crops, causing damage to the roots. These damages allow for easy plant infestation by soil-borne pathogens, which results in crop or yield loss. |
| Australian Weeds Strategy (AWS) | The Australian Weeds Strategy, owned by the Environment and Invasives Committee, provides national guidance on weed management. |
| Weed Science Society of Japan (WSSJ) | WSSJ aims to contribute to the prevention of weed damage and the utilization of weed value by providing the chance for research presentation and information exchange. |
Need More Details on Market Definition?
Ask a Question
Research Methodology
Mordor Intelligence follows a four-step methodology in all our reports.
- Step-1: Identify Key Variables: In order to build a robust forecasting methodology, the variables and factors identified in Step-1 are tested against available historical market numbers. Through an iterative process, the variables required for market forecast are set and the model is built on the basis of these variables.
- Step-2: Build a Market Model: Market-size estimations for the forecast years are in nominal terms. Inflation is not a part of the pricing, and the average selling price (ASP) is kept constant throughout the forecast period.
- Step-3: Validate and Finalize: In this important step, all market numbers, variables and analyst calls are validated through an extensive network of primary research experts from the market studied. The respondents are selected across levels and functions to generate a holistic picture of the market studied.
- Step-4: Research Outputs: Syndicated Reports, Custom Consulting Assignments, Databases & Subscription Platforms

Get More Details On Research Methodology
Download PDF


