
Corneal Implants Market Size and Share
Market Overview
| Study Period | 2020 - 2031 |
|---|---|
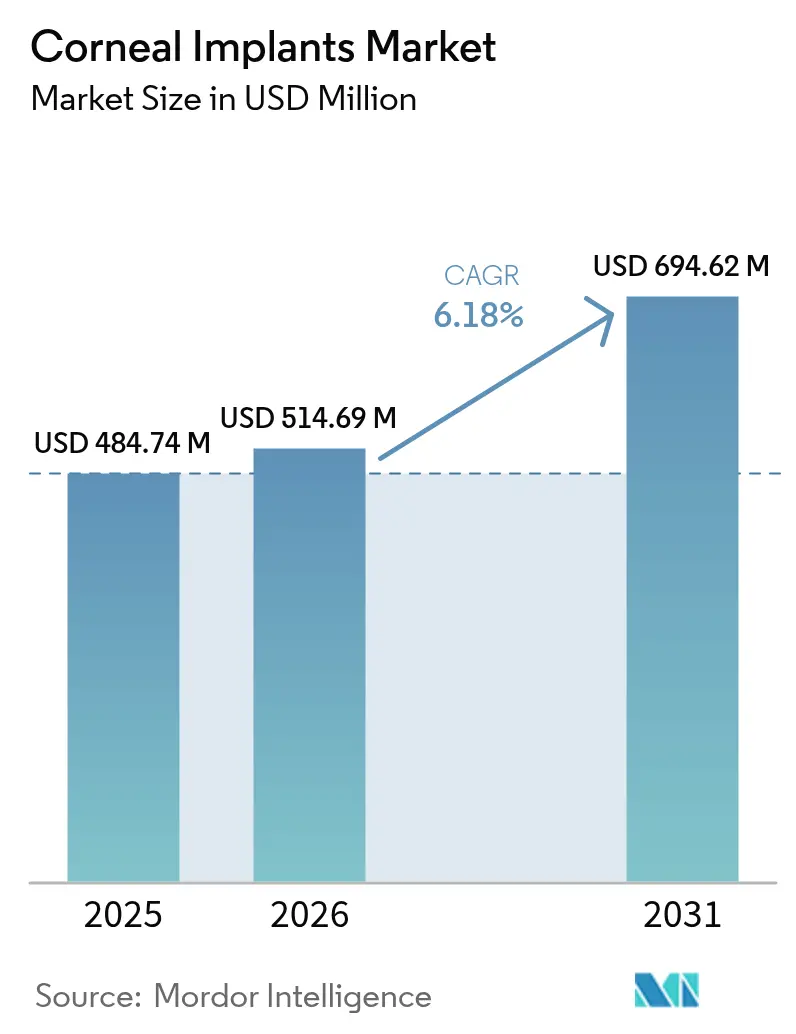
| Market Size (2026) | USD 514.69 Million |
| Market Size (2031) | USD 694.62 Million |
| Growth Rate (2026 - 2031) | 6.18 % |
| Fastest Growing Market | Asia-Pacific |
| Largest Market | North America |
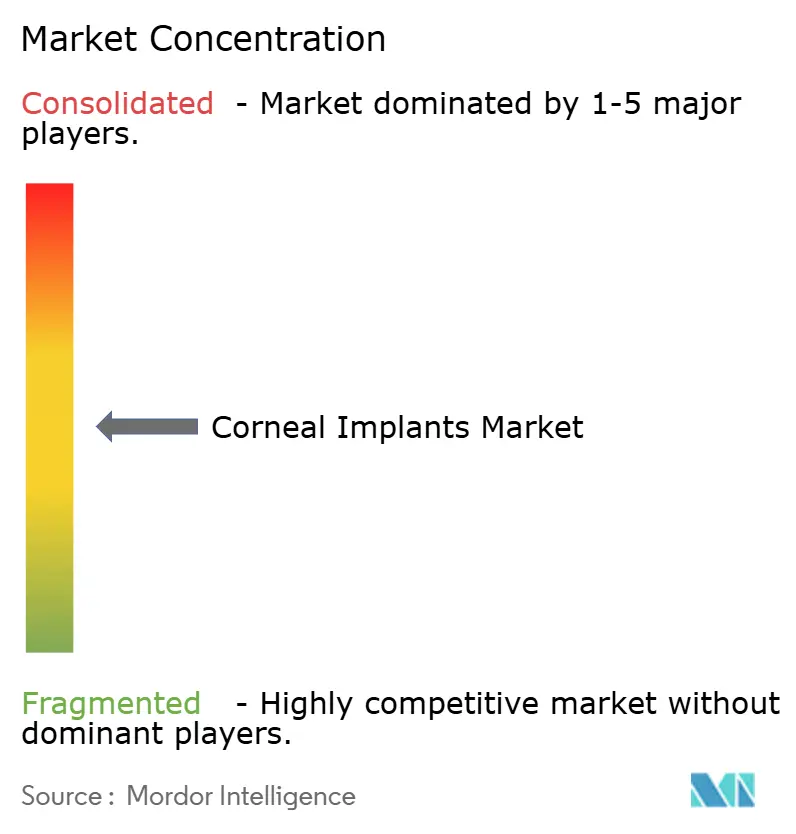
| Market Concentration | Medium |
Major Players *Disclaimer: Major Players sorted in no particular order Image © Mordor Intelligence. Reuse requires attribution under CC BY 4.0. | |
Corneal Implants Market Analysis by Mordor Intelligence
Corneal implants market size in 2026 is estimated at USD 514.69 million, growing from 2025 value of USD 484.74 million with 2031 projections showing USD 694.62 million, growing at 6.18% CAGR over 2026-2031. Growth reflects an industry-wide pivot from reactive corneal care toward proactive intervention, enabled by breakthroughs in artificial biomaterials, femtosecond-laser precision, and 3-D bioprinting. Aging populations enlarge the surgical pipeline while regenerative science expands the candidate pool to cases once deemed inoperable. North America currently dominates revenue because FDA breakthrough designations accelerate device launches, yet Asia-Pacific is the volume engine as rising screen usage drives new pathology. Supply-chain vigilance around medical-grade PMMA and hydrogel inputs remains critical, but the innovation tempo offsets most near-term disruptions.
Key Report Takeaways
- By implant type, human donor tissue led with 69.15% of corneal implants market share in 2025, while artificial implants are advancing at a 7.12% CAGR through 2031.
- By procedure type, penetrating keratoplasty accounted for 45.92% revenue in 2025; endothelial keratoplasty is the fastest-growing segment at 6.9% CAGR to 2031.
- By disease indication, keratoconus held 33.86% share in 2025, whereas Fuchs’ dystrophy solutions will grow 7.22% annually over the same period.
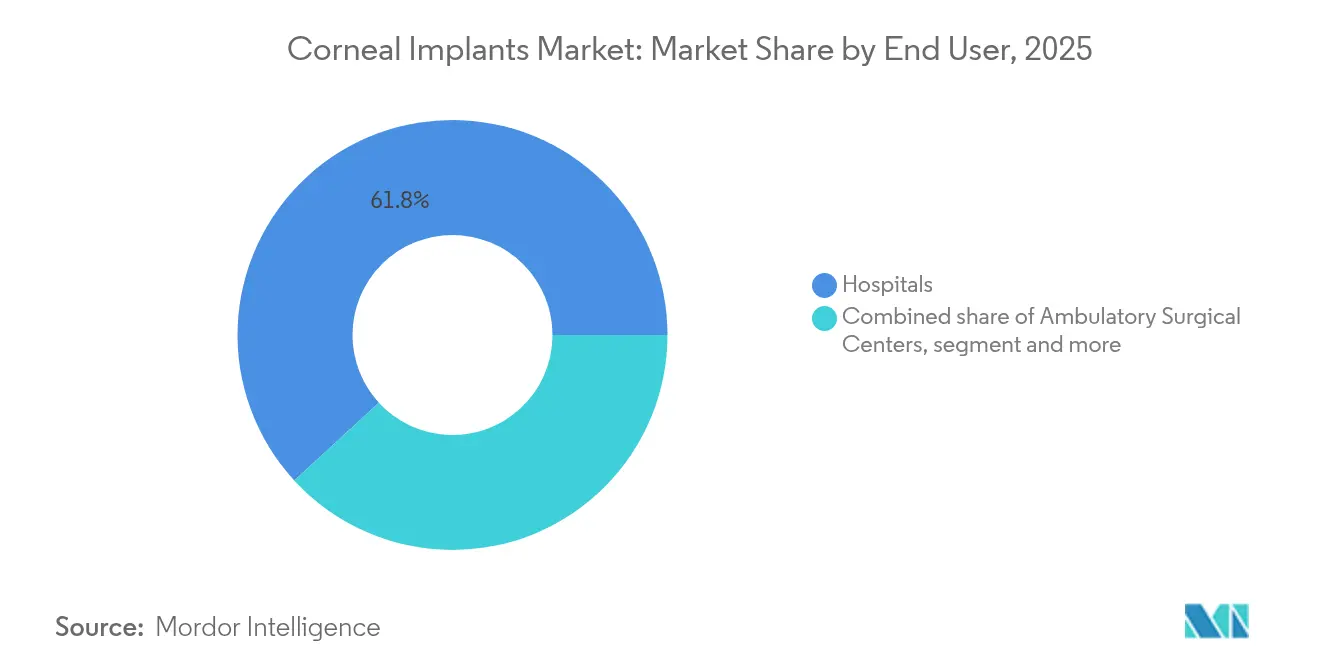
- By end user, hospitals captured 61.83% of the corneal implants market size in 2025; ambulatory surgical centers are projected to expand at 7.35% CAGR.
- By material, PMMA & other polymers led with 43.11% share in 2025; hydrogels are pacing the field with an 7.85% CAGR.
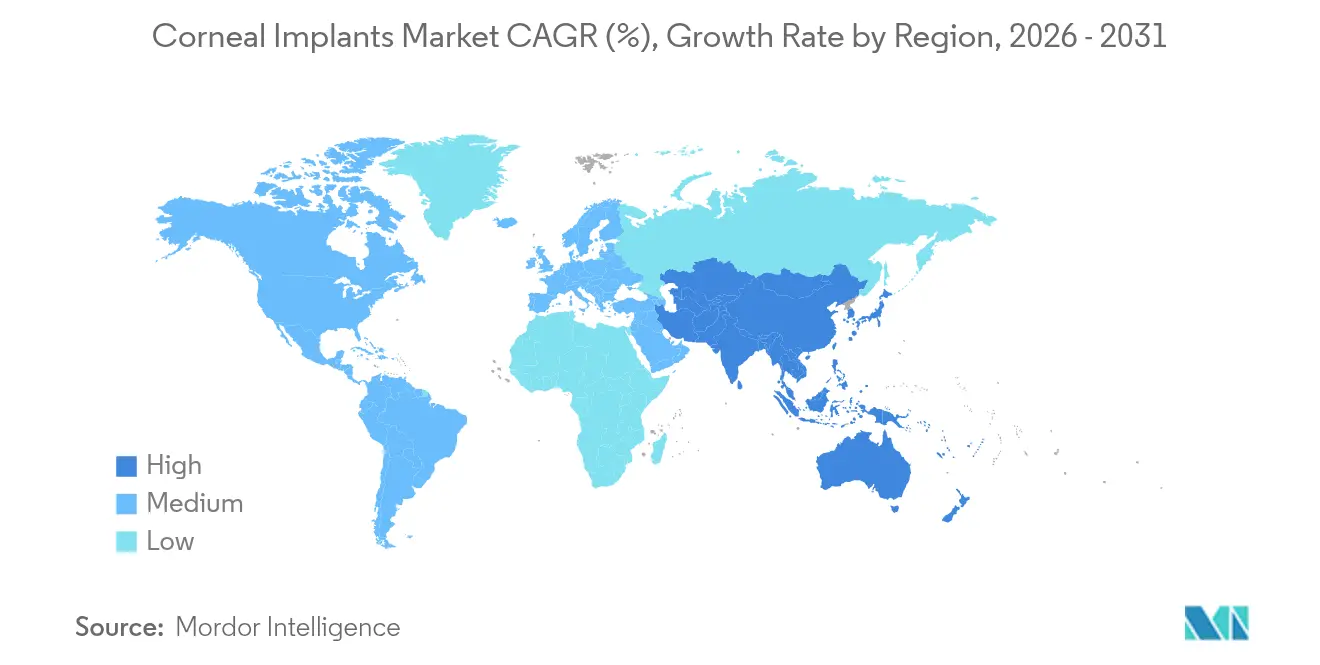
- By geography, North America commanded 50.92% revenue in 2025; Asia-Pacific is expected to post the quickest 7.7% CAGR to 2031.
Note: Market size and forecast figures in this report are generated using Mordor Intelligence’s proprietary estimation framework, updated with the latest available data and insights as of 2026.
Global Corneal Implants Market Trends and Insights
Drivers Impact Analysis*
| Driver | (~) % Impact on CAGR Forecast | Geographic Relevance | Impact Timeline |
|---|---|---|---|
| Technological advancements in corneal implants | +1.8% | Global, with early adoption in North America & EU | Medium term (2-4 years) |
| Growing incidences of corneal disorders & blindness in elderly | +1.5% | Global, concentrated in aging populations of developed markets | Long term (≥ 4 years) |
| Rising adoption of minimally-invasive lamellar keratoplasty | +1.2% | North America & EU leading, APAC following | Medium term (2-4 years) |
| Advances in bioengineered synthetic endothelial layers | +1.0% | North America & EU core markets | Long term (≥ 4 years) |
| Expansion of eye-bank public-private partnerships in emerging markets | +0.8% | APAC, Latin America, MEA | Long term (≥ 4 years) |
| Surge in AI-based pre-operative corneal imaging | +0.7% | Global, with technology hubs leading adoption | Short term (≤ 2 years) |
| Source: Mordor Intelligence | |||
Technological Advancements in Corneal Implants
Cross-linked recombinant collagen scaffolds sustained clear corneal regeneration for four years, delivering mean corrected acuity of 20/54 without immunosuppression needs. Patient-specific 3-D-printed lenticules now match individual curvature, solving donor-shortage bottlenecks while lowering rejection risk. Kuragel hydrogel matrices show superior stromal integration versus legacy PMMA designs. Coupling femtosecond lasers with these bio-scaffolds reduces operating time and improves wound integrity. Collectively, these gains broaden the addressable base of the corneal implants market by upgrading clinical outcomes and surgeon confidence.
Growing Incidences of Corneal Disorders & Blindness in Elderly
Fuchs’ endothelial dystrophy affects 4% of U.S. adults over 40, with prevalence climbing steeply after age 60. Medicare data links advanced cases to rising treatment spending, underscoring the economic imperative for definitive surgical cures. Longer life expectancy and heavy digital-device use exacerbate dry-eye and accelerates surface degeneration. Improved safety profiles entice older patients who previously deferred surgery, propelling steady procedure growth.
Rising Adoption of Minimally-Invasive Lamellar Keratoplasty
Ten-year follow-up shows Descemet membrane endothelial keratoplasty (DMEK) with 75% graft survival and only 10% rejection, outclassing full-thickness techniques.[1] Shorter healing times and lower astigmatism improve quality-of-life metrics. Uptake of office-based suites grew from 0.5% in 2020 to 2.2% in early 2023, signaling confidence in streamlined settings. Enhanced imaging guides precise tissue dissection, dropping the learning curve and hastening diffusion.
Advances in Bioengineered Synthetic Endothelial Layers
Pandorum Technologies secured USD 11 million in 2024 for Kuragenx exosome-rich hydrogel, slated for first-in-human trials in 2025. Porcine collagen constructs restored vision to 20/36 on average and carry 2-year shelf life. Mass Eye and Ear’s CALEC therapy achieved 93% ocular-surface restoration at 12 months. These shelf-stable, donor-independent options unlock new capacity in regions with limited eye-banking.
Restraints Impact Analysis*
| Restraint | (~) % Impact on CAGR Forecast | Geographic Relevance | Impact Timeline |
|---|---|---|---|
| High cost of keratoprosthesis & surgery | -1.5% | Global, particularly acute in emerging markets | Medium term (2-4 years) |
| Availability of alternative treatments (CXL, IOLs) | -1.2% | Developed markets with advanced treatment options | Short term (≤ 2 years) |
| Supply-chain bottlenecks for medical-grade PMMA & hydrogels | -0.8% | Global manufacturing hubs, cascading to all markets | Short term (≤ 2 years) |
| Post-keratoplasty microbial keratitis risk | -0.5% | Global, with higher impact in regions with limited post-op care | Long term (≥ 4 years) |
| Source: Mordor Intelligence | |||
High Cost of Keratoprosthesis & Surgery
A single Boston Keratoprosthesis procedure can exceed USD 30,000 once lifelong follow-up is factored. Reimbursement growth lags inflation, curbing facility investment. Device makers also face 20% of revenue tied to supply-chain expenses, challenging price flexibility. Consequently, cash-strapped health systems delay adoption or choose donor grafts instead.
Availability of Alternative Treatments
Epi-on corneal cross-linking is on track for FDA clearance in 2025, offering non-surgical halting of keratoconus progression. Premium intraocular lenses now deliver high-definition acuity with minimal dysphotopsia, diverting some refractive cases away from transplantation. Twelve-year follow-up finds only 4.3% of CXL patients showing disease progression, rivaling graft durability.[2] These modalities shrink the pool eligible for implants, at least in early disease stages.
*Our forecasts treat driver/restraint impacts as directional, not additive. The impact forecasts reflect baseline growth, mix effects, and variable interactions.
Segment Analysis
By Implant Type: Artificial Gains Despite Donor Dominance
Human donor grafts provided 69.15% of corneal implants market revenue in 2025, supported by decades of surgical standardization. Artificial devices, however, are growing 7.12% per year as breakthrough designations speed approvals. EyeYon Medical’s EndoArt membrane cut mean central corneal thickness from 759 µm to 613 µm at 12 months, validating synthetic viability. The Boston Keratoprosthesis tops 20,000 implants worldwide. Newer hydrogel-based optics now promote cellular in-growth, a marked upgrade over inert PMMA. Collectively, these trends reposition the artificial slice of the corneal implants market for sustained share capture through 2031.
Continued donor shortages sustain waitlists, prompting surgeons to trial synthetic options even as they refine tissue matching algorithms in eye banks. Manufacturing scale-up keeps average device costs on a gradual downward path, though specialty follow-up still commands premium fees. Convergence of bioprinting and collagen scaffolds is expected to lift the corneal implants market size for artificial devices at the fastest clip within this decade.


By Procedure Type: Endothelial Techniques Drive Innovation
Penetrating keratoplasty retained 45.92% of global revenue during 2025, yet endothelial keratoplasty is tracking a 6.9% CAGR on superior visual recovery profiles. A 75% 10-year graft survival rate with minimal rejection propels surgeon preference for DMEK. Laser-assisted incisions lower induced astigmatism, which once deterred adoption. Cell-therapy infusions under development promise to merge pharmacologic convenience with surgical durability.
Rising comfort with partial-thickness grafts is redirecting capital budgets toward lamellar instrumentation. The corneal implants market share held by full-thickness techniques will likely shrink as payers reward quicker rehabilitation and fewer complications. Training programs now prioritize lamellar skills, reinforcing momentum.
By Disease Indication: Fuchs’ Dystrophy Emerges as Growth Driver
Keratoconus dominated with 33.86% revenue in 2025, but Fuchs’ dystrophy therapies are on a 7.22% growth trajectory as population aging surges endothelial disease prevalence. Diagnostic AI flags early stromal edema, allowing timely surgical referral and reducing graft failure risk. Medicare’s rising spend on Fuchs’ management underlines the economic stakes.
Cell-based injectable therapies and Descemet stripping only (DSO) procedures widen treatment choice. As these innovations scale, the corneal implants market size for endothelial disorders is set to overtake anterior pathology segments across many advanced economies before 2031.
By End User: ASCs Capitalize on Outpatient Shift
Hospitals held 61.83% revenue in 2025 thanks to complex-case capacity and eye-bank affiliations. Ambulatory surgical centers, expanding 7.35% annually, capture routine grafts by coupling lower facility fees with same-day discharge protocols. Medicare reimburses corneal tissue separately via HCPCS V2785, sustaining ASC margins.
Efficiency-driven private equity investment fuels ASC build-outs, while portable femtosecond lasers cut capital-equipment barriers. The corneal implants market now sees a steady migration of lamellar cases to outpatient venues, freeing hospital theaters for high-acuity revisions.
By Material: Hydrogels Drive Innovation Surge
PMMA and allied polymers contributed 43.11% of 2025 revenue, anchored by the Boston Type I device. Surface nano-hydroxyapatite coatings now elevate biointegration, shrinking sterile melt risk. Hydrogels, meanwhile, register an 7.85% CAGR, buoyed by injectable formats permitting micro-incision delivery and in-situ curing.
Bio-engineered collagen lenticules boosted corneal thickness by up to 285 µm in early trials, restoring functional vision without donor tissue removal. University of Melbourne’s Hygelix scaffold mirrors Descemet’s membrane porosity, fostering nutrient diffusion.These advances should widen the corneal implants market share for hydrogel-based constructs over the medium term.
Geography Analysis
North America controlled 50.92% of global revenue in 2025 owing to FDA breakthrough pathways, eye-bank maturity, and Medicare’s separate tissue reimbursement. Academic hubs such as Mass Eye and Ear partner with device firms to pilot next-gen implants, sustaining a tight innovation loop. Breakthrough designations for products like EndoArt further shorten time-to-clinic. Even so, supply-chain vigilance around PMMA imports remains on strategic watchlists.
Asia-Pacific is the fastest-advancing territory with an 7.7% CAGR through 2031. India alone carries 6.8 million corneal-blind individuals, adding 25,000–30,000 new cases yearly. Eye-bank deficits and surgeon shortages open space for shelf-stable synthetics. Government blindness-eradication drives plus rising middle-class spending underpin procedure volume growth, cementing the region as a critical demand node for the corneal implants market.
Europe shows steady uptake under the Medical Device Regulation introduced in 2022. Recent CE marks for advanced optics illustrate regulators’ receptivity to innovation. Germany’s ophthalmic sector booked EUR 2,066.1 million revenue in fiscal 2024, underscoring industrial depth. First-in-region EndoArt implants in elderly patients underscore readiness to adopt artificial solutions when donor tissue proves infeasible. Cost-effectiveness requirements continue to shape purchase decisions but rarely stifle novel, outcome-improving therapies.
Regulatory Landscape
Corneal implants and keratoprostheses fall under stringent medical-device oversight in major markets, with the United States serving as a key reference point for global submissions. Under 21 CFR 886.3400, keratoprostheses are regulated by the US FDA with defined premarket routes (commonly 510(k) with special controls, and PMA or HDE pathways for specific risk profiles or indications). Submissions also require quality and clinical evidence, including IDE oversight for significant-risk investigations.
Compliance expectations extend beyond premarket review into ongoing manufacturing and tissue-handling controls. Device developers typically align biocompatibility and sterilization evidence with ISO 10993 and relevant FDA guidance, while donor-tissue workflows are governed by eye bank medical standards and traceability conventions such as ISBT 128 with ICCBBA registration. In May 2025, the FDA issued an HDE decision for INTACS Corneal Implants (HDE S006) tied to process changes, indicating that supplier updates and cleaning or polishing modifications can trigger additional regulatory review even for established products.
Value Chain Analysis
The corneal implants value chain runs through two parallel supply models, donor tissue and synthetic implants, that converge at the surgical provider. Donor corneal supply starts with recovery organizations and eye banks that screen donors, process and preserve tissue, and distribute grafts to hospitals and ambulatory surgical centers. This pathway is constrained by cold-chain logistics, variable donor availability, and the need for standardized traceability and medical standards. Synthetic corneal implants depend on upstream biomaterial inputs, such as PMMA resins and hydrogel or collagen inputs, followed by specialized device manufacturing, sterilization, and distribution through ophthalmic surgery channels.
Downstream, ophthalmic surgeons and facilities select implant types based on indication and post-op support, with reimbursement mechanics shaping shifts between hospitals and ASCs. Supply-chain resilience is increasingly a procurement theme, as manufacturers and providers dual-source across donor networks and engineered-tissue partners, including CorneaGen for donor tissue and surgical solutions, and bioengineering-focused firms such as BioLattice or decellularized collagen developers such as XENIA and Gebauer Medizintechnik GmbH. On the compliance side, the US FDA Quality Management System Regulation takes effect on February 2, 2026, incorporating ISO 13485:2016 into 21 CFR Part 820, which raises the documentation and process-control bar across design, supplier management, and production for implant manufacturers serving the US market.
Competitive Landscape
Market structure is moderately fragmented: a handful of long-established device makers such as KERAMED INC. and CorNeat Vision anchor the field, while academic institutes like Mass Eye and Ear supply clinical validation for emerging technologies. This balance keeps average selling prices stable and encourages cross-licensing when smaller firms hold critical patents. Heightened regulatory clarity after multiple FDA breakthrough designations now favors firms with robust quality systems, accelerating time-to-market for well-capitalized entrants.
Strategic collaborations illustrate the sector’s adaptive posture. In March 2025 Pantheon Vision paired with Eyedeal Medical to automate lens-blank production and secure diversified PMMA supply lines. EyeYon Medical’s EndoArt synthetic endothelial layer completed a 24-patient first-in-human series that cut average central corneal thickness by 146 µm at 12 months, positioning the device for wider regulatory filings. Pandorum Technologies raised USD 11 million in June 2024 to advance its Kuragenx “Liquid Cornea” hydrogel toward clinical trials, signaling investor confidence in regenerative approaches. These moves highlight how partnerships, clinical milestones and funding rounds remain primary levers for competitiveness rather than price wars.
Technology convergence is reshaping competitive moats. AI-assisted corneal topography now detects keratoconus with 96.06% accuracy, and vendors integrating such software with implant portfolios enjoy stronger surgeon loyalty. Supply-chain resilience has become a differentiator; firms with dual-region polymer sourcing avoided 2024 raw-material shortages that slowed rivals. Intellectual-property filings around collagen cross-link chemistry and injectable hydrogels climbed 18% year-on-year, suggesting that material science advances will dictate future winners. Overall rivalry stays disciplined as companies prioritize evidence-backed innovation over aggressive discounting, sustaining healthy margins for reinvestment in R&D.
Corneal Implants Industry Leaders
-
CorneaGen
-
CorNeat Vision
-
Aurolab
-
KERAMED, INC.
-
LinkoCare LifeSciences AB
- *Disclaimer: Major Players sorted in no particular order
Recent Industry Developments
- January 2026: CorneaGen formalized the acquisition and integration of the Lions Eye Bank of Texas at Baylor College of Medicine. The integration expands regional donor tissue access and operational scale on the US Gulf Coast, supporting more predictable tissue availability and distribution continuity for corneal procedures.
- September 2025: CorNeat Vision released interim findings from the RESEE clinical trial highlighting successful CorNeat KPro implantation in a patient with shingles-induced corneal scarring. The update strengthens the clinical narrative for artificial cornea solutions in complex, untransplantable cases and helps de-risk broader regulatory and commercial pathways.
- June 2024: CorneaGen commercially launched Corneal Tissue Addition for Keratoplasty (CTAK), using gamma-irradiated corneal tissue segments for keratoconus. By standardizing a tissue-based adjunct that can reduce reliance on full donor grafts in select cases, CTAK expands procedural options for surgeons managing keratoconus-related corneal thinning.
Research Methodology Framework and Report Scope
Market Definition and Coverage
For this study, the market is the annual revenue earned from corneal implant products used to replace damaged corneal tissue and restore functional vision, including human donor corneal grafts and synthetic keratoprostheses sold for surgical use across major regions.
Scope exclusions: We exclude corneal diagnostic or measurement devices and post-operative pharmaceuticals, since they are not implant revenues.
Segmentation Overview
- By Implant Type
- Artificial Corneal Implant
- Human Donor Corneal Implant
- By Procedure Type
- Endothelial Keratoplasty
- Penetrating Keratoplasty
- Anterior Lamellar Keratoplasty
- Intrastromal Corneal Ring Segment Implantation
- By Disease Indication
- Keratoconus
- Fuchs’ Dystrophy
- Infectious Keratitis
- Corneal Ulcers
- Corneal Edema
- Other Indications
- By End User
- Hospitals
- Ambulatory Surgical Centers
- Ophthalmic Specialty Clinics
- Others
- By Material
- Collagen-based Biomaterials
- PMMA & Other Polymers
- Hydrogels & Hydrophilic Acrylic
- Others
- Geography
- North America
- United States
- Canada
- Mexico
- Europe
- Germany
- United Kingdom
- France
- Italy
- Spain
- Rest of Europe
- Asia-Pacific
- China
- Japan
- India
- Australia
- South Korea
- Rest of Asia-Pacific
- Middle East and Africa
- GCC
- South Africa
- Rest of Middle East and Africa
- South America
- Brazil
- Argentina
- Rest of South America
- North America
Data Sources, Market Sizing, and Validation
Desk Research
Desk research starts by mapping the clinical and supply context that sits behind implant demand, before any numbers are modeled. We leaned on reputable public sources such as the World Health Organization and the U.S. Centers for Disease Control and Prevention for eye health burden signals, and the U.S. National Library of Medicine for peer-reviewed evidence on transplant techniques and outcomes.
To keep the model grounded in real access and throughput, we also reviewed public information from eye bank and transplant community sources such as the Eye Bank Association of America, along with government and hospital statistics portals where surgical volumes and service capacity indicators are published. For market context, we complemented this with company filings, investor presentations, regulatory and policy notes, and a paid subscription for company financials and intelligence, plus a patent database view to track technology direction. These are illustrative examples, and many other public sources were also used to collect, validate, and clarify inputs.
Primary Interviews and Surveys
Primary work was used to pressure-test the demand pool and the price logic, especially where published surgery counts and graft availability do not line up cleanly across regions. We interviewed a mix of eye care providers, eye bank aligned stakeholders, and industry participants to confirm procedure mix shifts, adoption of synthetic options, and typical purchasing pathways across APAC, EMEA, and the Americas.
Distribution of primary research fieldwork respondents
| Company type | Respondent position | Region |
|---|---|---|
| Top tier: 25% | CXOs: 17% | APAC: 40% |
| Mid tier: 55% | Functional/Unit leaders: 28% | EMEA: 33% |
| Smaller Players: 20% | Managers: 55% | Americas: 27% |
Market-Sizing & Forecasting
Sizing was built using top-down and bottom-up logic together, so the final totals stay explainable and repeatable. On the top-down side, we reconstructed the demand pool by linking corneal transplant activity and procedure mix to the addressable implant volume in each region, followed by applying region-appropriate average selling price ranges that reflect the typical procurement setting.
The totals were then corroborated using selective bottom-up checks, such as sampling supplier revenue disclosures, cross-checking implied volumes from installed clinical capacity, and sanity-checking pricing against what providers reported for donor tissue handling and synthetic keratoprosthesis purchases. When a country had thin public data, we filled gaps using proxy indicators like transplant center density, relative surgical access, and regional uptake patterns shared by interviewees, and then we rechecked the output against known clinical constraints.
For forecasting, scenario analysis was used so the outlook reflects how sensitive growth is to graft supply, adoption of newer synthetic options, and changes in procedure preference (for example, shifts toward endothelial keratoplasty where relevant). Inputs that were tracked as model drivers included corneal blindness and corneal disease burden signals, transplant procedure throughput, donor tissue availability trends, pricing progression for implant products, and regional access to specialized ophthalmic surgery.
Data Validation & Update Cycle
Validation was done through multiple passes, where outputs were compared against independent signals such as transplant activity patterns, public eye bank capacity references, and the pricing ranges confirmed during interviews. If a region showed an unusual jump in implied volume or value, the assumption set was reopened and respondents were re-contacted to confirm whether the variance was real or driven by a modeling artifact.
Before sign-off, the dataset and calculations go through analyst reviews that check arithmetic, consistency of unit conversions, and whether the final scope still matches the written market definition. Reports refresh annually, and interim updates are triggered when a material event changes access, pricing, or surgical throughput. Right before delivery, we do a final check so clients receive the most current view available.
Mordor Intelligence's Global Corneal Implants Market Estimate Compared With Other Published Estimates
Published market sizes for corneal implants often vary because groups count different revenue buckets, use different procedure volume anchors, or assume different price paths for donor versus synthetic options. Differences also show up when one estimate is updated more recently than another, especially during periods where procedure recovery or reimbursement shifts are still playing out.
The main gap comes from whether donor tissue handling and distribution charges are counted as part of the implant value, where Mordor Intelligence includes finished implant revenues for human donor grafts and synthetic keratoprostheses, but keeps diagnostics equipment and post-operative drugs out of scope to avoid mixing device and non-device spend.
Benchmark comparison
| Source | Market Size | Gaps in Research Methodology |
|---|---|---|
| Mordor Intelligence | USD 514.69 M (2026) | |
| Trade Journal A | USD 439.80 M (2023) | Uses an earlier base year and tends to anchor totals to reported transplant activity without fully adjusting for regional price dispersion and the split between donor grafts and synthetic keratoprostheses. |
| Global Consultancy B | USD 795.66 M (2025) | Appears to apply a broader revenue capture and a faster adoption curve, which can overstate near-term value if tissue-related service charges or adjacent ocular implant items are blended into the corneal implant total. |
The spread across the three figures is largely explained by what gets counted as implant revenue and how quickly pricing and adoption are assumed to move by region. By keeping the demand build tied to procedure throughput and realistic price ranges, and then checking the totals against supplier and provider signals, the estimate stays traceable to inputs that can be repeated and updated.
Key Questions Answered in the Report
What is the current value of the corneal implants market?
The corneal implants market reached USD 514.69 million in 2026 and is on course to hit USD 694.62 million by 2031.
Which region is growing fastest for corneal implant procedures?
Asia-Pacific is expanding at an 7.7% CAGR thanks to rising healthcare access and a high burden of untreated corneal blindness.
Why are artificial corneas gaining traction?
Synthetic devices bypass donor shortages, offer shelf stability up to two years, and have shown durable clinical outcomes in early trials.
Which surgical technique is seeing the quickest uptake?
Endothelial keratoplasty, especially DMEK, is advancing at 6.9% CAGR due to superior vision recovery and lower rejection risk.
How are ambulatory surgical centers influencing the market?
ASCs provide cost-efficient, same-day corneal procedures and are growing 7.35% annually, shifting volume away from hospitals.