
Market Overview
| Study Period | 2020 - 2031 |
|---|---|
| Market Size (2026) | USD 78.39 Billion |
| Market Size (2031) | USD 95.19 Billion |
| Growth Rate (2026 - 2031) | 3.96 % |
| Fastest Growing Market | Asia Pacific |
| Largest Market | Asia-Pacific |
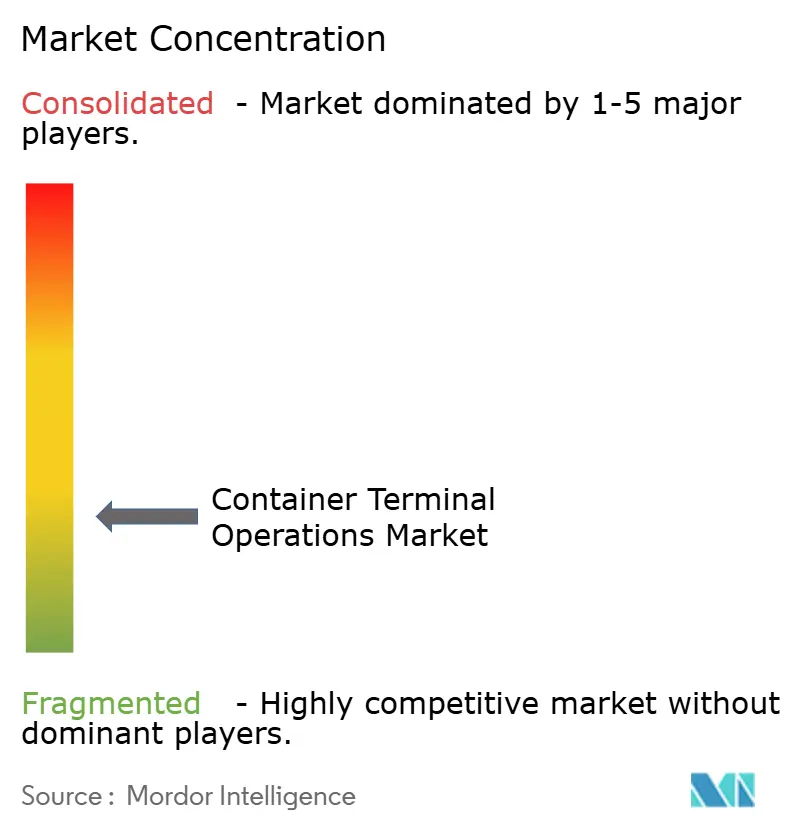
| Market Concentration | Low |
Major Players *Disclaimer: Major Players sorted in no particular order Image © Mordor Intelligence. Reuse requires attribution under CC BY 4.0. | |
Container Terminal Operations Market Analysis by Mordor Intelligence
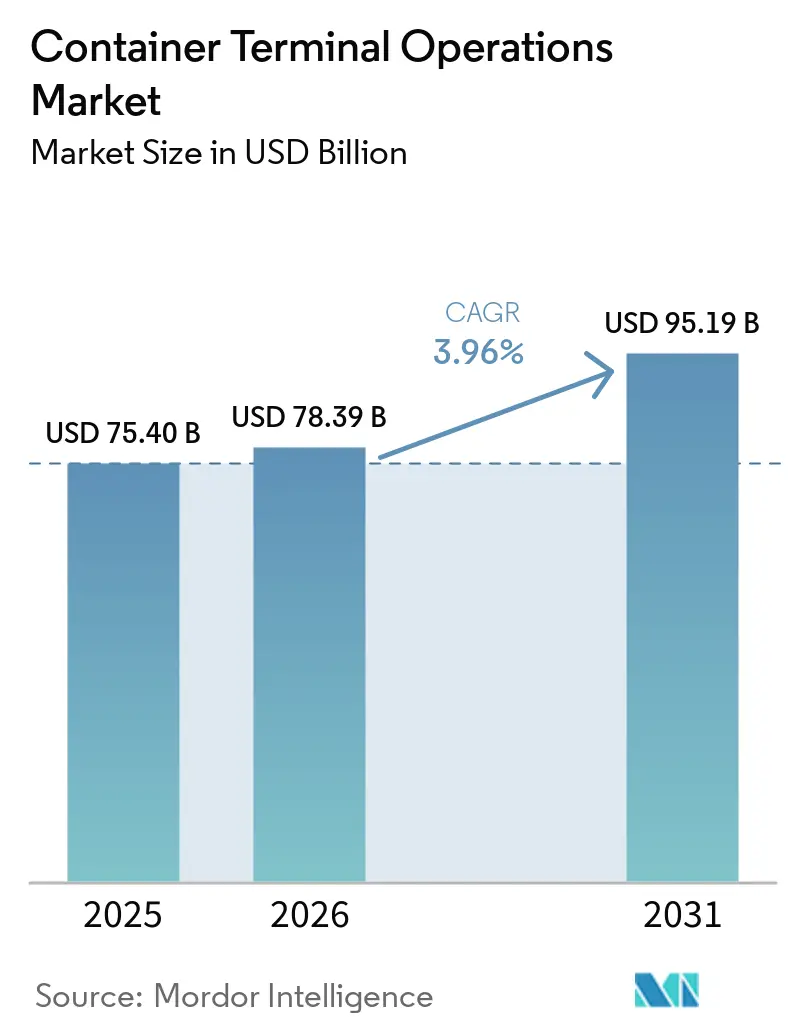
The Container Terminal Operations Market size was valued at USD 75.40 billion in 2025 and estimated to grow from USD 78.39 billion in 2026 to reach USD 95.19 billion by 2031, at a CAGR of 3.96% during the forecast period (2026-2031).
Robust demand for trade-facilitating infrastructure, the arrival of container vessels above 18,000 TEU, and steady investment in digital automation underpin this trajectory. Stevedoring revenues remain dominant, but rapid growth is shifting toward transportation and value-added logistics as operators extend inland. Asia-Pacific retains leadership with 41% 2024 share, supported by 52 fully automated Chinese ports and continuing public investment Business-Standard. Consolidation is gathering pace as operators chase scale advantages, while ESG-linked financing is lowering capital costs for greener equipment Maersk.
Key Report Takeaways
- By service, stevedoring led with 41.62% of container terminal operations market share in 2025; transportation services are projected to log the fastest 3.98% CAGR through 2031.
- By ownership model, state-owned facilities held 50.55% share in 2025, whereas public-private partnerships are advancing at a 4.62% CAGR.
- By automation level, manual terminals still accounted for 68.41% share in 2025, yet fully automated sites are expanding at a 4.02% CAGR.
- By container type, general boxes commanded 60.44% share in 2025, while reefer throughput is forecast to accelerate at 4.29% CAGR.
- Geographically, Asia-Pacific captured 40.72% share in 2025 and is on track for the fastest 4.52% CAGR to 2031.
Note: Market size and forecast figures in this report are generated using Mordor Intelligence’s proprietary estimation framework, updated with the latest available data and insights as of 2026.
Global Container Terminal Operations Market Trends and Insights
Drivers Impact Analysis*
| Driver | % Impact on CAGR Forecast | Geographic Relevance | Impact Timeline |
|---|---|---|---|
| Surge in mega-vessel deployments (≥18k TEU) | +0.8% | Global, with concentration in Asia-Pacific and Europe | Medium term (2-4 years) |
| Digitised supply-chain visibility demands from BCOs | +0.6% | Global, led by North America and Europe | Short term (≤ 2 years) |
| Government-led port capacity expansions | +0.9% | Asia-Pacific core, spill-over to MEA and South America | Long term (≥ 4 years) |
| Near-shoring fuelling intra-regional feeder volumes | +0.5% | North America, Europe, with emerging impact in Asia-Pacific | Medium term (2-4 years) |
| ESG-linked financing lowering cost of green terminal upgrades | +0.4% | Global, with early adoption in Europe and North America | Long term (≥ 4 years) |
| Emerging Arctic sea-route creating new hub requirements | +0.2% | Northern Europe, Russia, with connectivity to Asia-Pacific | Long term (≥ 4 years) |
| Source: Mordor Intelligence | |||
Surge in Mega-Vessel Deployments Reshaping Terminal Infrastructure
Record-size ships intensify berth depth, crane outreach, and yard capacity demands. Qingdao’s automated dock moved 60.6 boxes per crane-hour in December 2024, more than double conventional productivity. Peaks created by fewer but larger calls are prompting mid-tier operators to justify automation even at modest volumes. PSA’s SGD 20 billion Tuas Port fully automated and slated for 65 million TEU embodies this mega-vessel-ready blueprint. Smaller Asian and European gateways are now vying for cascading 14,000 TEU ships, which strains conventional layouts and accelerates retrofit programs. As equipment makers bundle AI platforms with hardware, payback periods narrow, further embedding automation into the container terminal operations market[1]“Chinese Ports Get Smarter with Automation Push,” CGTN, cgtn.com.
Digitized Supply-Chain Visibility Demands Transform Operations
Shippers insist on real-time container milestones, pushing terminals to roll out IoT-enabled cranes, yard vehicles, and gate systems. APM Terminals fitted 2,500+ assets with sensors by 2024, delivering predictive maintenance and live status feeds. Standardized APIs now integrate terminal data directly into cargo-owners’ TMS platforms, shrinking dwell times and paperwork. Computer-vision inspections flag damaged containers automatically, while edge processing slashes latency during peak moves. Competitive edge increasingly stems from data granularity and interoperability rather than berth length alone, encouraging new pricing models based on visibility services in the container terminal operations market[2]“Port AGV Successfully Went to Sea,” TZBotAutomation,tzbotautomation.com.
Government-Led Port Capacity Expansions Drive Long-Term Growth
China’s 14th Five-Year Plan and India’s Sagarmala Program steer double-digit billion-dollar outlays toward deepwater berths, smart yard tech, and green equipment Business-Standard. Brazil will auction 42 concessions through 2026, mobilizing USD 2.37 billion to modernize legacy piers. Such state-backed projects attract ocean carriers seeking reliable hub nodes, which then magnify throughput, justifying the next financing tranche creating a virtuous cycle for the container terminal operations market[3]“APM Terminals Granted the Renewal of the Concession in the Port of New York–New Jersey,” inforMARE, informare.it.
Near-Shoring Fuels Intra-Regional Feeder Network Expansion
Factory relocation toward consumption markets lifts regional feedership volumes. AD Ports Group already fields 49 feeder vessels that touch 78 ports across 28 nations, booking record EBITDA in 2024. Mexican gateways captured double-digit import growth as North-American buyers rerouted away from trans-Pacific corridors. Smaller terminals capitalize on shorter haul cycles but must fine-tune berth productivity to sustain frequent calls. Digital slot-booking and dynamic stowage planning mitigate schedule risk, reinforcing regional supply-chain resilience within the container terminal operations market.
Restraints Impact Analysis*
| Restraint | % Impact on CAGR Forecast | Geographic Relevance | Impact Timeline |
|---|---|---|---|
| Landside congestion & hinterland bottlenecks | -0.7% | Global, particularly acute in North America and Europe | Short term (≤ 2 years) |
| High CAPEX for full automation retrofits | -0.5% | Global, with higher impact in developed markets | Medium term (2-4 years) |
| Geopolitical chokepoint risks (e.g., Bab-el-Mandeb) | -0.4% | Global, with acute impact on Europe-Asia trade routes | Short term (≤ 2 years) |
| Tightening IMO emissions rules impacting diesel equipment ROI | -0.3% | Global, with earlier compliance pressure in Europe and North America | Medium term (2-4 years) |
| Source: Mordor Intelligence | |||
Landside Congestion Constrains Terminal Productivity Gains
Truck shortages, aging rail links, and chassis imbalances erode quay-side gains by throttling gate moves. U.S. Gulf and Atlantic ports extended gate hours in 2025, yet yard density still spiked beyond 90% during import peaks. Operators are funding near-dock rail hubs and inland depots—ventures that require cooperation with multiple agencies and add complexity to the container terminal operations market.
High CAPEX Requirements Limit Automation Adoption
A fully automated greenfield terminal can exceed USD 1 billion, with payback horizons over a decade. Low-volume facilities struggle to clear investment hurdles without throughput guarantees. Vendors have responded with scalable automation modules, but integration risks persist, deterring cash-constrained port authorities. Divergent global labor regulations also complicate cost-benefit appraisals for the container terminal operations market.
*Our forecasts treat driver/restraint impacts as directional, not additive. The impact forecasts reflect baseline growth, mix effects, and variable interactions.
Segment Analysis
By Service – Stevedoring Remains Core While Transportation Accelerates
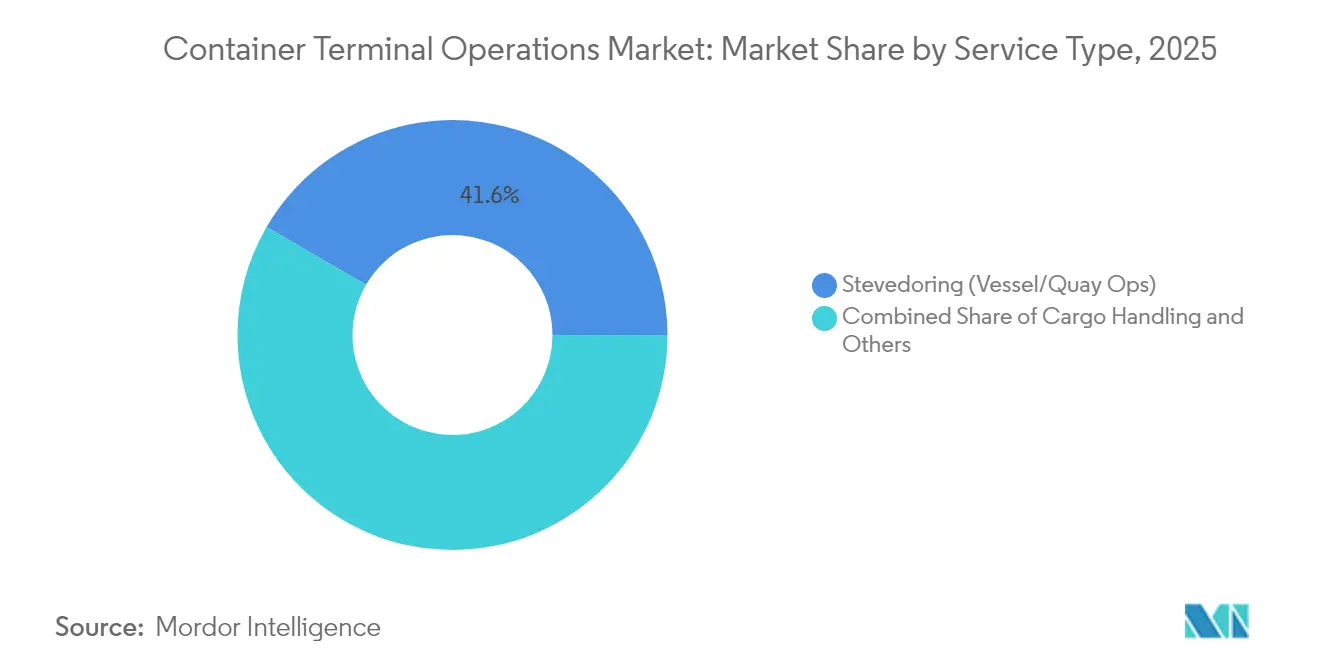
Stevedoring held 41.62% of container terminal operations market share in 2025, reflecting its role as the revenue anchor of vessel-handling activities. Transportation accounted for just 27.45% yet is projected to deliver a 3.98% CAGR, powered by integrated rail and trucking corridors that pull gateways deeper into inland logistics. The container terminal operations market size for transportation services is forecast to reach USD 37.45 billion by 2031, widening margins through bundled door-to-door offerings. Terminals now monetize value-added cargo-care, customs brokerage, and digital scheduling, enhancing customer retention. Simultaneously, cargo-handling services yard moves, plugging reefers, and hazardous storage provide a resilient mid-tier revenue cushion.
The shift toward inland control reflects strategic bets on diversified income streams and tighter customer intimacy. Operators deploy TOS-linked truck appointment modules and RFID gate systems that cut motor-carrier waits by up to 40 minutes. Growing e-commerce import volumes further spur transload facilities adjacent to quays. As near-shoring gains steam, regional transportation networks become decisive competitive levers in the broader container terminal operations market.


By Ownership Model – PPP Momentum Challenges State Dominance
State entities controlled 50.55% of global throughput in 2025, but public-private partnerships are pacing at 4.62% CAGR, aligned with sovereign goals for efficiency and capital relief. The container terminal operations market size under PPP frameworks is projected to top USD 42.1 billion by 2031, reflecting multi-decade concession pipelines in Africa, Latin America, and South Asia. PPP deals often embed performance covenants that drive technology adoption faster than purely state-run siblings, reinforcing a virtuous circle of reinvestment.
Large operators leverage cross-portfolio synergies in procurement, training, and data analytics, raising entry barriers for smaller independents. Meanwhile, transparent tender rules and improved dispute-resolution mechanisms entice institutional investors seeking infrastructure-linked yields. This convergence of policy incentives and private capital accelerates transfer of modern practices across the container terminal operations industry.
By Automation Level – Manual Terminals Persist Yet Full Automation Gains Ground
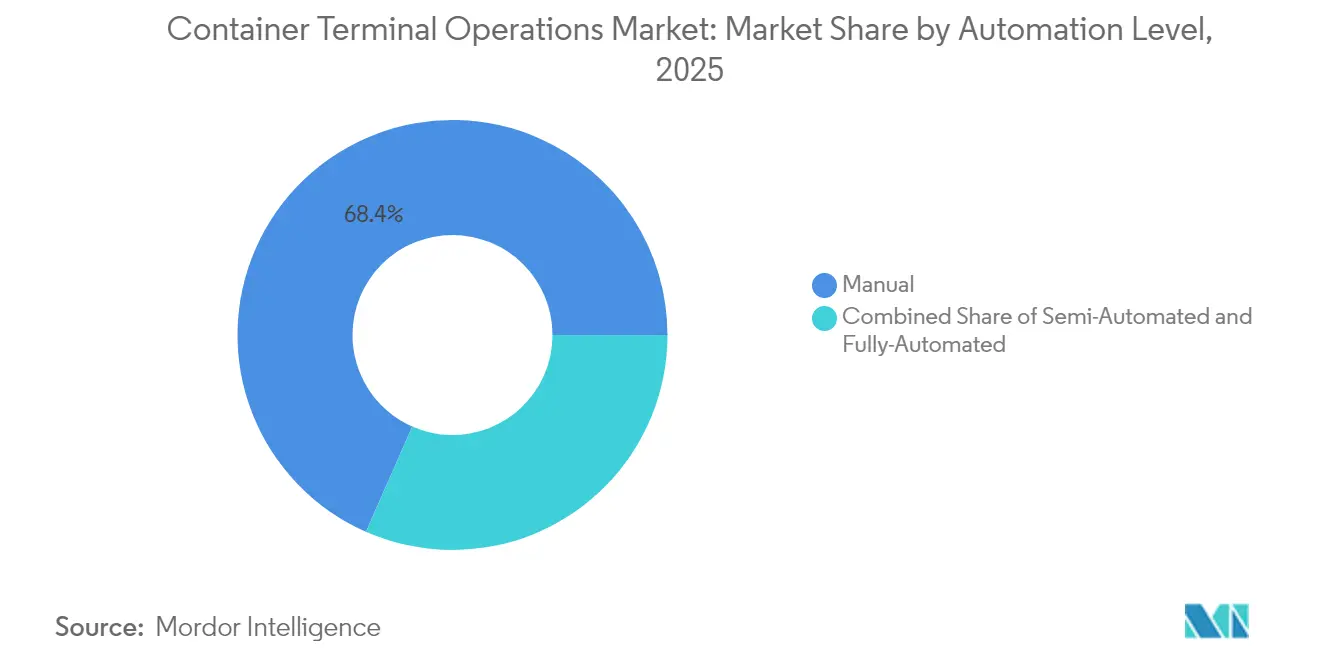
Manual sites still represent 68.41% of active terminals, but fully automated facilities are expanding at 4.02% CAGR through 2031. The container terminal operations market size for automated systems is projected to exceed USD 23.1 billion by 2031 as operators chase labor savings and safer environments. China alone counted 52 robotic ports by late 2024, showcasing AI-guided quay cranes, autonomous container carriers, and 5G mesh networks.
Semi-automation remains an on-ramp for mid-volume berths, typically starting with auto-gates and remote-controlled RTGs, balancing productivity and cost. Equipment suppliers now bundle lifecycle software updates and cyber-security patches, lowering integration hurdles. The rise of ESG-linked loans at favorable rates is tilting project economics further toward full digitalization, reshaping competitive hierarchies within the container terminal operations market.
By Container Type – General Cargo Dominates, Reefer Segment Outpaces
General-purpose boxes generated 60.44% of 2025 moves, reflecting the ubiquity of dry consumer goods. Yet reefer lifts are forecast to compound at 4.29% CAGR, fueled by global vaccine flows, perishable food demand, and stricter cold-chain governance. Reefer-focused terminals command higher unit revenues thanks to electricity surcharges and monitoring fees. Some Asian hubs now allocate dedicated reefer berths with plug-in densities above 1,200 sockets, securing pharmaceutical traffic.
OOG/project cargo and IMO-classified dangerous goods remain niche slices yet command premium tariffs and deepen customer reliance. AI-enabled yard planning optimizes stowage for over-dimension boxes, reducing double-handling. Collectively, these specialized moves reinforce revenue diversity and resilience across the container terminal operations industry.
Geography Analysis
Asia-Pacific contributed 40.72% of 2025 throughput and is poised for a 4.52% CAGR through 2031, bolstered by Chinese mega-hub construction, India’s Sagarmala roll-out, and Southeast Asia’s green-field projects. The region’s container terminal operations market size for automated facilities is projected to double by 2030, anchored by Singapore’s multiphase Tuas investment and Malaysia’s Port Klang expansion. National governments subsidize electrified yard equipment and mandate carbon-neutral targets, reinforcing Asia-Pacific’s innovation edge.
North America and Europe present mature gateways in container terminal operations market, where modernization, digital twins, and emissions compliance take precedence. APM Terminals’ USD 500 million Elizabeth project in New York-New Jersey introduces hybrid straddle carriers and solar canopies, reflecting tighter regional regulations. European terminals experienced Red Sea reroutings in 2024, highlighting the need for flexible berth scheduling and multi-directional rail corridors to mitigate supply-chain shocks.
Middle East & Africa and South America constitute emergent growth zones. AD Ports Group’s USD 251 million Luanda modernization and USD 250 million Pointe-Noire financing demonstrate rising foreign capital appetite. Brazil’s concession wave targets greener cranes and longer quay walls, aiming to lift regional competitiveness. These investments cultivate diversified trade routes, lowering dependency on traditional East-West corridors and supporting incremental gains for the container terminal operations market.
Regulatory Landscape
Regulation affecting container terminal operations is tightening around security, competition and State-aid, and decarbonization, and compliance is increasingly shaping concession terms and terminal upgrade timing. In the European Union, climate-policy instruments such as EU ETS Maritime and FuelEU Maritime raise the operating and compliance stakes for vessel calls at EU ports, pushing terminals to align equipment electrification and energy-management plans with carrier requirements and port authority targets.
Policy frameworks are also shaping investment feasibility and ownership structures. The European Commission, in March 2026, set out work that includes reviewing the General Block Exemption Regulation (GBER) to improve legal clarity for public support to port infrastructure, while economic-security measures have increased focus on screening foreign investment and monitoring ownership and control in strategic assets such as ports. In parallel, Commission Implementing Regulation (EU) 2025/1127 clarifies neighboring container transhipment ports for exclusions related to port-of-call requirements under Regulation (EU) 2023/1805, affecting how certain services are classified and administered at EU port calls.
Value Chain Analysis
The container terminal operations value chain spans port governance and concessioning (landlord port authorities and state entities), terminal developers and operators (state-owned, PPP, and private), equipment and technology suppliers (STS cranes, RTGs, yard tractors and AGVs, TOS and visibility platforms), and downstream connectivity providers (rail, trucking, depots, and inland terminals). The highest value-add concentrates at seaside operations (berthing, quay crane moves, and yard orchestration) and in landside coordination where gates, rail interfaces, and appointment systems determine end-to-end dwell-time performance.
Operator strategies increasingly link the terminal node with foreland and hinterland flows through vertical integration and data interoperability. Shipping lines and global terminal operators are extending control across terminals and inland logistics to stabilize service quality and costs, supported by partnerships such as the DP World and APM Terminals collaboration at Jeddah Islamic Port. At the operational layer, data-sharing initiatives (including watch-tower style visibility programs) and automation programs (including APM Terminals Maasvlakte II upgrades with automated terminal tractors) connect cargo owners, carriers, and landside partners around common milestones, predictive maintenance, and emissions tracking, increasing the monetization potential of value-added digital services beyond basic stevedoring.
Competitive Landscape
Global operators such as PSA International, APM Terminals, and Hutchison Ports collectively control more than half of world throughput, yielding moderate concentration. Scale unlocks procurement leverage, integrated TOS platforms, and cross-regional customer packages, but rising PPP concessions invite region-specific challengers. CMA CGM’s purchase of Santos Brasil assets and AD Ports Group’s African portfolio show how acquisitions extend network reach and market power.
Automation acts as a strategic moat: early adopters report 25% lower per-move labor costs and 15% higher crane productivity. Vendors like ZPMC and Kalmar partner with software specialists to deliver “terminal-as-a-service” models that bundle hardware, analytics, and maintenance under multiyear contracts. ESG mandates further stratify players; those able to tap green finance at discount rates can front-load electrification, reinforcing customer appeal.
Regulatory harmonization is progressing, with ISO 14001 and ISPS certifications becoming table stakes for major carrier calls. The convergence of technology, finance, and regulation is sharpening competitive boundaries and establishing new benchmarks in the container terminal operations market.
Container Terminal Operations Industry Leaders
APM Terminals (A. P. Moller-Maersk)
PSA International
Hutchison Ports
DP World
COSCO Shipping Ports
- *Disclaimer: Major Players sorted in no particular order

Market Opportunities and Future Outlook
A major whitespace sits in frontier-market capacity buildouts and modernization where governments are using concession pipelines to attract private capital and operating capability. Evidence of this shift includes rising capex intensity among major operators and an observed tilt toward Africa and South Asia projects, alongside large-scale greenfield commitments such as the APM Terminals and Hateco Group agreement to develop Lien Chieu Container Port in Da Nang, Vietnam (over USD 1.7 billion, with target capacity exceeding 5.7 million TEU). These programs broaden the addressable set of PPP and long-dated concessions, supporting opportunities for operators with repeatable design, procurement, and ramp-up playbooks.
A second opportunity area centers on data-driven, low-carbon operations tied to shipper visibility demands and emissions governance. With global container port throughput reported at 994 million TEU in 2025 (up 6.5%), operators that can standardize APIs, integrate inland appointment and rail interfaces, and provide verifiable emissions and milestone reporting can build services revenue on top of quay moves. In parallel, large multi-asset terminal development proposals, such as the Panama Canal Authoritys advancement of Corozal and Telfers transhipment terminals (estimated USD 2.6 billion investment), show how new hubs and expansions are being framed around scale, connectivity, and resilience, increasing demand for experienced operators and technology suppliers able to deliver high-throughput, compliant, and cyber-secure terminal systems.
Recent Industry Developments
- April 2026: APM Terminals and Hateco Group signed an agreement to develop the Lien Chieu Container Port in Da Nang, Vietnam. The project carries an estimated investment over USD 1.7 billion and targets capacity over 5.7 million TEU. This expands regional capacity and greenfield footprint in Southeast Asia, extending APM Terminals' network reach.
- February 2026: DP World and APM Terminals announced a strategic partnership for operations at Jeddah Islamic Port. The collaboration leverages cross-network integration and scale at a key Red Sea gateway. The partnership strengthens competitive positioning in regional transshipment.
- February 2026: APM Terminals was appointed as temporary operator for Balboa port in Panama following the annulment of CK Hutchison concession. The transition period is set for up to 18 months. The arrangement shifts Panama capacity governance in the short term and affects regional throughput dynamics.


Research Methodology Framework and Report Scope
Market Definition and Coverage
For this methodology, the market covers revenues earned from operating container terminals at seaports, including core activities like vessel-to-shore handling, yard operations, and related terminal-side services that support container flow through the port.
Scope exclusions: We exclude ocean freight services, inland trucking or rail line-haul outside the terminal, ship agency, and non-container bulk terminal operations.
Segmentation Overview
- By Service
- Stevedoring (Vessel/Quay Ops)
- Cargo Handling
- Transportation
- Other Services
- By Ownership Model
- State-Owned
- Public-Private Partnership
- Private / Independent
- By Automation Level
- Manual
- Semi-Automated
- Fully Automated
- By Container Type
- General
- Reefer
- OOG / Project
- Dangerous Goods (DG)
- By Geography
- North America
- United States
- Canada
- Mexico
- South America
- Brazil
- Peru
- Chile
- Argentina
- Rest of South America
- Asia-Pacific
- India
- China
- Japan
- Australia
- South Korea
- South East Asia (Singapore, Malaysia, Thailand, Indonesia, Vietnam, and Philippines)
- Rest of Asia-Pacific
- Europe
- United Kingdom
- Germany
- France
- Spain
- Italy
- BENELUX (Belgium, Netherlands, and Luxembourg)
- NORDICS (Denmark, Finland, Iceland, Norway, and Sweden)
- Rest of Europe
- Middle East and Africa
- United Arab of Emirates
- Saudi Arabia
- South Africa
- Nigeria
- Rest of Middle East And Africa
- North America
Data Sources, Market Sizing, and Validation
Desk Research
Desk research was used to map the demand pool and operating context of container terminals before building the model. We relied on public references such as UNCTAD port and maritime trade statistics, World Bank logistics and trade indicators, International Maritime Organization publications, and data tables from the International Association of Ports and Harbors.
To keep assumptions anchored at the terminal level, we also reviewed sources such as port authority annual reports, regulator tariff schedules, investor presentations, and audited financial statements of listed operators. In addition, we used paid subscriptions for company financials and news intelligence, plus shipment-level import and export records in selected trade lanes to sanity check volume direction and mix. This list is not exhaustive, and many other public sources were used for data collection, validation, and clarification.
Primary Interviews and Surveys
Primary work was used to validate which revenue streams are consistently captured as terminal-operator income and how pricing moves with volume, congestion, and contract terms. We spoke with a mix of terminal operators, port stakeholders, shipping and logistics users, and equipment and service partners across major trade regions. We then used that feedback to close data gaps and confirm the final assumptions.
Distribution of primary research fieldwork respondents
| Company type | Respondent position | Region |
|---|---|---|
| Top tier: 30% | CXOs: 19% | APAC: 45% |
| Mid tier: 48% | Functional/Unit leaders: 37% | EMEA: 33% |
| Smaller Players: 22% | Managers: 44% | Americas: 22% |
Market-Sizing & Forecasting
Sizing started from a top-down build that reconstructs the addressable revenue pool from container port handling activity, and then ties that activity to typical terminal charges by service type. In practice, TEU throughput direction by region, berth productivity and dwell-time patterns (as a proxy for storage intensity), average tariff schedules, the split of gateway versus transshipment volumes, and automation-driven cost and pricing signals were used as key inputs that shape the value outcome.
Those totals were corroborated through selective bottom-up approximations, mainly by rolling up sampled operator revenues in key regions and stress-testing implied revenue per TEU against what interviews suggested is typical under different contract formats. When financial disclosures were incomplete or bundled with other port services, we applied conservative allocation rules informed by port disclosures and cross-checks, and then revisited the ranges during analyst review.
For forecasting, we used scenario analysis linked to a small set of drivers that stakeholders can explain and track, such as global container trade growth expectations, fleet upsizing effects on call sizes, planned capacity additions, and expected changes in congestion and storage revenue normalization. The final forward path was selected after primary feedback aligned the driver ranges with how terminals and port users expect pricing and utilization to move over the cycle.
Data Validation & Update Cycle
Validation was done through multiple checks that compare model output with independent signals, then isolate the reason when variances appear. We tested implied revenue per TEU by region, checked year-on-year movements against throughput growth and known disruption periods, and reviewed whether the service-mix shifts used in the model matched interview feedback.
Before sign-off, the numbers go through a step-by-step analyst review where assumptions, conversions, and regional totals are rechecked. Outliers trigger re-contact with sources when needed. Reports are refreshed annually, and interim updates are made if a material event changes volumes, pricing, or capacity expectations. Right before delivery, an analyst performs a fresh pass so clients receive the latest updated view.
Mordor Intelligence's Global Container Terminal Operations Market Size Versus Other Published Estimates
Published market sizes for container terminal operations can differ even when they look like they cover the same activity, because the service scope, time base, and what is counted as terminal revenue are not handled the same way. Differences also come from how studies treat storage and other ancillary income during congestion cycles, and whether values are normalized or left as reported for an unusual year.
Some external estimates expand the pool to include broader marine terminal activity or port-side services that sit outside container terminal operations, which pushes the value upward. In this Mordor Intelligence approach, revenue is counted only when it is tied to container terminal operating services (such as stevedoring and terminal-side cargo handling), and ocean freight, inland line-haul, and non-container terminals are kept out to prevent double counting.
Benchmark comparison
| Source | Market Size | Gaps in Research Methodology |
|---|---|---|
| Mordor Intelligence | USD 78.39 B (2026) | |
| Industry Database A | USD 83.10 B (2025) | Often described as marine plus container terminal operations, which can pull in non-container terminal activity and related port services, and it also uses a different base year than this study. |
| Trade Journal B | USD 75.50 B (2024) | Uses an earlier reference year and may reflect a lower-demand point in the cycle, and its definition emphasizes handling and intermodal movement, which can undercount ancillary terminal income like storage during congestion periods. |
Overall, the spread is mainly explained by scope expansion into adjacent port activities on one side, and earlier-year normalization choices on the other side. By keeping the value traceable to throughput-linked terminal services and then checking implied revenue per TEU against operator disclosures and interviews, the estimate stays repeatable and easier to audit when assumptions are updated.


Key Questions Answered in the Report
What is the 2026 value of the container terminal operations market?
The market stands at USD 78.39 billion in 2026, supported by mega-vessel calls and growing automation deployments.
How fast will global terminal revenues grow through 2031?
Revenues are projected to expand at a 3.96% CAGR, reaching USD 95.19 billion by 2031.
Which region leads current throughput?
Asia-Pacific accounts for 40.72% of 2025 volume, aided by extensive Chinese and Southeast Asian capacity expansions.
Which service segment is growing quickest?
Transportation services tied to inland logistics are forecast for a 3.98% CAGR, outpacing traditional stevedoring.
What share do automated terminals hold today?
Fully automated sites represent 31.59% of global facilities, but they are advancing at 4.02% CAGR as capital costs fall.
How are ESG mandates influencing investment?
Access to lower-cost, sustainability-linked loans is accelerating electrification and green equipment adoption across major hubs.
Page last updated on:


 Your data is secure and never sold or shared.


