
Container Shipping Market Size and Share
Market Overview
| Study Period | 2020 - 2031 |
|---|---|
| Market Size (2026) | USD 123.14 Billion |
| Market Size (2031) | USD 142.07 Billion |
| Growth Rate (2026 - 2031) | 2.92 % |
| Fastest Growing Market | Asia Pacific |
| Largest Market | Asia Pacific |
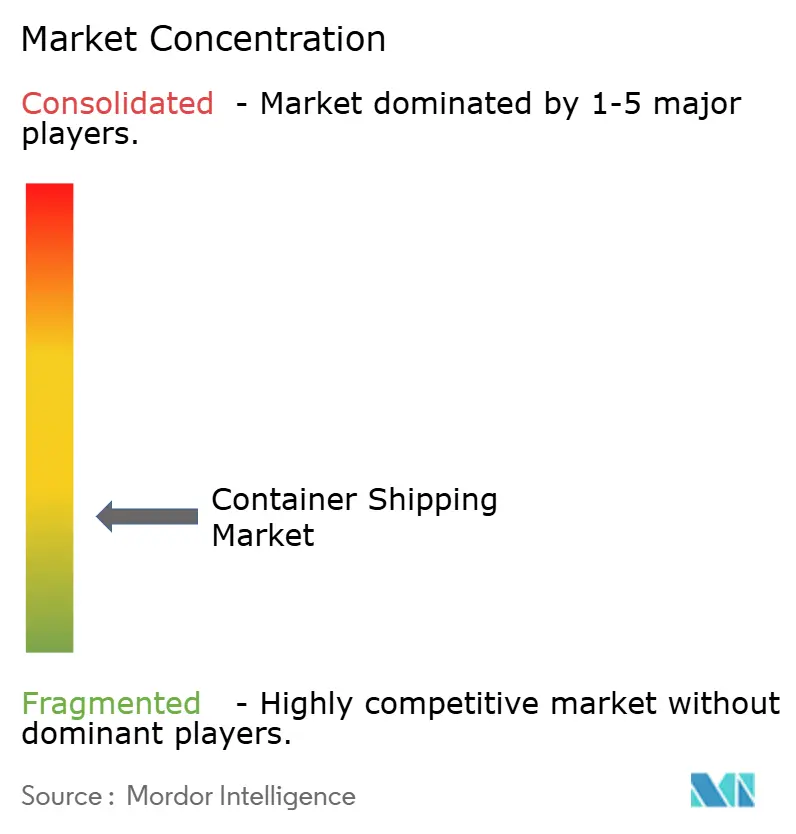
| Market Concentration | Low |
Major Players *Disclaimer: Major Players sorted in no particular order Image © Mordor Intelligence. Reuse requires attribution under CC BY 4.0. | |
Container Shipping Market Analysis by Mordor Intelligence
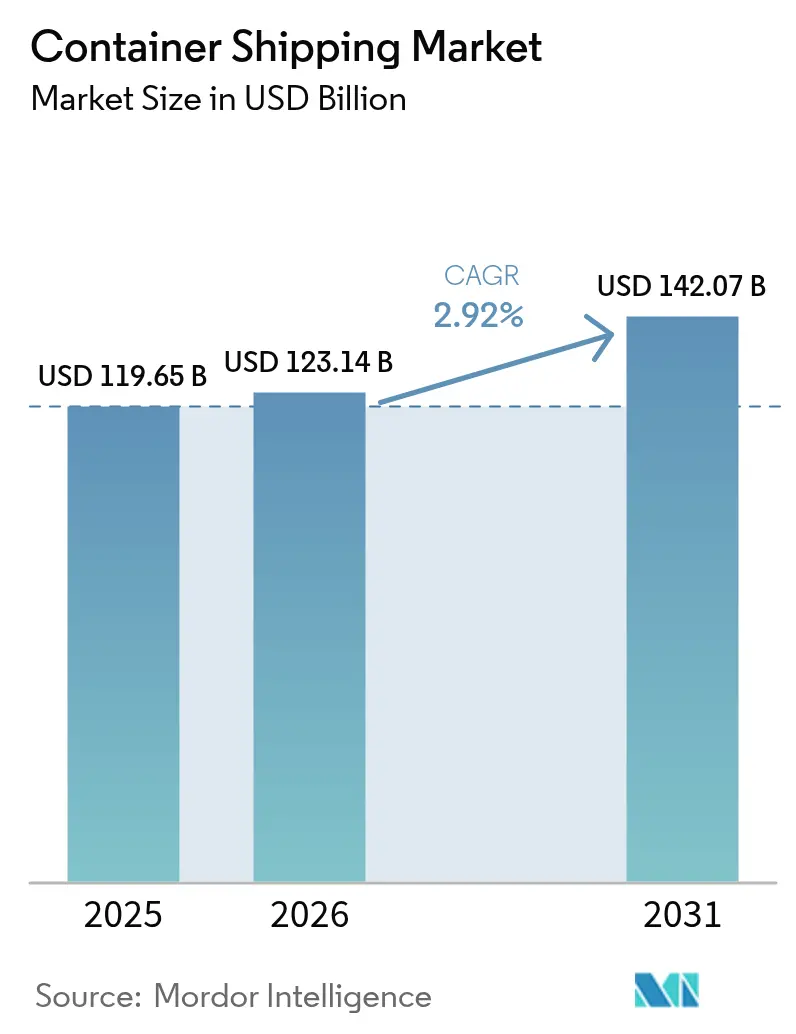
The Container Shipping Market size is expected to grow from USD 119.65 billion in 2025 to USD 123.14 billion in 2026 and is forecast to reach USD 142.07 billion by 2031 at 2.92% CAGR over 2026-2031.
Slower fleet-wide speed, ongoing Red Sea diversions, and an expanded regulatory cost base are moderating supply even as trade agreements and e-commerce replenish underlying demand. Carriers are concentrating on network reliability, with new alliance formations targeting on-time performance above 90% while reallocating capacity toward the most resilient corridors. Terminal ownership continues to rise as a defensive hedge against landside congestion and as a lever to capture new revenue pools. Fuel cost volatility remains the primary profitability swing factor, yet dual-fuel newbuild orders and incremental efficiency upgrades are gradually lowering per-unit emissions and bunker consumption. Against this backdrop, the container shipping market is transitioning from rate-driven earnings to efficiency-driven returns as technology adoption and environmental compliance reshape operating models.
Key Report Takeaways
- By container size, 40-foot units captured 50.62% of container shipping market share in 2025, and the segment is projected to post a 3.74% CAGR to 2031.
- By container type, reefer containers are expected to expand at a 3.36% CAGR through 2031, outpacing general-purpose boxes thanks to pharmaceutical and fresh produce demand.
- By service, Full-Container-Load accounted for 76.25% of the container shipping market size in 2025 and is forecast to advance at a 3.12% CAGR during 2026-2031.
- By end-user, the FMCG and retail segment led with 26.45% share in 2025; healthcare and pharmaceuticals is projected to record a 3.62% CAGR to 2031.
- By geography, Asia-Pacific held 40.55% of 2025 revenue and is anticipated to maintain the fastest regional growth at a 4.12% CAGR through 2031, supported by intra-Asian trade integration and port capacity additions.
Note: Market size and forecast figures in this report are generated using Mordor Intelligence’s proprietary estimation framework, updated with the latest available data and insights as of 2026.
Market Trends and Insights
Drivers Impact Analysis of Container Shipping Market*
| Driver | (~) % Impact on CAGR Forecast | Geographic Relevance | Impact Timeline |
|---|---|---|---|
| Rising volume of international trade | +0.8% | Global | Medium term (2-4 years) |
| Expansion of free-trade agreements | +0.4% | EU-Mercosur, USMCA regions | Long term (≥ 4 years) |
| Rapid e-commerce containerization | +0.6% | North America, Asia-Pacific | Short term (≤ 2 years) |
| IMO 2023 carbon regulations drive renewal | +0.5% | Global | Medium term (2-4 years) |
| Arctic route viability | +0.2% | Northern Europe, Asia-Pacific | Long term (≥ 4 years) |
| AI-enabled predictive routing & scheduling | +0.3% | Global | Short term (≤ 2 years) |
| Source: Mordor Intelligence | |||


Rising Volume of International Trade
World merchandise trade is recovering on the back of stabilizing consumer spending and restocking cycles, prompting carriers to redeploy idle capacity onto North American and Mediterranean gateways. Longer voyage distances caused by Red Sea detours have temporarily absorbed excess tonnage, protecting rate integrity even as new vessels deliver. Port call data show double-digit throughput rebounds at U.S. East Coast hubs, highlighting the flexibility of the container shipping market to redirect flows quickly. Equipment repositioning costs have increased, yet higher backhaul utilization is offsetting part of the burden. The durability of trade growth remains linked to household purchasing power and to how swiftly geopolitical flashpoints normalize.
Expansion of Free-Trade Agreements
The EU–Mercosur deal, concluded in December 2024, is set to unlock EUR 56 billion (USD 61.80 billion) in additional goods trade and reshape South Atlantic services[1]“EU–Mercosur Trade Agreement,” European Commission, europa.eu . Carriers that already control terminals in Santos and Buenos Aires are preparing dedicated loops to capture origin-destination volumes that were traditionally transshipped in the Caribbean. Simultaneously, USMCA provisions are reinforcing North American near-shoring, a trend visible in the rising share of Mexican gateways handling U.S.-bound cargo. Broader regionalization is nudging fleet planners to design shorter, high-frequency strings instead of relying solely on long-haul east-west trunk routes. Over the long term, the container shipping market benefits from lower tariff barriers as well as harmonized customs processes that reduce dwell times and enhance service predictability.
Rapid E-commerce Containerization
Retailers shifting to omni-channel fulfillment models have accelerated box cycle times and increased demand for smaller shipment lots. East Coast ports recorded record monthly throughput in early 2025 following an extended holiday restock season, with e-commerce goods accounting for a growing share of inbound containers. LCL consolidators are capturing value by offering digital booking platforms with real-time visibility, enabling small shippers to match sailing schedules more efficiently. The surge in parcel-ready freight has prompted a wave of automation investments in yard and gate operations to handle higher gate moves per container. These dynamics are expanding the addressable base of the container shipping market while incentivizing carriers to differentiate through data transparency.
IMO 2023 Carbon Regulations Drive Fleet Renewal
Implementation of EEXI and CII benchmarks is advancing a two-tier vessel market where compliant tonnage secures premium rates. As of October 2024, the orderbook included more than 500 dual-fuel ships, signaling a structural pivot toward methanol and LNG propulsion. Early adopters report measurable operating cost savings despite elevated capital outlays, particularly when bunker prices spike. Financing conditions favor well-capitalized lines, raising barriers for smaller operators and promoting further consolidation. Over the medium term, the regulations are expected to enhance the reputation of the container shipping market among shippers with aggressive decarbonization targets.
Restraints Impact Analysis of Container Shipping Market*
| Restraint | (~) % Impact on CAGR Forecast | Geographic Relevance | Impact Timeline |
|---|---|---|---|
| Volatile bunker fuel prices | -0.4% | Global | Short term (≤ 2 years) |
| Escalating geopolitical trade tensions | -0.6% | Red Sea, US–China routes | Medium term (2-4 years) |
| Chronic port-side congestion bottlenecks | -0.3% | Singapore, Mediterranean hubs | Short term (≤ 2 years) |
| Cyber-attacks on digital ship-to-shore systems | -0.2% | Global | Medium term (2-4 years) |
| Source: Mordor Intelligence | |||
Volatile Bunker Fuel Prices
Very-Low-Sulfur Fuel Oil averaged USD 630 / t in 2024, and the inclusion of shipping in the EU Emissions Trading System has added USD 170–210 / t for intra-European voyages[2]“ETS Extension to Maritime Transport,” European Commission, europa.eu. Price gyrations compel carriers to adjust freight rates through bunker adjustment factors that often lag market swings, eroding margins. Wide spreads between LNG, methanol, and conventional bunkers complicate multi-fuel procurement strategies. Hedging offers partial relief but demands financial sophistication that not all operators possess. Consequently, energy efficiency retrofits and slow steaming remain immediate tools to absorb cost shocks within the container shipping market.
Escalating Geopolitical Trade Tensions
Sustained insecurity in the Red Sea keeps roughly 70% of Suez-bound capacity rerouted around the Cape of Good Hope, lengthening round voyages by 10–14 days. On the Pacific, proposals to impose million-dollar port security fees on Chinese-owned vessels illustrate growing regulatory risk[3]“Proposed Maritime Security Fees,” Office of the United States Trade Representative, ustr.gov. These frictions undermine network stability, raise insurance premiums, and force cargo owners to hold higher inventories. Medium-term strategic planning thus includes scenario buffers that inflate capacity requirements and temper the organic growth potential of the container shipping market.
*Our forecasts treat driver/restraint impacts as directional, not additive. The impact forecasts reflect baseline growth, mix effects, and variable interactions.
Container Shipping Market Segment Analysis
By Container Size:
Standardization Drives EfficiencyThe 40-foot segment held 50.62% of 2025 revenue, reflecting its status as the industry’s workhorse unit that maximizes vessel stowage and aligns with rail and truck dimensions. The container shipping market size for 40-foot boxes is projected to grow alongside equipment replacement cycles and inland infrastructure upgrades that favor high-cube variants. Robust demand from electronics and apparel shippers reinforces fleet utilization, while sustained production of high-cube designs lifts per-unit load factors. Port-side investments in double-lift crane spreaders further cement the operational preference for this size. The 20-foot segment remains vital for dense commodities and infrastructure-limited terminals in developing economies, though its relative share is expected to edge lower as shippers consolidate loads to reduce per-tonne carbon footprints. Specialized sizes such as 45-foot units cater to pallet-wide cargo niches, yet their uptake is restricted by limited backhaul demand and compatibility gaps in certain rail corridors.
Growth in the 40-foot category is also supported by digitized container tracking, which improves door-to-door visibility and enables leaner inventory planning for high-volume retailers. Leasing companies are accelerating fleet renewal to incorporate smart-box technology, a move that enhances asset rotation and reduces idle time. Combined, these factors should keep the 40-foot segment at the core of the container shipping market through 2031.


By Container Type:
Specialized Cargo Drives Premium GrowthGeneral-purpose containers accounted for 63.40% of 2025 throughput, underpinning the bulk of consumer and industrial trade flows. However, reefer units are forecast to log a 3.36% CAGR, outpacing standard boxes on the back of sustained demand for temperature-controlled pharmaceuticals and perishables. Enhanced insulation, integrated telemetry, and lower power draw raise the profitability of refrigerated services despite higher capital costs. Pharmaceutical firms are shifting high-value biologics from air to ocean freight, lured by validated cold-chain corridors that deliver cost savings without compromising product integrity. In food supply chains, the push to cut waste is increasing the share of fresh produce shipped in high-accuracy reefers with continuous monitoring. Consequently, carriers are dedicating larger reefer plugs on newbuild designs, signaling confidence in sustained premium demand. The general-purpose segment, while mature, remains central to the container shipping market, with incremental innovation focused on theft-resistant locks and end-to-end tracking rather than on transformative design changes.
A parallel trend involves the retro-fitting of CO₂-based refrigeration systems, improving energy efficiency and reducing global warming potential relative to older HFC units. These technology upgrades, combined with regulatory drivers in food and pharma, are likely to keep reefers at the forefront of revenue growth.
By Service:
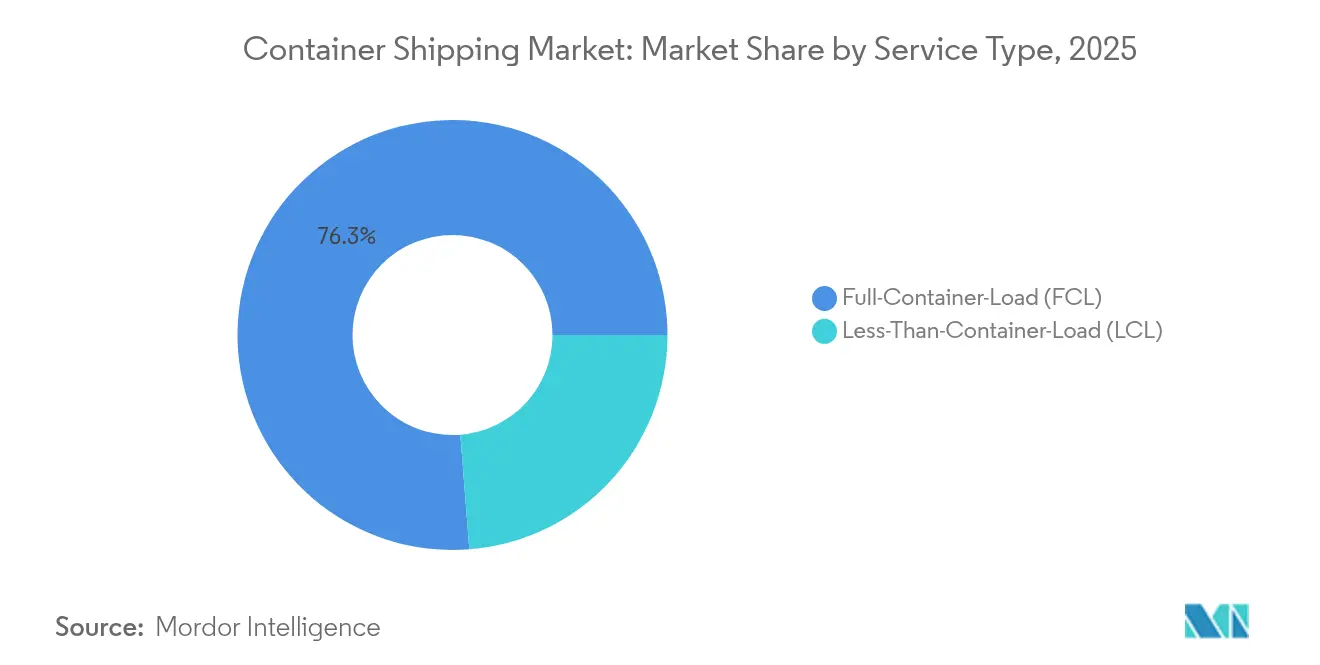
FCL Dominance Reflects Scale EconomicsFull-Container-Load services captured 76.25% of 2025 shipments, underscoring the economies realized when shippers can fill an entire box. The container shipping market size for FCL bookings is expected to continue expanding due to automation of booking interfaces and greater spot visibility, which simplify end-to-end execution for high-volume importers. Greater vessel size and port efficiency have lowered per-box handling costs, reinforcing the structural advantage of FCL. Less-Than-Container-Load, while accounting for 23.75% of volume, remains essential for SMEs entering new export markets. Digital forwarders now integrate predictive load aggregation and dynamic routing, narrowing transit gaps versus FCL and lifting the attractiveness of consolidation. Hybrid models that allow partial-fill bookings in real time are emerging, blurring the boundary between the two services and increasing utilization rates across both categories. In the long run, the container shipping market expects margin coexistence as FCL retains volume leadership and LCL captures growing share among e-commerce entrepreneurs.
Improved customs pre-clearance and milestone visibility on shared consignments are tempering historic concerns over cargo delays and damage in LCL operations. As platforms scale, network density increases, enabling more direct consol services that further close the cost-to-transit gap with traditional FCL.
By End-User Industry:
Diversification Creates OpportunitiesFMCG and retail goods commanded 26.45% of 2025 revenue, benefitting from resilient household spending and the ongoing consumer shift to online channels. Fast-moving inventory cycles and seasonality spur high frequency of box turns, sustaining carrier preference for stable, contract-based volumes. The healthcare and pharmaceuticals segment shows the fastest growth at a 3.62% CAGR, propelled by rising demand for temperature-controlled biologics and vaccines. Regulatory compliance necessitates validated cold-chain corridors, raising switching costs and supporting premium rates for service providers with specialized assets. Manufacturing and automotive cargo continues to require synchronized delivery windows aligned with just-in-time production, making schedule reliability a critical differentiator. Electronics shipments, although moderating after pandemic peaks, remain high-value loads sensitive to security and climate control, further boosting the share of smart containers equipped with cargo condition sensors. Industrial chemicals sustain steady volume but face mounting environmental scrutiny that could shift certain bulk commodities to regional production over time.
Diversified end-user exposure cushions the container shipping market against sector-specific downturns and allows carriers to balance spot and contract mix strategically across economic cycles.
Geography Analysis
APAC Container Shipping Market
Asia-Pacific commanded 40.55% of 2025 revenue, reinforcing its status as the manufacturing and export engine of the container shipping market. Chinese GDP expansion near 5% and accelerated port automation in Shanghai, Ningbo-Zhoushan, and Busan are sustaining the region’s slot demand. Intra-Asian trade lanes are registering some of the highest frequency growth, propelled by ASEAN supply-chain integration and electronics component flows. The emergence of the Northern Sea Route as a summer alternative for Asia–Europe cargo offers an additional resilience layer, though uptake remains constrained by ice-class fleet scarcity and geopolitical risk. Continued investment in hinterland rail networks and free-trade zones supports a robust outlook, with the region projected to deliver a 4.12% CAGR through 2031.
North America Container Shipping Market
North America experienced a 13.1% rebound in loaded container imports during 2024, led by retail restocking and e-commerce fulfillment demand. East Coast gateways such as Savannah and New York–New Jersey benefited from shipper diversification away from West Coast labor uncertainties and from deeper channel dredging that accommodates larger neo-Panamax vessels. Mexico’s west-coast port of Lázaro Cárdenas is attracting direct Asia services, offering rail connectivity into the U.S. Midwest. Long-beach terminal retrofits emphasizing zero-emission yard equipment align with state regulations and bolster the environmental credentials of the container shipping market in the region. While potential labor negotiations pose near-term volatility, the structural trend toward onshore inventory buffers and near-shoring supports medium-term growth.
Europe Container Shipping Market
Europe’s picture is mixed. Northern hubs such as Rotterdam and Antwerp-Bruges posted modest gains after a soft 2023, whereas Mediterranean transshipment hubs enjoyed volume windfalls of about 30% as carriers bypassed the Suez Canal. The container shipping market size in Southern Europe therefore expanded even as regulatory costs rose under the FuelEU Maritime and ETS frameworks. Investments in port community systems and intermodal rail corridors are improving hinterland connectivity, yet congestion risk lingers when Mediterranean hubs become overflow valves during crisis reroutes. Brexit-related customs friction has stabilized, although UK gateways continue to handle lower direct Far East services than before 2021.


Regulatory Landscape
Environmental regulation is a key cost and compliance driver for container shipping, anchored in the IMO MARPOL Annex VI framework (including EEXI and CII) and complemented by region-specific carbon pricing. In the European Union, maritime transport entered the EU Emissions Trading System (EU ETS) with staged coverage, rising to 100% of reported emissions for in-scope voyages in 2026 (up from 70% in 2025), and expanding to additional greenhouse gases such as methane (CH4) and nitrous oxide (N2O). This increases voyage-level compliance costs and reporting intensity for carriers calling EU ports.
The EU FuelEU Maritime Regulation applies from 2025 for vessels of 5,000 gross tonnage and above, introducing fuel GHG-intensity requirements and a compliance cycle that links monitoring, verification, and potential penalties to annual reporting. In parallel, EU MRV and ETS processes are operationalized through defined deadlines (for example, verified monitoring plans and verified emissions reporting via EU systems), which increases fleet data governance demands. Together with IMO review milestones on short-term carbon intensity measures completed in 2026, these requirements are pushing carriers toward dual-fuel vessel ordering and operational measures such as speed management to stay compliant while maintaining schedule integrity.
Value Chain Analysis
The container shipping value chain covers container manufacturing and leasing, maintenance, bunker fuel and alternative fuel supply, and vessel ownership or chartering paired with classification. It then moves through ocean carriage by carriers and into port and terminal operations, including pilotage, towage, and stevedoring, before shifting to onward inland transport by rail, truck, and barge supported by freight forwarders, NVOCCs, and digital booking platforms. Large carriers increasingly internalize additional links through integrated logistics and terminal participation, which shows up in major terminal asset transactions and the focus on reliability-oriented network design. Alliance structures and service-loop planning shape port call patterns, transshipment dependency, and equipment repositioning flows.
Operational friction concentrates at ports and in documentation and visibility handoffs. Persistent congestion and schedule slippage increase the value of terminal productivity, berth access, and gate and rail interfaces, while security-driven diversions lengthen routings, raising container cycle times and creating equipment imbalances. On top of this, compliance data flows through a parallel information chain, including EU MRV and EU ETS and fuel-intensity reporting, that needs reconciliation with voyage execution and customer visibility tools. That shifts attention toward vessel-to-shore connectivity, predictive routing, and standardized digital documentation as service differentiators.
Competitive Landscape
Oligopolistic concentration defines the container shipping market, with the top 10 carriers controlling roughly 85% of deployed capacity. MSC’s USD 24 billion acquisition of Hutchison Ports terminals added 51 million TEU of annual handling capacity, cementing the line’s integrated port-to-ocean model and lifting its projected terminal market share to 15% by 2028. Alliance realignment effective January 2025 dissolved the 2M partnership and established the Maersk–Hapag-Lloyd Gemini network, targeting schedule reliability above 90% through tighter service loops and coordinated slow steaming. The Ocean Alliance extended its pact through 2032, emphasizing service breadth rather than direct consolidation.
Technology adoption is now the premier differentiation lever. MSC and CMA CGM deploy AI-based voyage planning and predictive maintenance suites that lower bunker consumption and unplanned downtime. DB Schenker’s Ocean Bridge platform expands data access to shippers, integrating inland milestones and carbon footprint dashboards. These digital advances heighten switching costs for cargo owners and create service quality tiers within an otherwise commoditized rate environment.
Regulatory compliance is accelerating capital expenditure across the fleet. The orderbook of more than 500 dual-fuel ships favors lines with robust balance sheets and long-term charter portfolios. Smaller regional carriers face strategic choices between niche specialization and partnership with larger alliances to satisfy shippers’ decarbonization goals. Consequently, merger and acquisition activity is likely to continue, particularly where integrated logistics capabilities align with port ownership.
Container Shipping Industry Leaders
MSC Mediterranean Shipping Company
A.P. Moller – Maersk
CMA CGM
COSCO Shipping Lines
Hapag-Lloyd
- *Disclaimer: Major Players sorted in no particular order
Container Shipping Market Companies Covered in this Report
- MSC Mediterranean Shipping Company
- A.P. Moller - Maersk
- CMA CGM
- COSCO Shipping Lines
- Hapag-Lloyd
- ONE (Ocean Network Express)
- Evergreen Marine
- Yang Ming
- HMM Co.
- PIL (Pacific International Lines)
- ZIM Integrated Shipping
- OOCL
- Wan Hai Lines
- Matson
- X-Press Feeders
- SITC International
- Zhonggu Logistics
- Antong Holdings
- Hyundai Merchant Marine
- IRISL Group

Market Opportunities and Future Outlook
Port and terminal capacity build-outs and modernization programs are creating near-term whitespace for carriers, terminal operators, and logistics integrators to secure throughput access and improve schedule outcomes. Several large projects entered active phases in 2026, including Port of Dunkirk launching a EUR 303 million CAP 2020 expansion to raise capacity from 850,000 TEU to 2 million TEU, and the Port of Vancouver selecting a preferred contractor for the Roberts Bank Terminal 2 project designed to add 2.4 million TEU of capacity. New deepwater and smart-port initiatives, including construction starts in Swinoujscie (Cape Pomerania) and a smart AI container port project in Malaysia, are also sustaining investment flow toward hubs that can handle larger vessel calls and reduce landside dwell time.
Digital and compliance-led operational upgrades are opening practical opportunities in documentation, visibility, and emissions management services. Industry efforts to enable cross-platform electronic bills of lading advanced in 2026 through implementation of the DCSA standard for eBL interoperability, addressing a recurring documentation bottleneck and supporting faster cargo release with reduced dispute risk. Fleet connectivity, predictive performance tools, and port-side decarbonization enablers such as shore power readiness and fuel reporting workflows are becoming purchasable capabilities that can be integrated into a single vessel-terminal-customer operating model rather than one-off builds.
Recent Industry Developments in Container Shipping Market
- July 2026: CMA CGM inaugurated the CMA CGM NOTRE DAME, a 24,000 TEU LNG-powered containership, in Le Havre as the first of a new series of French-flagged vessels. The delivery expands the pool of alternative-fuel mega-tonnage available for mainlane deployment while reinforcing carrier differentiation around fuel choice and emissions compliance on long-haul routes.
- March 2025: MSC completed the acquisition of Hutchison Ports terminal assets outside China for EUR 22.765 billion (USD 25.12 billion), adding 39 terminals across 21 countries and 51 million TEU of annual handling capacity. The deal deepens vertical integration by pairing ocean capacity with owned/controlled terminal throughput, tightening control over berth access and landside performance.
- December 2024: The EU-Mercosur free-trade agreement was finalized, paving the way for EUR 56 billion (USD 61.80 billion) in incremental trade between the two blocs. This creates lane-development headroom for South Atlantic services and increases the strategic value of terminal positions in gateways such as Santos and Buenos Aires as carriers adjust network design for new origin-destination flows.


Container Shipping Market Report Scope and Research Methodology
Market Definition and Coverage
This market covers the value of ocean container shipping services where cargo is moved in standardized containers on global trade lanes, and revenue is counted for the transport service provided to shippers.
Scope exclusions: It does not include bulk or tanker shipping, inland-only trucking or rail movements, port terminal handling charges, or container manufacturing.
Segments Covered in This Report
- By Container Size
- 20-Foot (TEU)
- 40-Foot (FEU)
- Others
- By Container Type
- General
- Reefer
- By Service
- Full-Container-Load (FCL)
- Less-Than-Container-Load (LCL)
- By End-User Industry
- FMCG and Retail
- Manufacturing and Automotive
- Healthcare and Pharmaceuticals
- Electronics and Electrical Equipment
- Industrial Chemicals and Raw Materials
- Others
- By Geography
- North America
- United States
- Canada
- Mexico
- South America
- Brazil
- Peru
- Chile
- Argentina
- Rest of South America
- Asia-Pacific
- India
- China
- Japan
- Australia
- South Korea
- South East Asia (Singapore, Malaysia, Thailand, Indonesia, Vietnam, and Philippines)
- Rest of Asia-Pacific
- Europe
- United Kingdom
- Germany
- France
- Spain
- Italy
- BENELUX (Belgium, Netherlands, and Luxembourg)
- NORDICS (Denmark, Finland, Iceland, Norway, and Sweden)
- Rest of Europe
- Middle East and Africa
- United Arab of Emirates
- Saudi Arabia
- South Africa
- Nigeria
- Rest of Middle East And Africa
- North America
Data Sources, Market Sizing, and Validation
Desk Research
Desk work starts by setting the demand context for containerized trade and the operating cost signals that move freight rates. We referenced public sources such as UNCTAD shipping reviews, the World Trade Organization trade statistics, World Bank logistics indicators, IMF macro series, and port authority throughput releases to anchor trade direction and regional flow patterns.
For the industry side, we used sources such as carrier annual reports and investor decks to understand capacity deployments, service mix, and rate commentary, and then cross-checked with reputable press and exchange filings where available. In addition, a paid subscription for company financials and news intelligence was used to standardize revenue line items and track material events, and a paid subscription for import and export shipment level data was used selectively to sanity check trade lane activity. The examples above are not exhaustive, and many other public sources were also reviewed for data collection, validation, and clarification.
Primary Interviews and Surveys
Primary work focused on validating what the desk sources cannot explain cleanly, especially how contract versus spot exposure, blank sailings, and routing shifts translate into realized revenue. We spoke with a mix of carrier-side leaders, freight forwarders, large shipper logistics teams, and port and maritime advisors across APAC, EMEA, and the Americas, so key trade lanes and shipper types were represented in the checks.
Distribution of primary research fieldwork respondents
| Company type | Respondent position | Region |
|---|---|---|
| Top tier: 35% | CXOs: 15% | APAC: 42% |
| Mid tier: 50% | Functional/Unit leaders: 38% | EMEA: 31% |
| Smaller Players: 15% | Managers: 47% | Americas: 27% |
Market-Sizing & Forecasting
The sizing model is built using a top-down view where containerized seaborne trade indicators, deployed capacity, and route level utilization signals are used to reconstruct the addressable shipping revenue pool, and then it is split across major geographies and service patterns. To keep the totals realistic, we corroborated results using selective bottom-up approximations such as sampled carrier revenue disclosures, typical rate ranges by corridor gathered from channel checks, and simple volume times average rate calculations for high-traffic lanes.
Key inputs used in the model include global and regional container throughput trends at major ports, capacity additions and removals in TEU terms (including idle capacity and blank sailings), bunker fuel movements, the mix of contract and spot pricing, and macro signals like trade growth and manufacturing output. Where bottom-up data gaps appear, ranges were applied instead of single point assumptions, and they were narrowed only after interview feedback confirmed the most likely operating conditions.
For forecasting, scenario analysis was used so the model can reflect different outcomes for trade growth, effective capacity (including rerouting distance effects), and rate normalization. Assumptions for each scenario were aligned to what market participants described as plausible for contracting cycles, peak season behavior, and cost pass-through.
Data Validation & Update Cycle
Outputs are checked against independent market signals before sign-off, including whether implied revenue per TEU aligns with observed rate direction and whether growth tracks known trade and capacity shifts. If a region or year shows an unusual jump, we trace the driver back to the exact input series, and the relevant assumptions are reviewed again.
A multi-step internal review is followed so calculation logic, units, and currency conversions are consistent across the full time series. Reports refresh annually, with interim updates triggered by material events such as major route disruptions, sharp fuel moves, or demand shocks. Before delivery, a final pass is done to ensure the latest public data and recent interview learnings are reflected.
Mordor Intelligence's Global Container Shipping Market Size Measured Against Other Published Estimates
Published market sizes for global container shipping do not always line up because groups may count different revenue buckets and choose different timing for rates and currency. Differences also come from how much of the value chain is treated as shipping service revenue versus adjacent logistics charges.
Key gap drivers usually include whether terminal handling and documentation fees are included, whether inland legs are blended into the same number, and whether the rate baseline is taken from an unusually strong or weak freight cycle. Port throughput signals, carrier revenue disclosures, and trade growth series are the evidence used to keep Mordor Intelligence tied to ocean transport revenue only, which reduces over-counting when logistics fees are bundled in other views.
Benchmark comparison
| Source | Market Size | Gaps in Research Methodology |
|---|---|---|
| Mordor Intelligence | USD 123.14 B (2026) | |
| Industry Association A | USD 135.80 B (2026) | Often blends ocean freight with terminal handling, documentation, and selected inland drayage charges, which increases the counted revenue pool beyond pure sea transport. |
| Trade Journal B | USD 110.40 B (2026) | Uses conservative rate normalization assumptions and may understate revenue by relying on averaged spot indices that do not reflect contracted rate carryover in the same year. |
The spread in estimates is mainly explained by boundary choices and how rate cycles are treated in the base year. By keeping the scope centered on ocean container transport revenue and then validating implied yield against throughput and capacity signals, the final number stays traceable to clear variables and repeatable checks.


Key Questions Answered in the Report
How big is the Container Shipping Market?
The Container Shipping Market size is expected to reach USD 123.14 billion in 2026 and grow at a CAGR of 2.92% to reach USD 142.07 billion by 2031.
What is the current Container Shipping Market size?
In 2026, the Container Shipping Market size is expected to reach USD 123.14 billion.
What is the expected value of the container shipping market in 2031?
The container shipping market is forecast to reach USD 142.07 billion by 2031 at a 2.92% CAGR.
Which container size holds the largest share of global traffic?
The 40-foot container segment led with 50.62% share of 2025 revenue and is projected to maintain dominance through 2031.
Which region is growing fastest for container lines?
Asia-Pacific is forecast to post the highest regional CAGR at 4.12% between 2026 and 2031, buoyed by intra-Asian trade expansion.
Why are reefer containers gaining importance?
Rising demand for temperature-controlled pharmaceuticals and perishables is driving reefer container volumes, which are set to grow at a 3.36% CAGR.
How are environmental regulations affecting vessel orders?
IMO energy-efficiency rules and EU carbon costs are accelerating orders for dual-fuel ships, with more than 500 such vessels on order as of late 2024.
What was the largest recent port acquisition?
MSC’s purchase of Hutchison Ports’ global terminals for EUR 22.765 billion (USD 25.12 billion) in Mar 2025 added 51 million TEU of handling capacity and marked the biggest port asset deal on record.
Page last updated on:


 Your data is secure and never sold or shared.


