
Commercial Microwave Ovens Market Size and Share
Market Overview
| Study Period | 2020 - 2031 |
|---|---|
| Market Size (2026) | USD 1.66 Billion |
| Market Size (2031) | USD 2.39 Billion |
| Growth Rate (2026 - 2031) | 7.53 % |
| Fastest Growing Market | Asia Pacific |
| Largest Market | North America |
| Market Concentration | Medium |
Major Players
*Disclaimer: Major Players sorted in no particular order Image © Mordor Intelligence. Reuse requires attribution under CC BY 4.0. |
|
Commercial Microwave Ovens Market Analysis by Mordor Intelligence
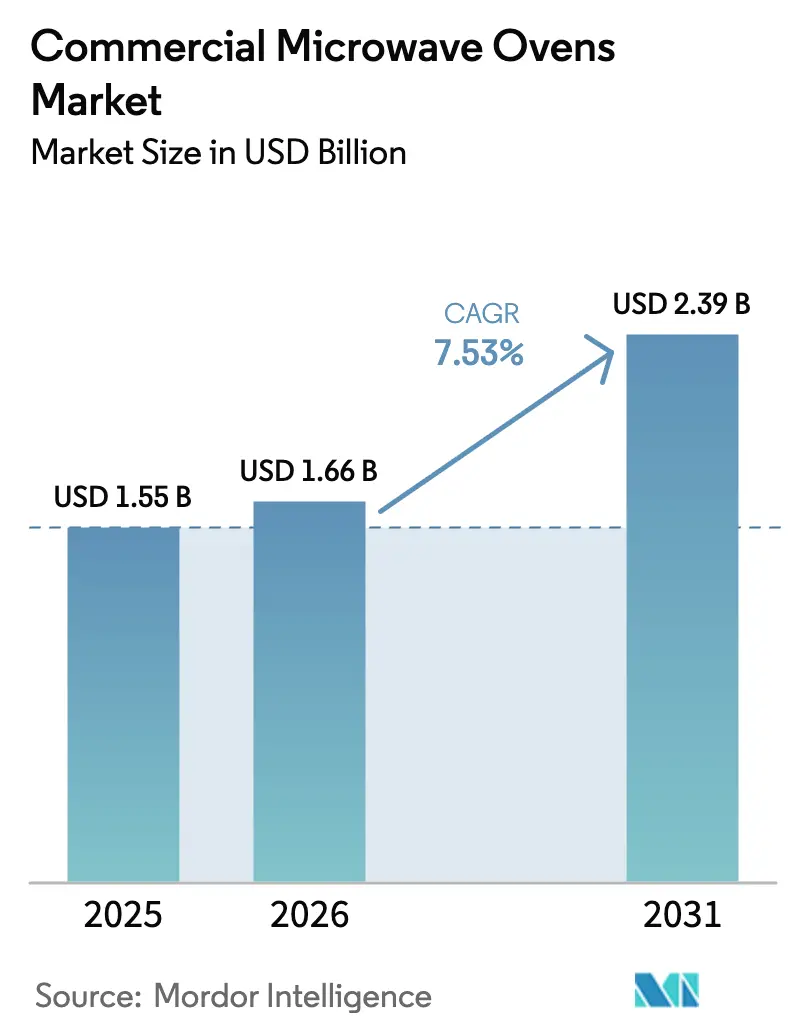
The commercial microwave ovens market size is expected to grow from USD 1.56 billion in 2025 to USD 1.66 billion in 2026 and is forecast to reach USD 2.39 billion by 2031 at 7.53% CAGR over 2026–2031. The growth profile aligns with kitchen modernization cycles and a shift toward programmable, connected equipment that compresses training time and stabilizes output quality during labor shortages. Operators favor ventless high-speed formats that add hot food without ventilation retrofits, which helps maximize throughput within small footprints. Heavy-duty models above 2 kilowatts have led near-term purchasing, while high-speed combinations integrating microwave, convection, and impingement have become the technology to watch due to cycle time reductions and menu versatility. Quick service chains continue to anchor demand as they scale delivery and pickup heavy formats that depend on consistent reheating and rapid service speed.
Key Report Takeaways
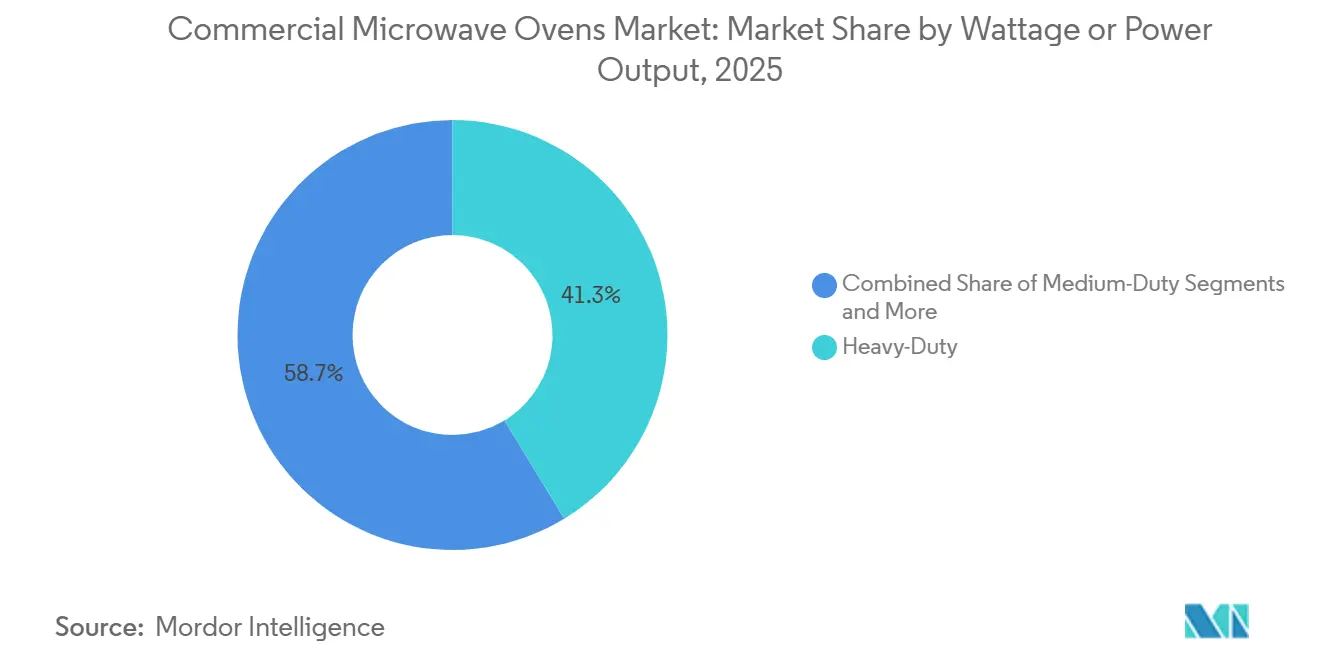
- By wattage or power output, heavy-duty models above 2 kilowatts held 41.26% of the commercial microwave ovens market size in 2025 and are expected to grow at 9.37% annually through 2031.
- By product type, countertop or freestanding units led with 49.35% of the commercial microwave ovens market share in 2025, while high-speed or combination ovens are projected to expand at an 11.72% CAGR through 2031.
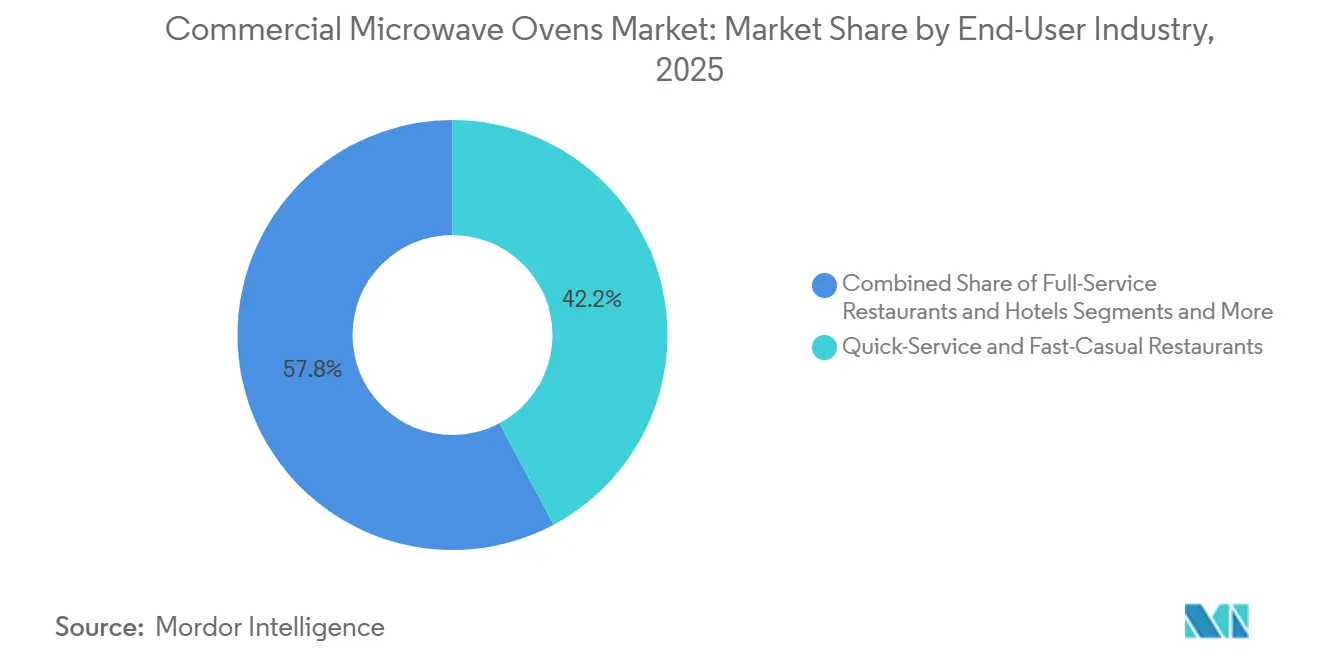
- By end user industry, quick service restaurants accounted for 42.24% of the commercial microwave ovens market share in 2025, and convenience and grocery stores are set to grow at 9.33% annually through 2031.
- By distribution channel, B2C or retail captured 53.35% of the commercial microwave ovens market in 2025, and B2B or direct sales are projected to post a 10.24% CAGR through 2031.
- By geography, North America secured 36.65% of the commercial microwave ovens market in 2025, and the Asia-Pacific is forecast to record an 11.32% CAGR from 2026 to 2031.
Note: Market size and forecast figures in this report are generated using Mordor Intelligence’s proprietary estimation framework, updated with the latest available data and insights as of January 2026.
Global Commercial Microwave Ovens Market Trends and Insights
Drivers Impact Analysis*
| Driver | ~ (%) Impact on CAGR Forecast | Geographic Relevance | Impact Timeline |
|---|---|---|---|
| QSRs Expand, and Meal-Delivery Kitchens Thrive | +2.1% | Global, with early gains in North America, China, India | Medium term (2-4 years) |
| Magnetron and Inverter Technologies Become More Energy-Efficient | +0.9% | Europe, high‑utility‑rate U.S. metropolitan areas, Japan | Long term (≥ 4 years) |
| Kitchen Automation Rises Due To Post-Covid Labor Shortages | +1.8% | North America core, spill‑over to Western Europe | Short term (≤ 2 years) |
| Programmable Ovens Benefit from Stricter Food-Safety Audits | +0.7% | North America, EU | Medium term (2-4 years) |
| Ventless High-Speed Combo Ovens see Increased Popularity | +1.3% | Urban markets globally, especially <1,000 sq ft footprints | Medium term (2-4 years) |
| AI-Driven Self-Diagnostics Cut Down on Downtime | +0.6% | Early adopters: Japan, South Korea, U.S. QSR chains | Long term (≥ 4 years) |
| Source: Mordor Intelligence | |||


QSRs Expand, and Meal-Delivery Kitchens Thrive
Quick service restaurant locations in the United States are continuing to expand, supported by steady year-over-year growth and strong overall economic contribution. Ordering patterns are increasingly skewed toward off-premises consumption, raising expectations for consistent reheating performance and strict timing control during peak periods. Operators are prioritizing programmable cooking cycles that preserve texture, eliminate cold spots, and improve delivery satisfaction. Rapid-cook and high-speed oven formats that dramatically reduce preparation time without compromising quality align well with these operational demands and help manage volume surges tied to digital ordering. As the commercial microwave oven market emphasizes fast deployment in high-growth regions, vertically integrated manufacturers offering AI-enabled systems with short lead times are well positioned to support chain expansion, especially where compact footprints and throughput efficiency are critical.
Magnetron and Inverter Technologies Become More Energy-Efficient
Inverter-based systems deliver a continuous energy stream instead of traditional on-off pulsing, which reduces power draw and supports repeatable results for sensitive items that can scorch under peak cycling. European operators that face high retail electricity rates have accelerated payback modeling and are favoring inverter platforms that also extend component life versus pulsed legacy designs. Established electronics players that generate cash from adjacent high-efficiency components are directing funding to inverter R&D, and that roadmap is starting to influence commercial platforms in the field. Solid state RF generators, which replace magnetrons with semiconductor power modules that deliver finer control and zero warm-up lag, remain premium due to higher capital cost but represent the next step in precision cooking. As the commercial microwave ovens market matures in energy-sensitive regions, technology selection increasingly tracks total cost of ownership rather than first price alone, a shift that is reinforced by power efficiency mandates and lifecycle savings targets. Corporate financial disclosures also show how profit growth in energy and semiconductor lines supports innovation that can filter into professional kitchen platforms.
Kitchen Automation Rises Due To Post-Covid Labor Shortages
Restaurant labor vacancy rates in the United States remained near 12% through 2024 and continued to pressure staffing ratios in 2025, which kept automation on the near-term roadmap for many chains. A large share of restaurants added technology in 2024 and plan to continue in 2025, citing the need to de-skill prep work and standardize output with simple push-button routines. Programmable rapid cook cycles reduce training time by storing multi-stage steps that any staff member can execute during the rush while maintaining consistent quality. Front-of-house engagement benefits when repetitive back-of-house tasks shift to automated routines, and that helps maintain service speed at peak hours. Adoption patterns suggest the commercial microwave ovens market will continue to integrate features like cloud recipes and connected service diagnostics that lower the support burden and stabilize uptime in busy venues. Industry communications also highlight robotics pilots and other automation projects that complement connected ovens and help close staffing gaps without sacrificing safety or throughput.
Programmable Ovens Benefit from Stricter Food-Safety Audits
Auditors are increasing the emphasis on digitally verifiable cook records in larger venues and within institutional catering, which makes integrated HACCP data logging a practical requirement. Programmable commercial microwave ovens provide tagged time temperature profiles that remove the need for paper logs, and cloud dashboards present real-time status and history across fleets. Multi-mode platforms that pair microwave with steam and hot air support diverse menus while still capturing complete cook cycle records that are auditor-friendly. The policy agenda also includes food labeling and nutrition measures with publication targets in 2026, which keeps compliance on the agenda for large multi-site operators and their equipment partners. As the commercial microwave ovens market aligns with data-driven audits, connected platforms that make compliance automatic provide a clear return by lowering risk and reducing manual tracking tasks[1]U.S. Food and Drug Administration, “Foods Program Regulations Under Development,” U.S. Food and Drug Administration, fda.gov. Connectivity suites from category leaders, which include energy reporting and remote monitoring, are already standard in many installations and continue to evolve with new cybersecurity and data sharing requirements across regions.
Restraints Impact Analysis*
| Restraint | ~ (%) Impact on CAGR Forecast | Geographic Relevance | Impact Timeline |
|---|---|---|---|
| Escalating Costs of Raw Materials, Including Steel And Semiconductors | -1.1% | Global supply chains | Short term (≤ 2 years) |
| Intensifying Competition Posed by Rapid-Cook Convection Ovens | -0.9% | North America, Europe | Medium term (2-4 years) |
| Heightened Cyber-Security Concerns Associated With IoT-Connected Models | -0.4% | Enterprise segments in North America, EU | Long term (≥ 4 years) |
| Uncertain Regulations Surrounding RF Emissions in Emerging Markets | -0.3% | Middle East, Africa, select Southeast Asian markets | Medium term (2-4 years) |
| Source: Mordor Intelligence | |||
Escalating Costs of Raw Materials, Including Steel And Semiconductors
Input cost inflation in steel and electronic components influences price quotes and delivery schedules, which can defer planned purchases in value-sensitive segments. Manufacturers have partially mitigated exposure through scale purchasing, multi-sourcing strategies, and design standardization to improve component interchangeability. Some chains respond by extending replacement cycles or prioritizing refurbishments, which redistributes order flow toward service contracts and parts. Price visibility improves under direct enterprise agreements, but small independent buyers still face list price changes and delivery variability. The commercial microwave ovens market balances these headwinds by emphasizing energy savings, uptime guarantees, and performance features that justify payback under constrained capital budgets, with connectivity features and remote monitoring framed as additional cost avoidance levers in service agreements. Purchasing guidance from large chains also now weighs vendor lead times and parts availability on equal footing with headline features to reduce disruption risk during peak periods.
Intensifying Competition Posed by Rapid-Cook Convection Ovens
Rapid cook convection platforms that rely on high velocity air and smart airflow controls compete at similar speed tiers, which can slow adoption among operators that prefer to minimize microwave use in front-of-house environments. These systems promote browning and crisping qualities and have cultivated loyalty in bakeries and cafes where texture is a central attribute. Competitive positioning, therefore, hinges on cycle flexibility, footprint, and electrical load, with multi-mode designs that include microwave often beating pure convection when speed is the primary constraint. Product trainers and culinary teams frame pilot tests to show side-by-side cycle output, which supports head-to-head evaluations in chain specifications. As the commercial microwave ovens market increasingly features high-speed hybrid designs, the overlap with rapid cook convection is turning into a feature race where integrated microwave inputs tip outcomes when seconds matter in queue time metrics[2]Merrychef Product Team, “Products,” Merrychef, merrychef.com. Ongoing energy efficiency work and cloud recipe governance add separation on operating cost and standardization, which matters in multi-site operations that rely on centralized updates.
*Our forecasts treat driver/restraint impacts as directional, not additive. The impact forecasts reflect baseline growth, mix effects, and variable interactions.
Segment Analysis
By Wattage/Power Output: Heavy-Duty Dominance Reflects Volume Demands
Heavy-duty commercial microwave ovens exceeding 2.0 kilowatts held 41.26% of the 2025 market size, reflecting the needs of high-throughput locations that require speed and consistency during peak periods. The segment is projected to grow at 9.37% annually through 2031, supported by drive-through formats that must maintain queue times under two minutes while handling a broader menu. Medium-duty models in the 1.2 to 2.0 kilowatt range align with mid-volume cafeterias and offices where peak loads are predictable, and budgets target durable entry-level commercial designs. Light-duty ovens below 1.2 kilowatts serve compact venues that prioritize small footprints and simple cycles over multi-item simultaneous reheats. As the commercial microwave ovens market adapts to higher off-premises sales, power tiers are being specified to match expected order surge profiles rather than legacy back-of-house archetypes.
Engineering roadmaps continue to emphasize power density and uniformity, with dual magnetron designs balancing speed and cavity coverage to reduce cold spots at heavy-duty power levels. Product launches that push faster warm-up and more even airflow show how the category is crossing into high-speed hybrid terrain with better browning while preserving microwave speed. A notable focus is stackability and vertical clearance, which influences how many units can fit on a line without air intake compromises. Platform durability and cooling design also remain central since higher power cycles drive thermal loads that affect component life across long opening hours. These refinements help the commercial microwave ovens market sustain heavy-duty leadership at scale and preserve consistency in chain kitchens where peak period stability matters most.


By Product Type: Flexibility Drives Countertop Leadership, Innovation Fuels High Speed Ascent
Countertop and freestanding units captured 49.35% of the 2025 market size due to plug-and-play installation and compatibility with legacy layouts that lack built-in cutouts. High-speed or combination ovens that integrate microwave, convection, and impingement are forecast to expand at an 11.72% CAGR through 2031, which reflects rising demand for shorter cycles and versatile menus without hood retrofits. Built-in formats retain a place in full-service kitchens with planned renovations, but decision cycles and installation complexity slow share gains relative to countertop growth. Product development showcases larger cavities within compact frames so that standard plates and half-size pans fit, which improves utilization per square foot. This variety keeps the commercial microwave ovens market responsive to the layout realities of QSR, convenience, and small-format retail.
Innovation within the countertop category focuses on stackable designs with small footprints that still deliver high airflow speeds and multi-mode flexibility. Connectivity and cloud recipe management are becoming standard asks in multi-site deployments, which reduces retraining time and stabilizes outcomes across shifts. High-speed ranges continue to improve cavity-to-footprint ratios and cycle controls to hit speed targets for pizzas, sandwiches, and baked items. Vendor communications highlight 80% faster cycles relative to conventional methods, which supports peak readiness and raises the ceiling on menu innovation in space-constrained sites. These design and software advances sustain the commercial microwave ovens market momentum in countertop and hybrid models that balance speed, quality, and footprint in urban venues.
By End User Industry: QSRs Lead Share, Convenience Stores Race Ahead
Quick service and fast casual restaurants accounted for 42.24% market share of 2025 end-user revenue, supported by unit count growth and expanded menus that require precise reheating under time pressure. Convenience and grocery stores are projected to grow at 9.33% annually through 2031 as hot grab-and-go programs spread and help monetize underutilized space in breakfast and lunch dayparts. Full-service restaurants and hotels contribute steady replacement demand and continue to add connectivity features to centralize control and record-keeping. Institutional venues such as hospitals, schools, and airports lean toward HACCP-ready ovens and fleet dashboards that support audits and policy compliance. The commercial microwave ovens market continues to consolidate around use cases that pair fast cycles with repeatable quality and documented cook profiles.
Off-premises sales now represent a larger share of revenue. Kitchen planners respond with line designs that distribute load across multiple microwave or high-speed cavities to handle surges without queue slippage. Packaging and cycle coordination also matter since temperature retention and texture drive repeat orders and broader menu adoption. These factors keep reheating performance central to equipment selection and raise the premium on programmable cycles that maintain taste and structure across items. The commercial microwave ovens market is, therefore, closely tied to how chains standardize digital production flows and integrate connected ovens into broader automation stacks.
By Distribution Channel: Retail Breadth Meets Direct Efficiency
B2C or retail routes, including multi-brand stores, exclusive brand outlets, online platforms, and other points of sale, held 53.35% of the 2025 distribution market size due to broad geographic coverage and accessory cross-selling. B2B or direct manufacturer sales are projected to post a 10.24% CAGR through 2031 as large chains negotiate volume contracts that include training and dedicated support service levels. Multi-brand stores support side-by-side comparisons for independent buyers, while brand showrooms leverage immersive demonstrations that shorten decision cycles. Online sales continue to grow for small ticket and replenishment items, though high ticket ovens still benefit from live consultations for installation planning and financing terms. With more enterprise agreements embedding connectivity, recipe governance, and service packages, the commercial microwave ovens market is seeing direct channels take a larger role in chain standardization programs.
Direct channel performance also reflects manufacturer innovation centers that bring specifiers into controlled test kitchens to pilot menu items and collect timing data. Platform integration with cloud dashboards and service portals can be demonstrated in these settings, which raises confidence among central kitchen teams and franchisee networks. Retail still plays a critical role for independent operators that need immediate replacement units or entry-level options with basic programmability. Digital discovery through online catalogs and configurators feeds both direct and retail paths and creates a more informed buyer before the final consultation. This blended approach allows the commercial microwave ovens market to serve both enterprise and independent customers without eroding the benefits that come with standardization and contracted support.
Geography Analysis
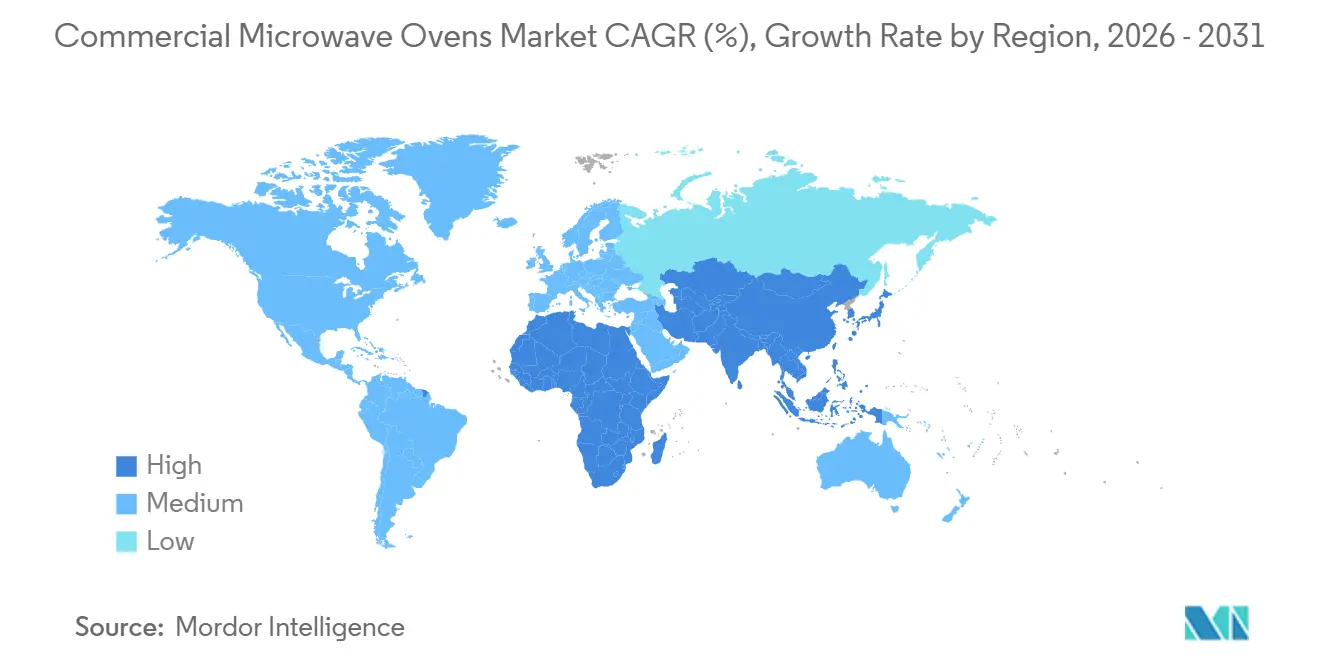
North America commanded a 36.65% market share in 2025 as a large installed base and labor headwinds maintained demand for programmable ovens that stabilize output with fewer skilled hands. The region’s vacancy rates held near 12% during 2024 and into 2025, which aligned with plans to invest in automation and connected equipment that cut training time and improve consistency. Urban stores benefit from ventless high-speed designs that eliminate hood costs and enable hot menus in sites below 1,000 square feet, especially in dense retail corridors. Canadian chains continue to adopt IoT-enabled equipment to streamline multi-site governance with cloud recipes and service dashboards. Cross-border supply coordination within USMCA supports component flow, while tariff discussions since early 2025 have increased emphasis on supplier diversification to manage exposure in complex assemblies.
Asia-Pacific is forecast to grow at an 11.32% CAGR from 2026 to 2031, driven by rising chain penetration and investment in compact automated equipment for small format stores. China’s growth in limited service formats and regional manufacturers’ ability to shorten lead times support faster rollouts in Tier 2 cities and beyond. India’s expansion in quick service outlets through 2026 elevates demand for robust countertop and high-speed ovens that perform under variable grids, and franchise networks are writing cloud recipe requirements into specifications to coordinate menus across regions. Japan and South Korea continue to lead on connected diagnostics and remote recipe management, which shortens support cycles and makes cross-site optimization more practical. The commercial microwave ovens market benefits from vertically integrated production footprints that can ship AI-enabled units with short lead times into Southeast Asian store pipelines.
Europe’s market size is shaped by eco design measures and energy priorities that nudge operators toward efficient inverter platforms and connected oversight for fleets. The European Union’s eco design agenda for small appliances includes tighter idle power expectations in 2026, which aligns with operator efforts to trim electricity bills under higher retail rates in several member states. Lifecycle carbon and total cost of ownership feature in evaluations, and listings such as Energy Star and the United Kingdom’s Energy Technology List remain useful signals in product selection processes. Network-capable combi and high-speed platforms with published compliance to the EU Radio Equipment Directive help reduce procurement friction for enterprise buyers with strict cybersecurity baselines. Outside Europe, South American demand centers in Brazil, Argentina, Chile, and Peru upgrade legacy equipment in urban foodservice, and the Middle East and Africa continue to benefit from hospitality growth in the Gulf Cooperation Council countries with premium hotel and travel venues specifying international standards. The commercial microwave ovens market in these regions emphasizes durability, repairability, and compliance documentation to serve multinational buyers and to work within local service ecosystems.

Regulatory Landscape
Regulatory requirements for commercial microwave ovens are anchored in radiation safety and electrical safety compliance. In the United States, products must conform to FDA performance standards for microwave and RF-emitting equipment under 21 CFR 1030.10, including RF leakage limits and required safety interlocks. Product safety and conformity testing are also structured around major standards such as UL 923 in the United States and IEC 60335-2-90:2024 internationally for commercial microwave ovens, which affects how OEMs validate designs and document compliance for multi-country sales.
Energy-related requirements vary by jurisdiction, shaping how connected and high-speed models are planned for large fleets. In Canada, Natural Resources Canada (NRCan) tightened standby power limits for microwave-only ovens, with 0.6 W applying to units manufactured on or after June 22, 2026. In the United States, the Department of Energy published a proposed rule on May 16, 2025 to rescind microwave oven energy conservation standards, which increases uncertainty around federal energy test and compliance pathways, even as operators continue to prioritize total cost of ownership and efficiency features during procurement.
Value Chain Analysis
The value chain starts with global sourcing of stainless steel and electrical and electronic components, including magnetrons or emerging solid-state RF modules, inverters, power supplies, controllers, waveguides, cavities, and door and interlock assemblies. OEM engineering follows, along with certification and testing against applicable safety and emissions requirements, then final assembly. Brand owners and OEMs such as ACP, Inc. (Ali Group) and Electrolux Professional rely on distributed manufacturing and service footprints, and products are routed through master distributors, regional dealers, and direct enterprise programs that bundle installation guidance, training, and service agreements, especially for high-speed and combination ovens deployed across multi-site chains.
Logistics and trade conditions increasingly influence delivered cost and lead times, particularly for globally sourced controls and stainless steel subassemblies. Freight and transit volatility tied to major chokepoints has been cited as an operational variable for kitchen-equipment exports, and fee changes such as an 18% Suez Canal Authority transit fee increase effective July 15, 2026 illustrate why importers and OEMs revisit sourcing, inventory buffers, and regional assembly options. Downstream, service organizations and parts distribution, including magnetrons and inverters, door assemblies, boards, and filters, affect uptime and total cost of ownership, making parts availability and technician coverage central to winning chain specifications.
Competitive Landscape
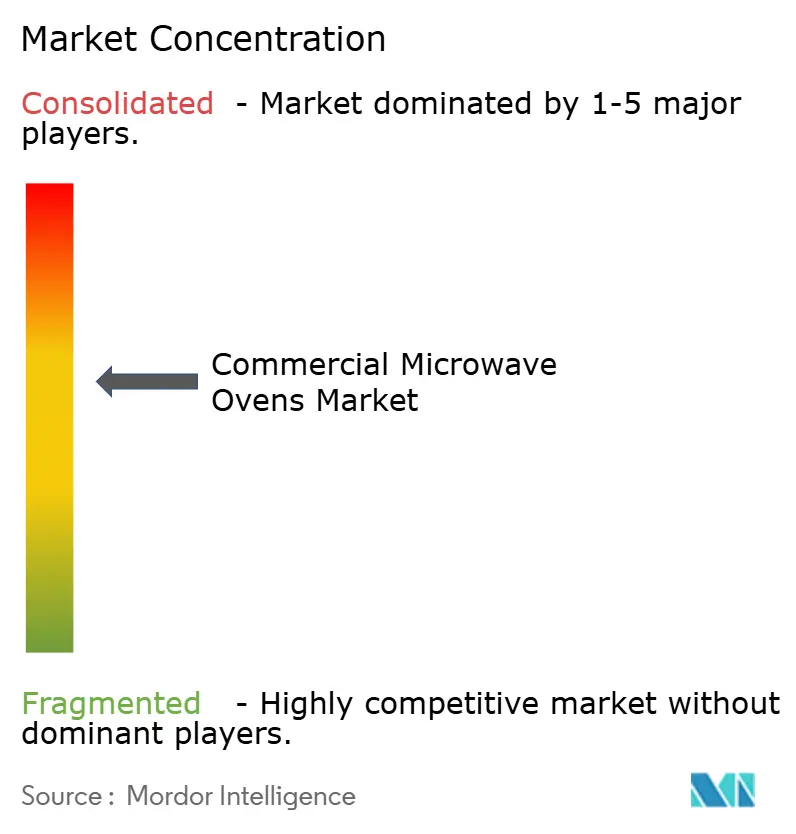
The commercial microwave ovens market is moderately concentrated, with the top five companies controlling about half of the global share, leaving opportunities for specialists focused on specific technologies or end-use needs. Panasonic, Midea Group with Galanz, Sharp, Ali Group’s portfolio including Merrychef and Amana Commercial, and Whirlpool form the core global players, supported by scale manufacturing and strong brand recognition. Samsung and LG extend their connected-appliance expertise into professional kitchens by integrating cameras, AI-based cooking logic, and Wi-Fi connectivity for chain-wide recipe consistency. The Middleby Corporation continues to advance its TurboChef and Merrychef high-speed oven lines within a broader commercial foodservice ecosystem centered on speed, uptime, and system integration. Multi-mode competitors such as Rational strengthen demand for ovens that combine microwave, steam, and hot air, appealing to operators seeking multifunctionality in a compact footprint.
Strategic initiatives across the sector emphasize vertical integration, connected service platforms, and faster expansion in Asia-Pacific markets. Middleby announced plans to spin off its food processing segment into a standalone public company by 2026, enabling its commercial foodservice division to pursue acquisitions with a more focused capital structure. The company’s Commercial Foodservice platform generated USD 2.38 billion in revenue in 2024 with adjusted EBITDA margins above 27%, reflecting strong performance in high-speed ovens and connected services. Panasonic highlighted its financial resilience in 2025 while expanding partnerships around AI-enabled cooking assistants that help standardize output across restaurant chains. Samsung also introduced AI-driven camera systems that automatically recognize food and optimize settings, reducing training requirements and simplifying kitchen workflows.
Manufacturing scale and component access are increasingly used to shorten lead times and stabilize supply chains. Midea invested RMB 8.8 billion (USD 1.21 billion) in R&D during the first half of 2025 and reached RMB 43 billion (USD 5.89 billion) over three years, while expanding overseas manufacturing to improve regional responsiveness and reduce logistics risk[3]Midea Global Communications, “Midea Wins Forbes China Flagship Brand Again,” Midea Group, midea.com. Whirlpool committed USD 300 million to U.S. facilities in 2025 to enhance automation, energy efficiency, and domestic production of connected appliances[4]Whirlpool Investor Relations, “Q3 2025 Earnings Presentation,” Whirlpool Corporation, whirlpoolcorporation.com. Alto-Shaam showcased new school nutrition ovens and marked a milestone anniversary with Energy Star-certified combi models designed for institutional reliability and efficiency. Across the industry, vendors are strengthening cybersecurity documentation to meet evolving EU requirements, while solid-state RF technology remains a premium but promising pathway toward more precise energy control in future connected platforms.
Commercial Microwave Ovens Industry Leaders
-
Panasonic Corporation
-
Midea Group (Galanz)
-
Sharp Corporation
-
Ali Group (Amana / Menumaster)
-
Whirlpool Corporation
- *Disclaimer: Major Players sorted in no particular order

Market Opportunities and Future Outlook
Connectivity and automation are creating a clearer opportunity for commercial microwave ovens that fit into broader kitchen data ecosystems instead of operating as standalone appliances. Standards and protocols such as the NAFEM Data Protocol and OPC UA (OPC-30200) provide non-proprietary paths for equipment to software integration, supporting use cases already visible in multi-site operations, including cloud recipe governance, digital cook records, and remote diagnostics. NSF/ANSI 4-2025 (released by NSF International in January 2026) also reinforces procurement emphasis on documented sanitation and performance expectations for commercial cooking and rethermalization equipment, aligning with the market shift toward programmable and audit-friendly workflows.
Energy control and precision heating are another opportunity area as operators scrutinize idle consumption and target repeatable output during labor shortages. Inverter-based platforms are gaining commercial traction because they support power modulation and steadier results, and Panasonic Professional Kitchen product actions in 2026 point to active vendor investment in this direction, including new inverter-heavy-duty models introduced in the year. Regionally, tighter standby power requirements in Canada from June 2026 strengthen the business case for low-idle controls and efficient power electronics. At the same time, the continued rise of ventless, compact high-speed formats supports deployments in small-footprint urban stores that need hot menus without ventilation retrofits.
Recent Industry Developments
- April 2026: EnWave Corporation signed an exclusive royalty-bearing commercial license agreement with The Dry Hub in Egypt and tied it to the acquisition of a 10 kW Radiant Energy Vacuum (REV) drying machine for commercial operations. The deal expands industrial microwave-enabled processing capacity through a licensing model, showing how microwave energy platforms are being commercialized beyond traditional foodservice ovens.
- December 2025: Sharp Electronics of Canada expanded its commercial microwave push in Canada by naming The Riccio Group (Oakville, Ontario) as an authorized distributor, supporting broader availability of medium-duty and heavy-duty TwinTouch units. Strengthening regional distribution improves access, service reach, and specification support for foodservice buyers standardizing equipment across multiple sites.
- February 2024: Panasonic implemented a refresh of its professional microwave lineup in key foodservice channels, emphasizing inverter-based control and improved programmability for repeatable outcomes. The product updates reinforced the shift toward precision heating and simplified operations, aligning with chain requirements for standardized processes and reduced training time.


Research Methodology Framework and Report Scope
Market Definition and Coverage
We define the commercial microwave ovens market as revenues from new microwave ovens built and marketed for professional kitchens, where performance duty cycle and safety certifications fit foodservice use in restaurants, hotels, institutions, and convenience retail.
Scope exclusions: We exclude household microwaves sold for domestic use, and we also exclude aftermarket servicing, spare parts, and used equipment resale values.
Segmentation Overview
-
By Wattage / Power Output
- Light-Duty ( Less than 1.2 kW)
- Medium-Duty (1.2–2.0 kW)
- Heavy-Duty (More than 2.0 kW)
-
By Product Type
- Countertop / Freestanding
- Built-in / Over-the-Range
- High-speed / Combination
-
By End-user Industry
- Quick-Service & Fast-Casual Restaurants
- Full-Service Restaurants & Hotels
- Convenience & Grocery Stores
- Institutional Catering (Hospitals, Schools, Airports)
-
By Distribution Channel
-
B2C/Retail
- Multi-brand Stores
- Exclusive Brand Outlets
- Online
- Other Distribution Channels
- B2B/Directly from the Manufacturers
-
B2C/Retail
-
By Geography
-
North America
- Canada
- United States
- Mexico
-
South America
- Brazil
- Peru
- Chile
- Argentina
- Rest of South America
-
Asia-Pacific
- India
- China
- Japan
- Australia
- South Korea
- South East Asia (Singapore, Malaysia, Thailand, Indonesia, Vietnam, Philippines)
- Rest of Asia-Pacific
-
Europe
- United Kingdom
- Germany
- France
- Spain
- Italy
- BENELUX (Belgium, Netherlands, Luxembourg)
- NORDICS (Denmark, Finland, Iceland, Norway, Sweden)
- Rest of Europe
-
Middle East and Africa
- United Arab Emirates
- Saudi Arabia
- South Africa
- Nigeria
- Rest of Middle East and Africa
-
North America
Data Sources, Market Sizing, and Validation
Desk Research
Desk research starts with identifying the real demand pool for commercial kitchens, and then mapping what equipment gets installed and replaced in those sites over time. We use public sources such as the US Census Bureau (foodservice and accommodation counts), Eurostat business statistics, UN Comtrade trade flows for microwave ovens and parts, and International Energy Agency (IEA) data for electricity use context, which helps sanity-check adoption patterns by region.
To keep the model grounded in operating reality, we also review company annual reports, investor presentations, product compliance notes, and reputed press coverage on restaurant expansion and kitchen automation. Where needed, we reference paid subscriptions for company financials and intelligence, shipment-level import and export records, and patent databases to spot feature shifts that can affect average selling prices. The sources listed above are illustrative, and many other public and paid references were also used to fill gaps, validate assumptions, and clarify definitions.
Primary Interviews and Surveys
Primary work is used to confirm what is counted as a commercial unit, how replacement cycles differ by kitchen format, and how pricing moves by wattage class and feature set. We spoke with manufacturers, distributors, service partners, and large foodservice buyers across APAC, EMEA, and the Americas, so regional installation intensity and channel margins could be normalized into one global model.
Distribution of primary research fieldwork respondents
| Company type | Respondent position | Region |
|---|---|---|
| Top tier: 36% | CXOs: 19% | APAC: 44% |
| Mid tier: 42% | Functional/Unit leaders: 25% | EMEA: 36% |
| Smaller Players: 22% | Managers: 56% | Americas: 20% |
Market-Sizing & Forecasting
The core sizing logic uses a top-down build that reconstructs demand from foodservice outlet counts, new opening rates, and replacement timing, which are then converted into annual unit demand by typical microwave penetration in each kitchen format. Once units are estimated, values are calculated using region-level average selling prices that reflect wattage bands, duty classes, and the share of high-speed combination models used in busy formats.
To keep totals realistic, we corroborate results using selective bottom-up approximations, such as supplier revenue splits where available, channel checks on unit volumes, and sampled price points across light, medium, and heavy-duty products. Key inputs that tend to move the model include quick-service restaurant and convenience store outlet growth, installation density per site, replacement cycles tied to usage intensity, average power class mix (used as a proxy for price), and regional import dependence that can shift pricing and availability. For forecasting, scenario analysis is applied around outlet growth and replacement timing, and then it is cross-checked against expert views on price progression and feature adoption so the final curve stays practical.
Data Validation & Update Cycle
Before results are finalized, outputs are checked against independent signals like trade trends, observed product price bands, and the implied equipment spend per foodservice site. Variances that look too large are traced back to the driver level, and assumptions are adjusted only after re-checking notes from interviews and revisiting the source trail.
A second analyst review is performed to ensure definitions and unit-to-value logic stay consistent across regions, followed by targeted re-contacts when a key assumption moves. Reports are refreshed annually, and interim updates are made when major events materially change demand or pricing. Right before delivery, a final pass is completed so clients receive the most current view available.
Mordor Intelligence's Global Commercial Microwave Ovens Market Size Versus Other Published Estimates
Published market sizes for commercial microwave ovens can differ more than buyers expect, mainly because the market boundary is not always treated the same way and because price and unit-mix assumptions are handled differently. Differences also come from whether the estimate is anchored to a clear demand pool (installed base and replacements) or mainly extrapolated from broad appliance totals.
The biggest gap drivers in this space usually come down to whether high-speed combination ovens are counted, how duty classes are defined (light, medium, and heavy), and if the pricing curve is updated for inflation, tariffs, and channel markups by region. When the model ties demand to outlet openings and replacement cycles, and then keeps average selling prices aligned to power class and feature mix, the size tends to land in a narrower range. This is the approach used here and applied by Mordor Intelligence.
Benchmark comparison
| Source | Market Size | Gaps in Research Methodology |
|---|---|---|
| Mordor Intelligence | USD 1.66 B (2026) | |
| Trade Publisher A | USD 2.26 B (2024) | This figure is earlier-year and appears to use a broader unit scope with less visibility into duty-cycle definitions, which can pull in adjacent oven formats and lift the value before replacement timing is normalized. |
| Market Analytics B | USD 2.65 B (2024) | The estimate is higher and likely assumes a faster shift to premium, feature-rich models across regions, with limited evidence of separate pricing by wattage class and channel, which can overstate the average selling price. |
The spread in the table is largely explained by scope and pricing mechanics rather than a disagreement on underlying foodservice growth. By keeping the demand pool tied to commercial kitchen sites and then translating it into values using observable power-class and feature-mix pricing, the resulting market size stays traceable to inputs that can be rechecked and updated.


Key Questions Answered in the Report
What is the current size and outlook for the commercial microwave ovens market through 2031?
The commercial microwave ovens market size is USD 1.66 billion in 2026 and is projected to reach USD 2.39 billion by 2031 at a 7.53% CAGR, reflecting sustained demand for programmable and ventless high‑speed formats in multi‑site foodservice.
Which product types are growing fastest in commercial microwave ovens?
High‑speed or combination ovens integrating microwave, convection, and impingement are projected to expand at 11.72% annually through 2031 as operators pursue cycle‑time reductions and menu versatility without hoods.
Which end‑users account for the largest demand in commercial microwave ovens?
Quick‑service restaurants led with 42.24% share in 2025 due to their high throughput needs, while convenience and grocery stores are the fastest growing with a 9.33% CAGR as hot grab‑and‑go expands.
What region leads and which region will grow fastest in commercial microwave ovens?
North America led with 36.65% share in 2025, while Asia‑Pacific is forecast as the fastest growing at 11.32% CAGR from 2026 to 2031 on the back of chain rollouts and compact, automated formats.
Which wattage class dominates the commercial microwave ovens landscape?
Heavy‑duty ovens above 2.0 kilowatts held 41.26% of revenue in 2025 and are projected to grow at 9.37% annually through 2031 as drive‑through and delivery‑heavy formats concentrate on speed and consistency.
How is connectivity influencing purchasing decisions in commercial microwave ovens?
Buyers are prioritizing ovens with Wi‑Fi, cloud recipe management, and predictive maintenance since these features reduce training time, improve compliance, and cut unplanned downtime across large fleets.
Page last updated on:


 Your data is secure and never sold or shared.


