| Study Period | 2017 - 2030 |
| Base Year For Estimation | 2024 |
| Forecast Data Period | 2025 - 2030 |
| Market Size (2025) | USD 1.35 Billion |
| Market Size (2030) | USD 1.85 Billion |
| CAGR (2025 - 2030) | 6.42 % |
| Market Concentration | Low |
Major Players*Disclaimer: Major Players sorted in no particular order |

Collagen Market Analysis
The Collagen Market size is estimated at 1.35 billion USD in 2025, and is expected to reach 1.85 billion USD by 2030, growing at a CAGR of 6.42% during the forecast period (2025-2030).
The collagen industry is experiencing significant transformation driven by shifting consumer preferences toward functional and nutritional products. The growing emphasis on preventive healthcare and wellness has led to increased adoption of collagen-based supplements and fortified products. According to a 2023 CRN Consumer Survey, 74% of US adults now consume dietary supplements, highlighting the mainstream acceptance of nutritional supplementation. This trend is particularly pronounced in developed markets where consumers are increasingly willing to pay premium prices for products with proven health benefits. The industry is also witnessing a surge in research and development activities focused on improving collagen bioavailability and effectiveness.
The sports nutrition and active lifestyle segments are emerging as key growth drivers for collagen products. Recent data shows that 38% of adults in the European Union engaged in sports or exercise at least once a week in 2022, creating a substantial market for performance-oriented collagen supplements. Manufacturers are responding by developing innovative formulations that combine collagen with other functional ingredients to enhance athletic performance and recovery. The industry is also seeing increased demand from fitness enthusiasts and professional athletes who recognize collagen's role in joint health and muscle recovery.
Demographic shifts are significantly influencing market dynamics, particularly in Asia-Pacific regions. In Southeast Asia, the proportion of individuals aged 60 years and older is projected to rise to 13.7% by 2030, creating sustained demand for collagen products targeting age-related concerns. This demographic transition is prompting manufacturers to develop specialized formulations addressing specific age-related needs, from skin elasticity to joint health. The industry is also witnessing increased integration of traditional and modern approaches to collagen supplementation, particularly in markets with strong traditional medicine practices.
The collagen industry is experiencing notable shifts in raw material sourcing and production methods. Brazil, as the world's second-largest beef producer with an annual production of 9.85 billion kg in 2022, plays a crucial role in the supply chain for animal-based collagen. However, the industry is increasingly diversifying its sourcing strategies, with marine collagen gaining prominence due to sustainability concerns and religious considerations. Manufacturers are investing in advanced processing technologies to improve extraction efficiency and product quality. The industry is also witnessing increased focus on transparency and traceability in the supply chain, with companies implementing sophisticated tracking systems to ensure product authenticity and quality.
Global Collagen Market Trends
Healthy snacking preferences with growth in online platforms are supporting market growth
- Consumers worldwide increasingly embrace a snacking lifestyle with a heightened focus on health. This shift is evident in their preference for nutritious alternatives over traditional snacks. For instance, in June 2021, 25% of Gen Zs (16 to 24 years old) in the United Kingdom favored snacks labeled "low in calories," while 18% of millennials (25 to 34 years old) sought out high-protein options. Additionally, 36% of those over 55 actively sought snacks with "low" or "no sugar" content. Consequently, leading industry players have responded by introducing a variety of low-fat and low-calorie offerings.
- Furthermore, with users increasingly relying on social media for food trends and inspiration, platforms like Instagram and YouTube have emerged as crucial tools for discovering new snacks. Over 70% of global consumers, particularly Gen Zs and millennials, attributed their discovery of new snacks in 2022 to social media. The rise of online platforms has further streamlined the process, allowing consumers to explore and purchase a diverse range of snacks from the comfort of their homes.
- Also, premiumization is driving innovation innovation in the snacks segment, emphasizing fresh, better-for-you, and functional snacks. Bold, spicy flavors and exotic ingredients are gaining traction, appealing to a diverse global palate and fueling growth in regional markets. Snacking has transcended mere sustenance, becoming deeply ingrained in modern culture. It has become common to snack while working or enjoying entertainment at home. For example, a November 2022 report from Godrej Yummiez highlighted that 45% of Indian consumers favored snacking during parties and celebrations. This cultural shift highlights the transformation of snacking from a personal choice to a societal expectation.

Understand The Key Trends Shaping This Market
Download PDF
Meat is majorly used as a raw material by collagen manufacturers
- Meat is an important source of nutrition for people around the world. Global demand for meat has grown over the past 50 years, with meat production tripling. Global produce presently stands at more than 350 million tonnes each year. Regionally, Asia-Pacific holds the position of being the largest meat producer, contributing a substantial portion of the total global meat production. This represents a significant shift from previous decades. Europe's meat output has also doubled in recent years. China is projected to account for most of the total increase in meat production, followed by the United States, Brazil, and India.
- The United States takes the crown as the top producer of beef and buffalo meat, with Brazil and China following suit. Noteworthy contributions also come from Argentina, Australia, and India. In the poultry realm, the United States leads the pack, with China and Brazil playing pivotal roles. As a collective, Europe matches the United States in its substantial poultry output. However, in high-income nations, where per capita meat consumption is already high, a plateau or even a decline in demand is foreseen. This shift is attributed to aging populations and evolving dietary preferences, emphasizing a broader protein palette.
- Expanding herds and flocks, especially in China, are underpinning global meat production's upward trajectory. This trend is set to bolster productivity, coupled with advancements in animal breeding and technology, particularly in low and middle-income nations. Poultry meat, in particular, is driving this surge in global meat production.

OTHER KEY INDUSTRY TRENDS COVERED IN THE REPORT
- Rising trend of clean-label baby food and escalating strategic investments are driving the market globally
- Healthy trends in beverages are impacting market growth
- A rise in the demand for single-serve packets may augment production
- Dairy alternatives to witness significant growth
- Meat protein alternatives are revolutionizing the meat segment
- Rising health awareness and growing demand from millennials are driving the market
- Natural ingredients, coupled with product specificity, are largely driving the segmental sales
- Europe is the leading market with a high demand for bread and biscuits
- Growing preference for convenient breakfast options may augment the market
- Increase in at-home consumption and demand for healthy confectionery products
- Growing nutritional concerns for aging populations drive the demand for medical nutrition products globally
- Ready-to-cook and frozen foods have witnessed a surge in sales
- The increasing demand for compound feed containing functional ingredients is affecting sales within this segment
- Consumption and usage of animal protein in cosmetics and nutricosmetics are supporting the market’s growth globally
Segment Analysis: Form
Animal-based Segment in Collagen Market
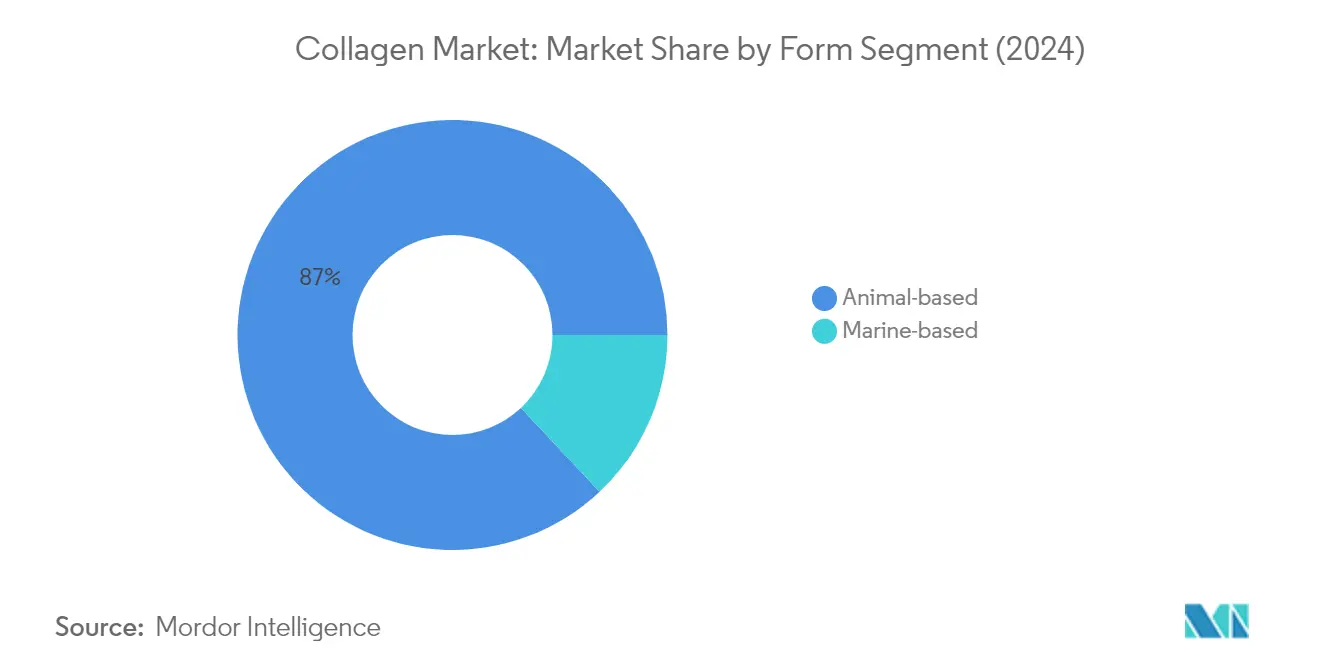
Animal-based collagen maintains its dominant position in the global collagen market, commanding approximately 87% of the market share in 2024. This segment's leadership is primarily attributed to the high demand for bovine collagen, which is particularly suitable for complete body health and recovery. The food and beverage industry represents the largest application area for animal-based collagen globally, with beverages and bakery sub-segments accounting for over 30% and 46%, respectively, of the total volume consumption. The segment's strong market position is further reinforced by the abundant availability of raw materials and competitive pricing, with both pork and bovine sources offering high market penetration. Additionally, depending on the quality of bovine hides, the yield of animal-based collagen can be as high as 20%, contributing to lower production costs and making it approximately 33% less expensive than marine-based alternatives.
Marine-based Segment in Collagen Market
The marine-based collagen segment is emerging as the fastest-growing segment in the global collagen market, projected to expand at approximately 7% CAGR from 2024 to 2029. This remarkable growth is driven by several factors, including its superior bioavailability compared to other collagen types and its ability to be absorbed up to 1.5 times more effectively than collagen from bovine and porcine sources. Marine collagen is particularly valued in the health and beauty sector due to its enhanced anti-aging properties and higher absorption rate. The segment's growth is also supported by increasing consumer awareness about sustainable and clean-label products, as marine collagen is often sourced from fish processing by-products. Despite its higher price point and lower processing yields of about 1.2%, marine collagen's unique properties and growing acceptance in premium applications continue to drive its market expansion.
Segment Analysis: End User
Food & Beverages Segment in Collagen Market
The Food & Beverages (F&B) segment dominates the global collagen market, commanding approximately 95% of the total market volume share in 2024. This substantial market presence is primarily driven by the increasing integration of collagen in various F&B applications, particularly in beverages, which represent over 44% of the total F&B consumption volume. The segment's dominance is attributed to collagen's versatility as a texturant, stabilizer, and thickener, along with its nutritional benefits. The beverage sub-segment leads the applications, particularly in ready-to-drink (RTD) products and functional drinks, followed by significant usage in bakery products and snacks. Manufacturers are actively incorporating collagen peptides into food and beverages, as they enhance product quality while providing additional health benefits, particularly in beauty drinks and protein-enriched products.
Personal Care & Cosmetics Segment in Collagen Market
The Personal Care & Cosmetics segment is emerging as the fastest-growing segment in the collagen market, projected to expand at approximately 7% CAGR by volume during 2024-2029. This remarkable growth is driven by increasing consumer awareness of collagen's benefits in skincare and anti-aging applications. The segment's growth is particularly notable in skincare products, where collagen serves as a natural humectant and moisturizer, becoming a primary component in cosmetic formulations. The rising demand is further fueled by the growing preference for natural and effective beauty solutions, with collagen being increasingly incorporated into various personal care products, including face masks, moisturizers, and anti-aging serums. The segment's expansion is also supported by innovative product developments and the rising trend of beauty-from-within products.
Remaining Segments in End User Segmentation
The supplements and animal feed segments, while smaller in market share, play significant roles in the collagen market's diversification. The supplements segment, encompassing both elderly nutrition and sports/performance nutrition, is gaining traction due to increasing health consciousness and the growing demand for protein-based dietary supplements. The animal feed segment, though currently modest in size, is showing promising growth potential, particularly in applications for pet food and livestock nutrition. These segments are benefiting from increasing research and development activities, leading to new product innovations and applications. The growing awareness of collagen's benefits in animal health and nutrition, combined with the rising demand for premium pet care products, continues to drive growth in these secondary but important market segments.
Collagen Market Geography Segment Analysis
Collagen Market in Africa
The African collagen market demonstrates unique characteristics driven by increasing commercial activities and regional expansion strategies. Nigeria leads the market with aggressive expansion initiatives, particularly in the bakery and beverage segments, while South Africa shows strong potential due to increasing health consciousness among consumers. The region's growth is primarily fueled by the rising demand for processed foods, functional snacks, and beauty products, with a notable shift toward natural and organic ingredients.Collagen Market in Nigeria (Largest Market)Nigeria dominates the African collagen market, holding approximately a 21% share in 2024. The country's market leadership is attributed to its extensive commercial activities and robust food and beverage industry integration. Nigerian consumers demonstrate increasing awareness about health benefits, particularly in beauty and anti-aging products, driving substantial demand for collagen-based products across various applications.Collagen Market in Nigeria (Fastest Growing)Nigeria also emerges as the fastest-growing market in Africa, with a projected growth rate of approximately 11% during 2024-2029. This exceptional growth is driven by increasing urbanization, rising disposable income, and growing awareness about health and wellness products. The country's beverage industry, particularly the beauty drinks segment, shows remarkable potential with increasing consumer preference for collagen-enriched products.
Collagen Market in Asia-Pacific
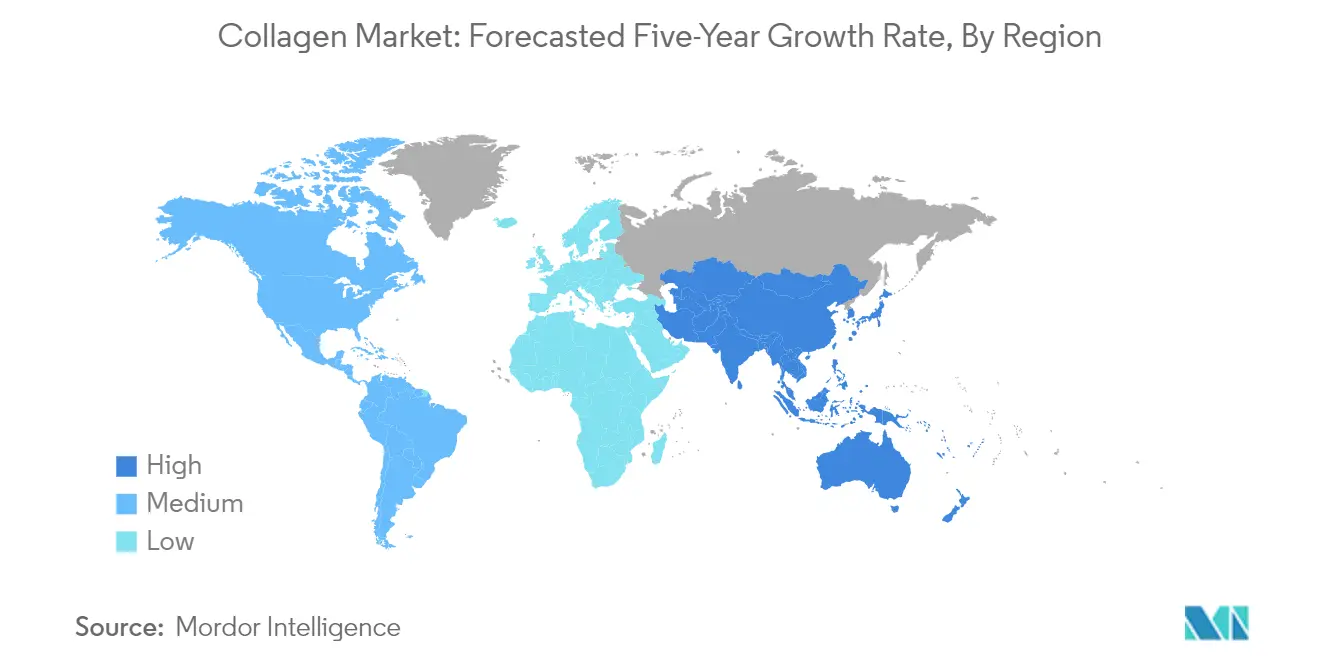
The Asia-Pacific region is a significant contributor to the global collagen market, with China leading the region with a 61.79% share in 2024. The region's growth is driven by the increasing demand for collagen in the food and beverage, healthcare, and cosmetics industries. Notably, the collagen market in India is experiencing rapid growth, with a CAGR of 7.69%, making it the fastest-growing market in the region. This growth is attributed to rising health awareness and increasing adoption of collagen-based products in dietary supplements and personal care.
Collagen Market in Europe
Europe's collagen industry is characterized by a strong presence in the food and beverage sector, with Russia leading the market. The region's growth is supported by the increasing demand for functional foods and nutraceuticals. Turkey stands out with the fastest growth rate in Europe, at a CAGR of 7.93%, driven by the rising consumer preference for health and wellness products.
Collagen Market in North America
In North America, the United States dominates the collagen industry, supported by a well-established food and beverage sector. The region's growth is further propelled by the increasing demand for collagen in dietary supplements and personal care products. Mexico, with a CAGR of 9.35%, is the fastest-growing market in North America, reflecting the growing consumer interest in health and wellness.
Collagen Market in Middle East
The Middle East collagen industry is witnessing significant growth, with Iran leading the region with a CAGR of 9.01%. The market's expansion is driven by the increasing demand for collagen in the beauty and personal care sectors, as well as the rising awareness of the health benefits associated with collagen consumption.
Collagen Market in South America
Brazil leads the South American collagen industry with a 47.74% market share in 2024, driven by the increasing demand for collagen in the food and beverage sector. Argentina is the fastest-growing market in the region, with a CAGR of 6.54%, fueled by the rising consumer awareness of the benefits of collagen in health and wellness.
Collagen World Overview
The collagen world is witnessing a dynamic transformation, with significant growth across various regions. The global demand for collagen is driven by its versatile applications in the food and beverage, healthcare, and cosmetics industries. As consumers become more health-conscious, the adoption of collagen-based products continues to rise, presenting lucrative opportunities for market players worldwide.
Get Analysis on Important Geographic Markets
Download PDF
Collagen Industry Overview
Top Companies in Collagen Market
The collagen market is characterized by continuous product innovation and strategic expansion initiatives by key players like Darling Ingredients Inc., Nitta Gelatin Inc., Italgelatine SpA, and Nippi Inc. Companies are focusing on developing specialized collagen variants for specific applications while simultaneously expanding their production capabilities through new facilities and technology investments. Strategic partnerships and collaborations, particularly in emerging markets, have become increasingly common as companies seek to strengthen their market positions and access new customer segments. The industry has witnessed a significant emphasis on sustainable sourcing practices and clean-label certifications, with manufacturers investing in R&D to develop novel extraction methods and improve product efficacy. Operational agility has become crucial, with companies adopting flexible manufacturing processes to meet varying customer demands and regulatory requirements across different regions.
Fragmented Market with Regional Leadership Dynamics
The global collagen market exhibits a fragmented structure with a mix of large multinational corporations and specialized regional players. Major companies have established strong footholds in their respective regions through extensive distribution networks and long-standing customer relationships. European manufacturers, particularly from Germany and Italy, have maintained leadership in premium segments through their focus on quality and innovation. Asian players, especially from Japan and China, have gained prominence through cost-effective production capabilities and growing domestic demand.
The market has witnessed selective consolidation through strategic acquisitions, primarily focused on expanding geographical presence and enhancing product portfolios. Companies are increasingly pursuing vertical integration strategies to ensure raw material security and maintain quality control. While global players dominate in terms of technology and market reach, regional specialists have carved out strong niches in specific application areas or geographical markets. The industry structure promotes healthy competition while maintaining barriers to entry through technical expertise and regulatory compliance requirements.
Innovation and Sustainability Drive Future Growth
Success in the collagen industry increasingly depends on developing innovative products that address specific end-user needs while maintaining cost competitiveness. Incumbent players must focus on expanding their application scope through targeted R&D investments and strategic partnerships with end-user industries. The ability to offer customized solutions, particularly in high-growth segments like nutraceuticals and cosmeceuticals, will be crucial for maintaining market leadership. Companies need to strengthen their sustainability credentials through responsible sourcing practices and eco-friendly processing methods.
For emerging players and contenders, differentiation through specialized product offerings and focus on underserved market segments presents significant opportunities. Building strong relationships with raw material suppliers and investing in advanced processing technologies will be essential for gaining market share. The industry faces moderate substitution risk from plant-based alternatives, making it crucial for companies to emphasize collagen's unique benefits and applications. Regulatory compliance, particularly in food and cosmetic applications, will continue to influence market dynamics, making it essential for companies to maintain robust quality management systems and documentation practices. A comprehensive analysis of the collagen market is vital for understanding these dynamics and strategizing accordingly.
Collagen Market Leaders
-
Darling Ingredients Inc.
-
GELITA AG
-
Italgelatine SpA
-
Nippi. Inc.
-
Nitta Gelatin Inc.
- *Disclaimer: Major Players sorted in no particular order

Need More Details on Market Players and Competiters?
Download PDF
Collagen Market News
- July 2022: Jellice Taiwan launched META Collagen to expand its product portfolio.
- February 2022: Nippi (Shanghai) Trading Co. Ltd (“Nippi Shanghai”), a subsidiary of Nippi Japan, signed a cooperation agreement with Infobird Co. Ltd, an AI-enabled customer engagement solutions provider, to increase its sales and grow its market share as a supplier of collagen raw materials to the Chinese market.
- March 2021: GELITA USA opened its new collagen peptide unit, a 30,000-square-foot production unit at the southeastern end of the complex in the Port Neal industrial area near Sioux City in Iowa. This expansion is majorly driven by the double-digit market growth of GELITA’s collagen peptides, especially in the health and beauty markets, with no sign of slowing down in the future.
Free With This Report
We provide a comprehensive and exhaustive set of data pointers for global, regional, and country-level metrics that illustrate the fundamentals of the protein industry. With the help of 45+ free charts, clients can access in-depth market analysis based on per capita consumption of animal and plant protein, end-user market volume, and production data of raw materials for protein ingredients, through granular-level segmental information supported by a repository of market data, trends, and expert analysis. Data and analysis on protein sources, protein types, forms, end-user segments, etc., are available in the form of comprehensive reports as well as Excel-based data worksheets.


Collagen Market Report - Table of Contents
1. EXECUTIVE SUMMARY & KEY FINDINGS
2. INTRODUCTION
- 2.1 Study Assumptions & Market Definition
- 2.2 Scope of the Study
- 2.3 Research Methodology
3. KEY INDUSTRY TRENDS
-
3.1 End User Market Volume
- 3.1.1 Baby Food and Infant Formula
- 3.1.2 Bakery
- 3.1.3 Beverages
- 3.1.4 Breakfast Cereals
- 3.1.5 Condiments/Sauces
- 3.1.6 Confectionery
- 3.1.7 Dairy and Dairy Alternative Products
- 3.1.8 Elderly Nutrition and Medical Nutrition
- 3.1.9 Meat/Poultry/Seafood and Meat Alternative Products
- 3.1.10 RTE/RTC Food Products
- 3.1.11 Snacks
- 3.1.12 Sport/Performance Nutrition
- 3.1.13 Animal Feed
- 3.1.14 Personal Care and Cosmetics
-
3.2 Protein Consumption Trends
- 3.2.1 Animal
-
3.3 Production Trends
- 3.3.1 Animal
-
3.4 Regulatory Framework
- 3.4.1 China
- 3.4.2 France
- 3.4.3 Germany
- 3.4.4 India
- 3.4.5 Italy
- 3.4.6 Japan
- 3.4.7 United Kingdom
- 3.4.8 United States
- 3.5 Value Chain & Distribution Channel Analysis
4. MARKET SEGMENTATION (includes market size in Value in USD and Volume, Forecasts up to 2030 and analysis of growth prospects)
-
4.1 Form
- 4.1.1 Animal Based
- 4.1.2 Marine Based
-
4.2 End User
- 4.2.1 Animal Feed
- 4.2.2 Food and Beverages
- 4.2.2.1 By Sub End User
- 4.2.2.1.1 Bakery
- 4.2.2.1.2 Beverages
- 4.2.2.1.3 Breakfast Cereals
- 4.2.2.1.4 Snacks
- 4.2.3 Personal Care and Cosmetics
- 4.2.4 Supplements
- 4.2.4.1 By Sub End User
- 4.2.4.1.1 Elderly Nutrition and Medical Nutrition
- 4.2.4.1.2 Sport/Performance Nutrition
-
4.3 Region
- 4.3.1 Africa
- 4.3.1.1 By Form
- 4.3.1.2 By End User
- 4.3.1.3 By Country
- 4.3.1.3.1 Nigeria
- 4.3.1.3.2 South Africa
- 4.3.1.3.3 Rest of Africa
- 4.3.2 Asia-Pacific
- 4.3.2.1 By Form
- 4.3.2.2 By End User
- 4.3.2.3 By Country
- 4.3.2.3.1 Australia
- 4.3.2.3.2 China
- 4.3.2.3.3 India
- 4.3.2.3.4 Indonesia
- 4.3.2.3.5 Japan
- 4.3.2.3.6 Malaysia
- 4.3.2.3.7 New Zealand
- 4.3.2.3.8 South Korea
- 4.3.2.3.9 Thailand
- 4.3.2.3.10 Vietnam
- 4.3.2.3.11 Rest of Asia-Pacific
- 4.3.3 Europe
- 4.3.3.1 By Form
- 4.3.3.2 By End User
- 4.3.3.3 By Country
- 4.3.3.3.1 Belgium
- 4.3.3.3.2 France
- 4.3.3.3.3 Germany
- 4.3.3.3.4 Italy
- 4.3.3.3.5 Netherlands
- 4.3.3.3.6 Russia
- 4.3.3.3.7 Spain
- 4.3.3.3.8 Turkey
- 4.3.3.3.9 United Kingdom
- 4.3.3.3.10 Rest of Europe
- 4.3.4 Middle East
- 4.3.4.1 By Form
- 4.3.4.2 By End User
- 4.3.4.3 By Country
- 4.3.4.3.1 Iran
- 4.3.4.3.2 Saudi Arabia
- 4.3.4.3.3 United Arab Emirates
- 4.3.4.3.4 Rest of Middle East
- 4.3.5 North America
- 4.3.5.1 By Form
- 4.3.5.2 By End User
- 4.3.5.3 By Country
- 4.3.5.3.1 Canada
- 4.3.5.3.2 Mexico
- 4.3.5.3.3 United States
- 4.3.5.3.4 Rest of North America
- 4.3.6 South America
- 4.3.6.1 By Form
- 4.3.6.2 By End User
- 4.3.6.3 By Country
- 4.3.6.3.1 Argentina
- 4.3.6.3.2 Brazil
- 4.3.6.3.3 Rest of South America
5. COMPETITIVE LANDSCAPE
- 5.1 Key Strategic Moves
- 5.2 Market Share Analysis
- 5.3 Company Landscape
-
5.4 Company Profiles (includes Global Level Overview, Market Level Overview, Core Business Segments, Financials, Headcount, Key Information, Market Rank, Market Share, Products and Services, and Analysis of Recent Developments).
- 5.4.1 ASAHI GELATINE INDUSTRIAL Co.,Ltd.
- 5.4.2 Darling Ingredients Inc.
- 5.4.3 Ewald-Gelatine GmbH
- 5.4.4 Foodchem International Corporation
- 5.4.5 GELITA AG
- 5.4.6 Italgelatine SpA
- 5.4.7 Jellice Pioneer Private Limited
- 5.4.8 Nippi. Inc.
- 5.4.9 Nitta Gelatin Inc.
6. KEY STRATEGIC QUESTIONS FOR PROTEIN INGREDIENTS INDUSTRY CEOS
7. APPENDIX
-
7.1 Global Overview
- 7.1.1 Overview
- 7.1.2 Porter’s Five Forces Framework
- 7.1.3 Global Value Chain Analysis
- 7.1.4 Market Dynamics (DROs)
- 7.2 Sources & References
- 7.3 List of Tables & Figures
- 7.4 Primary Insights
- 7.5 Data Pack
- 7.6 Glossary of Terms
You Can Purchase Parts Of This Report. Check Out Prices For Specific Sections
Get Price Break-up Now
List of Tables & Figures
- Figure 1:
- VOLUME OF BABY FOOD AND INFANT FORMULA MARKET, METRIC TON, GLOBAL, 2017 - 2029
- Figure 2:
- VOLUME OF BAKERY MARKET, METRIC TON, GLOBAL, 2017 - 2029
- Figure 3:
- VOLUME OF BEVERAGES MARKET, METRIC TON, GLOBAL, 2017 - 2029
- Figure 4:
- VOLUME OF BREAKFAST CEREALS MARKET, METRIC TON, GLOBAL, 2017 - 2029
- Figure 5:
- VOLUME OF CONDIMENTS/SAUCES MARKET, METRIC TON, GLOBAL, 2017 - 2029
- Figure 6:
- VOLUME OF CONFECTIONERY MARKET, METRIC TON, GLOBAL, 2017 - 2029
- Figure 7:
- VOLUME OF DAIRY AND DAIRY ALTERNATIVE PRODUCTS MARKET, METRIC TON, GLOBAL, 2017 - 2029
- Figure 8:
- VOLUME OF ELDERLY NUTRITION AND MEDICAL NUTRITION MARKET, METRIC TON, GLOBAL, 2017 - 2029
- Figure 9:
- VOLUME OF MEAT/POULTRY/SEAFOOD AND MEAT ALTERNATIVE PRODUCTS MARKET, METRIC TON, GLOBAL, 2017 - 2029
- Figure 10:
- VOLUME OF RTE/RTC FOOD PRODUCTS MARKET, METRIC TON, GLOBAL, 2017 - 2029
- Figure 11:
- VOLUME OF SNACKS MARKET, METRIC TON, GLOBAL, 2017 - 2029
- Figure 12:
- VOLUME OF SPORT/PERFORMANCE NUTRITION MARKET, METRIC TON, GLOBAL, 2017 - 2029
- Figure 13:
- VOLUME OF ANIMAL FEED MARKET, METRIC TON, GLOBAL, 2017 - 2029
- Figure 14:
- VOLUME OF PERSONAL CARE AND COSMETICS MARKET, METRIC TON, GLOBAL, 2017 - 2029
- Figure 15:
- AVERAGE PER CAPITA CONSUMPTION OF ANIMAL PROTEIN, GRAM PER DAY, GLOBAL, 2017 - 2029
- Figure 16:
- MEAT PRODUCTION, METRIC TON, GLOBAL, 2017 - 2022
- Figure 17:
- VOLUME OF COLLAGEN MARKET, TONNES, GLOBAL, 2017 - 2029
- Figure 18:
- VALUE OF COLLAGEN MARKET, USD, GLOBAL, 2017 - 2029
- Figure 19:
- VOLUME OF COLLAGEN MARKET BY FORM, METRIC TONNES, GLOBAL, 2017 - 2029
- Figure 20:
- VALUE OF COLLAGEN MARKET BY FORM, USD, GLOBAL, 2017 - 2029
- Figure 21:
- VALUE SHARE OF COLLAGEN MARKET BY FORM, %, GLOBAL, 2017 VS 2023 VS 2029
- Figure 22:
- VOLUME SHARE OF COLLAGEN MARKET BY FORM, %, GLOBAL, 2017 VS 2023 VS 2029
- Figure 23:
- VOLUME OF COLLAGEN MARKET, ANIMAL BASED, METRIC TONNES, GLOBAL, 2017 - 2029
- Figure 24:
- VALUE OF COLLAGEN MARKET, ANIMAL BASED, USD, GLOBAL, 2017 - 2029
- Figure 25:
- VALUE SHARE OF COLLAGEN MARKET BY END USER, % ANIMAL BASED , GLOBAL, 2022 VS 2029
- Figure 26:
- VOLUME OF COLLAGEN MARKET, MARINE BASED, METRIC TONNES, GLOBAL, 2017 - 2029
- Figure 27:
- VALUE OF COLLAGEN MARKET, MARINE BASED, USD, GLOBAL, 2017 - 2029
- Figure 28:
- VALUE SHARE OF COLLAGEN MARKET BY END USER, % MARINE BASED , GLOBAL, 2022 VS 2029
- Figure 29:
- VOLUME OF COLLAGEN MARKET BY END USER, METRIC TONNES, GLOBAL, 2017 - 2029
- Figure 30:
- VALUE OF COLLAGEN MARKET BY END USER, USD, GLOBAL, 2017 - 2029
- Figure 31:
- VALUE SHARE OF COLLAGEN MARKET BY END USER, %, GLOBAL, 2017 VS 2023 VS 2029
- Figure 32:
- VOLUME SHARE OF COLLAGEN MARKET BY END USER, %, GLOBAL, 2017 VS 2023 VS 2029
- Figure 33:
- VOLUME OF COLLAGEN MARKET, ANIMAL FEED, GLOBAL, 2017 - 2029
- Figure 34:
- VALUE OF COLLAGEN MARKET, ANIMAL FEED, GLOBAL, 2017 - 2029
- Figure 35:
- VALUE SHARE OF COLLAGEN MARKET BY FORM, % ANIMAL FEED , GLOBAL, 2022 VS 2029
- Figure 36:
- VOLUME OF COLLAGEN MARKET, FOOD AND BEVERAGES END USER, METRIC TONNES, GLOBAL, 2017 - 2029
- Figure 37:
- VALUE OF COLLAGEN MARKET, FOOD AND BEVERAGES END USER, USD, GLOBAL, 2017 - 2029
- Figure 38:
- VALUE SHARE OF COLLAGEN MARKET BY FOOD AND BEVERAGES END USER, %, GLOBAL, 2017 VS 2023 VS 2029
- Figure 39:
- VOLUME SHARE OF COLLAGEN MARKET BY FOOD AND BEVERAGES END USER, %, GLOBAL, 2017 VS 2023 VS 2029
- Figure 40:
- VOLUME OF COLLAGEN MARKET, BAKERY, METRIC TONNES, GLOBAL, 2017 - 2029
- Figure 41:
- VALUE OF COLLAGEN MARKET, BAKERY, USD, GLOBAL, 2017 - 2029
- Figure 42:
- VALUE SHARE OF COLLAGEN MARKET BY FORM, % BAKERY , GLOBAL, 2022 VS 2029
- Figure 43:
- VOLUME OF COLLAGEN MARKET, BEVERAGES, METRIC TONNES, GLOBAL, 2017 - 2029
- Figure 44:
- VALUE OF COLLAGEN MARKET, BEVERAGES, USD, GLOBAL, 2017 - 2029
- Figure 45:
- VALUE SHARE OF COLLAGEN MARKET BY FORM, % BEVERAGES , GLOBAL, 2022 VS 2029
- Figure 46:
- VOLUME OF COLLAGEN MARKET, BREAKFAST CEREALS, METRIC TONNES, GLOBAL, 2017 - 2029
- Figure 47:
- VALUE OF COLLAGEN MARKET, BREAKFAST CEREALS, USD, GLOBAL, 2017 - 2029
- Figure 48:
- VALUE SHARE OF COLLAGEN MARKET BY FORM, % BREAKFAST CEREALS , GLOBAL, 2022 VS 2029
- Figure 49:
- VOLUME OF COLLAGEN MARKET, SNACKS, METRIC TONNES, GLOBAL, 2017 - 2029
- Figure 50:
- VALUE OF COLLAGEN MARKET, SNACKS, USD, GLOBAL, 2017 - 2029
- Figure 51:
- VALUE SHARE OF COLLAGEN MARKET BY FORM, % SNACKS , GLOBAL, 2022 VS 2029
- Figure 52:
- VOLUME OF COLLAGEN MARKET, PERSONAL CARE AND COSMETICS, GLOBAL, 2017 - 2029
- Figure 53:
- VALUE OF COLLAGEN MARKET, PERSONAL CARE AND COSMETICS, GLOBAL, 2017 - 2029
- Figure 54:
- VALUE SHARE OF COLLAGEN MARKET BY FORM, % PERSONAL CARE AND COSMETICS , GLOBAL, 2022 VS 2029
- Figure 55:
- VOLUME OF COLLAGEN MARKET, SUPPLEMENTS END USER, METRIC TONNES, GLOBAL, 2017 - 2029
- Figure 56:
- VALUE OF COLLAGEN MARKET, SUPPLEMENTS END USER, USD, GLOBAL, 2017 - 2029
- Figure 57:
- VALUE SHARE OF COLLAGEN MARKET BY SUPPLEMENTS END USER, %, GLOBAL, 2017 VS 2023 VS 2029
- Figure 58:
- VOLUME SHARE OF COLLAGEN MARKET BY SUPPLEMENTS END USER, %, GLOBAL, 2017 VS 2023 VS 2029
- Figure 59:
- VOLUME OF COLLAGEN MARKET, ELDERLY NUTRITION AND MEDICAL NUTRITION, METRIC TONNES, GLOBAL, 2017 - 2029
- Figure 60:
- VALUE OF COLLAGEN MARKET, ELDERLY NUTRITION AND MEDICAL NUTRITION, USD, GLOBAL, 2017 - 2029
- Figure 61:
- VALUE SHARE OF COLLAGEN MARKET BY FORM, % ELDERLY NUTRITION AND MEDICAL NUTRITION , GLOBAL, 2022 VS 2029
- Figure 62:
- VOLUME OF COLLAGEN MARKET, SPORT/PERFORMANCE NUTRITION, METRIC TONNES, GLOBAL, 2017 - 2029
- Figure 63:
- VALUE OF COLLAGEN MARKET, SPORT/PERFORMANCE NUTRITION, USD, GLOBAL, 2017 - 2029
- Figure 64:
- VALUE SHARE OF COLLAGEN MARKET BY FORM, % SPORT/PERFORMANCE NUTRITION , GLOBAL, 2022 VS 2029
- Figure 65:
- VOLUME OF COLLAGEN MARKET BY REGION, METRIC TONNES, GLOBAL, 2017 - 2029
- Figure 66:
- VALUE OF COLLAGEN MARKET BY REGION, USD, GLOBAL, 2017 - 2029
- Figure 67:
- VALUE SHARE OF COLLAGEN MARKET BY REGION, %, GLOBAL, 2017 VS 2023 VS 2029
- Figure 68:
- VOLUME SHARE OF COLLAGEN MARKET BY REGION, %, GLOBAL, 2017 VS 2023 VS 2029
- Figure 69:
- VOLUME OF COLLAGEN MARKET BY FORM, METRIC TONNES, AFRICA, 2017 - 2029
- Figure 70:
- VALUE OF COLLAGEN MARKET BY FORM, USD, AFRICA, 2017 - 2029
- Figure 71:
- VALUE SHARE OF COLLAGEN MARKET BY FORM, %, AFRICA, 2017 VS 2023 VS 2029
- Figure 72:
- VOLUME SHARE OF COLLAGEN MARKET BY FORM, %, AFRICA, 2017 VS 2023 VS 2029
- Figure 73:
- VOLUME OF COLLAGEN MARKET BY END USER, METRIC TONNES, AFRICA, 2017 - 2029
- Figure 74:
- VALUE OF COLLAGEN MARKET BY END USER, USD, AFRICA, 2017 - 2029
- Figure 75:
- VALUE SHARE OF COLLAGEN MARKET BY END USER, %, AFRICA, 2017 VS 2023 VS 2029
- Figure 76:
- VOLUME SHARE OF COLLAGEN MARKET BY END USER, %, AFRICA, 2017 VS 2023 VS 2029
- Figure 77:
- VOLUME OF COLLAGEN MARKET BY COUNTRY, METRIC TONNES, AFRICA, 2017 - 2029
- Figure 78:
- VALUE OF COLLAGEN MARKET BY COUNTRY, USD, AFRICA, 2017 - 2029
- Figure 79:
- VALUE SHARE OF COLLAGEN MARKET BY COUNTRY, %, AFRICA, 2017 VS 2023 VS 2029
- Figure 80:
- VOLUME SHARE OF COLLAGEN MARKET BY COUNTRY, %, AFRICA, 2017 VS 2023 VS 2029
- Figure 81:
- VOLUME OF COLLAGEN MARKET, METRIC TONNES, NIGERIA, 2017 - 2029
- Figure 82:
- VALUE OF COLLAGEN MARKET, USD, NIGERIA, 2017 - 2029
- Figure 83:
- VALUE SHARE OF COLLAGEN MARKET BY END USER, % , NIGERIA, 2022 VS 2029
- Figure 84:
- VOLUME OF COLLAGEN MARKET, METRIC TONNES, SOUTH AFRICA, 2017 - 2029
- Figure 85:
- VALUE OF COLLAGEN MARKET, USD, SOUTH AFRICA, 2017 - 2029
- Figure 86:
- VALUE SHARE OF COLLAGEN MARKET BY END USER, % , SOUTH AFRICA, 2022 VS 2029
- Figure 87:
- VOLUME OF COLLAGEN MARKET, METRIC TONNES, REST OF AFRICA, 2017 - 2029
- Figure 88:
- VALUE OF COLLAGEN MARKET, USD, REST OF AFRICA, 2017 - 2029
- Figure 89:
- VALUE SHARE OF COLLAGEN MARKET BY END USER, % , REST OF AFRICA, 2022 VS 2029
- Figure 90:
- VOLUME OF COLLAGEN MARKET BY FORM, METRIC TONNES, ASIA-PACIFIC, 2017 - 2029
- Figure 91:
- VALUE OF COLLAGEN MARKET BY FORM, USD, ASIA-PACIFIC, 2017 - 2029
- Figure 92:
- VALUE SHARE OF COLLAGEN MARKET BY FORM, %, ASIA-PACIFIC, 2017 VS 2023 VS 2029
- Figure 93:
- VOLUME SHARE OF COLLAGEN MARKET BY FORM, %, ASIA-PACIFIC, 2017 VS 2023 VS 2029
- Figure 94:
- VOLUME OF COLLAGEN MARKET BY END USER, METRIC TONNES, ASIA-PACIFIC, 2017 - 2029
- Figure 95:
- VALUE OF COLLAGEN MARKET BY END USER, USD, ASIA-PACIFIC, 2017 - 2029
- Figure 96:
- VALUE SHARE OF COLLAGEN MARKET BY END USER, %, ASIA-PACIFIC, 2017 VS 2023 VS 2029
- Figure 97:
- VOLUME SHARE OF COLLAGEN MARKET BY END USER, %, ASIA-PACIFIC, 2017 VS 2023 VS 2029
- Figure 98:
- VOLUME OF COLLAGEN MARKET BY COUNTRY, METRIC TONNES, ASIA-PACIFIC, 2017 - 2029
- Figure 99:
- VALUE OF COLLAGEN MARKET BY COUNTRY, USD, ASIA-PACIFIC, 2017 - 2029
- Figure 100:
- VALUE SHARE OF COLLAGEN MARKET BY COUNTRY, %, ASIA-PACIFIC, 2017 VS 2023 VS 2029
- Figure 101:
- VOLUME SHARE OF COLLAGEN MARKET BY COUNTRY, %, ASIA-PACIFIC, 2017 VS 2023 VS 2029
- Figure 102:
- VOLUME OF COLLAGEN MARKET, METRIC TONNES, AUSTRALIA, 2017 - 2029
- Figure 103:
- VALUE OF COLLAGEN MARKET, USD, AUSTRALIA, 2017 - 2029
- Figure 104:
- VALUE SHARE OF COLLAGEN MARKET BY END USER, % , AUSTRALIA, 2022 VS 2029
- Figure 105:
- VOLUME OF COLLAGEN MARKET, METRIC TONNES, CHINA, 2017 - 2029
- Figure 106:
- VALUE OF COLLAGEN MARKET, USD, CHINA, 2017 - 2029
- Figure 107:
- VALUE SHARE OF COLLAGEN MARKET BY END USER, % , CHINA, 2022 VS 2029
- Figure 108:
- VOLUME OF COLLAGEN MARKET, METRIC TONNES, INDIA, 2017 - 2029
- Figure 109:
- VALUE OF COLLAGEN MARKET, USD, INDIA, 2017 - 2029
- Figure 110:
- VALUE SHARE OF COLLAGEN MARKET BY END USER, % , INDIA, 2022 VS 2029
- Figure 111:
- VOLUME OF COLLAGEN MARKET, METRIC TONNES, INDONESIA, 2017 - 2029
- Figure 112:
- VALUE OF COLLAGEN MARKET, USD, INDONESIA, 2017 - 2029
- Figure 113:
- VALUE SHARE OF COLLAGEN MARKET BY END USER, % , INDONESIA, 2022 VS 2029
- Figure 114:
- VOLUME OF COLLAGEN MARKET, METRIC TONNES, JAPAN, 2017 - 2029
- Figure 115:
- VALUE OF COLLAGEN MARKET, USD, JAPAN, 2017 - 2029
- Figure 116:
- VALUE SHARE OF COLLAGEN MARKET BY END USER, % , JAPAN, 2022 VS 2029
- Figure 117:
- VOLUME OF COLLAGEN MARKET, METRIC TONNES, MALAYSIA, 2017 - 2029
- Figure 118:
- VALUE OF COLLAGEN MARKET, USD, MALAYSIA, 2017 - 2029
- Figure 119:
- VALUE SHARE OF COLLAGEN MARKET BY END USER, % , MALAYSIA, 2022 VS 2029
- Figure 120:
- VOLUME OF COLLAGEN MARKET, METRIC TONNES, NEW ZEALAND, 2017 - 2029
- Figure 121:
- VALUE OF COLLAGEN MARKET, USD, NEW ZEALAND, 2017 - 2029
- Figure 122:
- VALUE SHARE OF COLLAGEN MARKET BY END USER, % , NEW ZEALAND, 2022 VS 2029
- Figure 123:
- VOLUME OF COLLAGEN MARKET, METRIC TONNES, SOUTH KOREA, 2017 - 2029
- Figure 124:
- VALUE OF COLLAGEN MARKET, USD, SOUTH KOREA, 2017 - 2029
- Figure 125:
- VALUE SHARE OF COLLAGEN MARKET BY END USER, % , SOUTH KOREA, 2022 VS 2029
- Figure 126:
- VOLUME OF COLLAGEN MARKET, METRIC TONNES, THAILAND, 2017 - 2029
- Figure 127:
- VALUE OF COLLAGEN MARKET, USD, THAILAND, 2017 - 2029
- Figure 128:
- VALUE SHARE OF COLLAGEN MARKET BY END USER, % , THAILAND, 2022 VS 2029
- Figure 129:
- VOLUME OF COLLAGEN MARKET, METRIC TONNES, VIETNAM, 2017 - 2029
- Figure 130:
- VALUE OF COLLAGEN MARKET, USD, VIETNAM, 2017 - 2029
- Figure 131:
- VALUE SHARE OF COLLAGEN MARKET BY END USER, % , VIETNAM, 2022 VS 2029
- Figure 132:
- VOLUME OF COLLAGEN MARKET, METRIC TONNES, REST OF ASIA-PACIFIC, 2017 - 2029
- Figure 133:
- VALUE OF COLLAGEN MARKET, USD, REST OF ASIA-PACIFIC, 2017 - 2029
- Figure 134:
- VALUE SHARE OF COLLAGEN MARKET BY END USER, % , REST OF ASIA-PACIFIC, 2022 VS 2029
- Figure 135:
- VOLUME OF COLLAGEN MARKET BY FORM, METRIC TONNES, EUROPE, 2017 - 2029
- Figure 136:
- VALUE OF COLLAGEN MARKET BY FORM, USD, EUROPE, 2017 - 2029
- Figure 137:
- VALUE SHARE OF COLLAGEN MARKET BY FORM, %, EUROPE, 2017 VS 2023 VS 2029
- Figure 138:
- VOLUME SHARE OF COLLAGEN MARKET BY FORM, %, EUROPE, 2017 VS 2023 VS 2029
- Figure 139:
- VOLUME OF COLLAGEN MARKET BY END USER, METRIC TONNES, EUROPE, 2017 - 2029
- Figure 140:
- VALUE OF COLLAGEN MARKET BY END USER, USD, EUROPE, 2017 - 2029
- Figure 141:
- VALUE SHARE OF COLLAGEN MARKET BY END USER, %, EUROPE, 2017 VS 2023 VS 2029
- Figure 142:
- VOLUME SHARE OF COLLAGEN MARKET BY END USER, %, EUROPE, 2017 VS 2023 VS 2029
- Figure 143:
- VOLUME OF COLLAGEN MARKET BY COUNTRY, METRIC TONNES, EUROPE, 2017 - 2029
- Figure 144:
- VALUE OF COLLAGEN MARKET BY COUNTRY, USD, EUROPE, 2017 - 2029
- Figure 145:
- VALUE SHARE OF COLLAGEN MARKET BY COUNTRY, %, EUROPE, 2017 VS 2023 VS 2029
- Figure 146:
- VOLUME SHARE OF COLLAGEN MARKET BY COUNTRY, %, EUROPE, 2017 VS 2023 VS 2029
- Figure 147:
- VOLUME OF COLLAGEN MARKET, METRIC TONNES, BELGIUM, 2017 - 2029
- Figure 148:
- VALUE OF COLLAGEN MARKET, USD, BELGIUM, 2017 - 2029
- Figure 149:
- VALUE SHARE OF COLLAGEN MARKET BY END USER, % , BELGIUM, 2022 VS 2029
- Figure 150:
- VOLUME OF COLLAGEN MARKET, METRIC TONNES, FRANCE, 2017 - 2029
- Figure 151:
- VALUE OF COLLAGEN MARKET, USD, FRANCE, 2017 - 2029
- Figure 152:
- VALUE SHARE OF COLLAGEN MARKET BY END USER, % , FRANCE, 2022 VS 2029
- Figure 153:
- VOLUME OF COLLAGEN MARKET, METRIC TONNES, GERMANY, 2017 - 2029
- Figure 154:
- VALUE OF COLLAGEN MARKET, USD, GERMANY, 2017 - 2029
- Figure 155:
- VALUE SHARE OF COLLAGEN MARKET BY END USER, % , GERMANY, 2022 VS 2029
- Figure 156:
- VOLUME OF COLLAGEN MARKET, METRIC TONNES, ITALY, 2017 - 2029
- Figure 157:
- VALUE OF COLLAGEN MARKET, USD, ITALY, 2017 - 2029
- Figure 158:
- VALUE SHARE OF COLLAGEN MARKET BY END USER, % , ITALY, 2022 VS 2029
- Figure 159:
- VOLUME OF COLLAGEN MARKET, METRIC TONNES, NETHERLANDS, 2017 - 2029
- Figure 160:
- VALUE OF COLLAGEN MARKET, USD, NETHERLANDS, 2017 - 2029
- Figure 161:
- VALUE SHARE OF COLLAGEN MARKET BY END USER, % , NETHERLANDS, 2022 VS 2029
- Figure 162:
- VOLUME OF COLLAGEN MARKET, METRIC TONNES, RUSSIA, 2017 - 2029
- Figure 163:
- VALUE OF COLLAGEN MARKET, USD, RUSSIA, 2017 - 2029
- Figure 164:
- VALUE SHARE OF COLLAGEN MARKET BY END USER, % , RUSSIA, 2022 VS 2029
- Figure 165:
- VOLUME OF COLLAGEN MARKET, METRIC TONNES, SPAIN, 2017 - 2029
- Figure 166:
- VALUE OF COLLAGEN MARKET, USD, SPAIN, 2017 - 2029
- Figure 167:
- VALUE SHARE OF COLLAGEN MARKET BY END USER, % , SPAIN, 2022 VS 2029
- Figure 168:
- VOLUME OF COLLAGEN MARKET, METRIC TONNES, TURKEY, 2017 - 2029
- Figure 169:
- VALUE OF COLLAGEN MARKET, USD, TURKEY, 2017 - 2029
- Figure 170:
- VALUE SHARE OF COLLAGEN MARKET BY END USER, % , TURKEY, 2022 VS 2029
- Figure 171:
- VOLUME OF COLLAGEN MARKET, METRIC TONNES, UNITED KINGDOM, 2017 - 2029
- Figure 172:
- VALUE OF COLLAGEN MARKET, USD, UNITED KINGDOM, 2017 - 2029
- Figure 173:
- VALUE SHARE OF COLLAGEN MARKET BY END USER, % , UNITED KINGDOM, 2022 VS 2029
- Figure 174:
- VOLUME OF COLLAGEN MARKET, METRIC TONNES, REST OF EUROPE, 2017 - 2029
- Figure 175:
- VALUE OF COLLAGEN MARKET, USD, REST OF EUROPE, 2017 - 2029
- Figure 176:
- VALUE SHARE OF COLLAGEN MARKET BY END USER, % , REST OF EUROPE, 2022 VS 2029
- Figure 177:
- VOLUME OF COLLAGEN MARKET BY FORM, METRIC TONNES, MIDDLE EAST, 2017 - 2029
- Figure 178:
- VALUE OF COLLAGEN MARKET BY FORM, USD, MIDDLE EAST, 2017 - 2029
- Figure 179:
- VALUE SHARE OF COLLAGEN MARKET BY FORM, %, MIDDLE EAST, 2017 VS 2023 VS 2029
- Figure 180:
- VOLUME SHARE OF COLLAGEN MARKET BY FORM, %, MIDDLE EAST, 2017 VS 2023 VS 2029
- Figure 181:
- VOLUME OF COLLAGEN MARKET BY END USER, METRIC TONNES, MIDDLE EAST, 2017 - 2029
- Figure 182:
- VALUE OF COLLAGEN MARKET BY END USER, USD, MIDDLE EAST, 2017 - 2029
- Figure 183:
- VALUE SHARE OF COLLAGEN MARKET BY END USER, %, MIDDLE EAST, 2017 VS 2023 VS 2029
- Figure 184:
- VOLUME SHARE OF COLLAGEN MARKET BY END USER, %, MIDDLE EAST, 2017 VS 2023 VS 2029
- Figure 185:
- VOLUME OF COLLAGEN MARKET BY COUNTRY, METRIC TONNES, MIDDLE EAST, 2017 - 2029
- Figure 186:
- VALUE OF COLLAGEN MARKET BY COUNTRY, USD, MIDDLE EAST, 2017 - 2029
- Figure 187:
- VALUE SHARE OF COLLAGEN MARKET BY COUNTRY, %, MIDDLE EAST, 2017 VS 2023 VS 2029
- Figure 188:
- VOLUME SHARE OF COLLAGEN MARKET BY COUNTRY, %, MIDDLE EAST, 2017 VS 2023 VS 2029
- Figure 189:
- VOLUME OF COLLAGEN MARKET, METRIC TONNES, IRAN, 2017 - 2029
- Figure 190:
- VALUE OF COLLAGEN MARKET, USD, IRAN, 2017 - 2029
- Figure 191:
- VALUE SHARE OF COLLAGEN MARKET BY END USER, % , IRAN, 2022 VS 2029
- Figure 192:
- VOLUME OF COLLAGEN MARKET, METRIC TONNES, SAUDI ARABIA, 2017 - 2029
- Figure 193:
- VALUE OF COLLAGEN MARKET, USD, SAUDI ARABIA, 2017 - 2029
- Figure 194:
- VALUE SHARE OF COLLAGEN MARKET BY END USER, % , SAUDI ARABIA, 2022 VS 2029
- Figure 195:
- VOLUME OF COLLAGEN MARKET, METRIC TONNES, UNITED ARAB EMIRATES, 2017 - 2029
- Figure 196:
- VALUE OF COLLAGEN MARKET, USD, UNITED ARAB EMIRATES, 2017 - 2029
- Figure 197:
- VALUE SHARE OF COLLAGEN MARKET BY END USER, % , UNITED ARAB EMIRATES, 2022 VS 2029
- Figure 198:
- VOLUME OF COLLAGEN MARKET, METRIC TONNES, REST OF MIDDLE EAST, 2017 - 2029
- Figure 199:
- VALUE OF COLLAGEN MARKET, USD, REST OF MIDDLE EAST, 2017 - 2029
- Figure 200:
- VALUE SHARE OF COLLAGEN MARKET BY END USER, % , REST OF MIDDLE EAST, 2022 VS 2029
- Figure 201:
- VOLUME OF COLLAGEN MARKET BY FORM, METRIC TONNES, NORTH AMERICA, 2017 - 2029
- Figure 202:
- VALUE OF COLLAGEN MARKET BY FORM, USD, NORTH AMERICA, 2017 - 2029
- Figure 203:
- VALUE SHARE OF COLLAGEN MARKET BY FORM, %, NORTH AMERICA, 2017 VS 2023 VS 2029
- Figure 204:
- VOLUME SHARE OF COLLAGEN MARKET BY FORM, %, NORTH AMERICA, 2017 VS 2023 VS 2029
- Figure 205:
- VOLUME OF COLLAGEN MARKET BY END USER, METRIC TONNES, NORTH AMERICA, 2017 - 2029
- Figure 206:
- VALUE OF COLLAGEN MARKET BY END USER, USD, NORTH AMERICA, 2017 - 2029
- Figure 207:
- VALUE SHARE OF COLLAGEN MARKET BY END USER, %, NORTH AMERICA, 2017 VS 2023 VS 2029
- Figure 208:
- VOLUME SHARE OF COLLAGEN MARKET BY END USER, %, NORTH AMERICA, 2017 VS 2023 VS 2029
- Figure 209:
- VOLUME OF COLLAGEN MARKET BY COUNTRY, METRIC TONNES, NORTH AMERICA, 2017 - 2029
- Figure 210:
- VALUE OF COLLAGEN MARKET BY COUNTRY, USD, NORTH AMERICA, 2017 - 2029
- Figure 211:
- VALUE SHARE OF COLLAGEN MARKET BY COUNTRY, %, NORTH AMERICA, 2017 VS 2023 VS 2029
- Figure 212:
- VOLUME SHARE OF COLLAGEN MARKET BY COUNTRY, %, NORTH AMERICA, 2017 VS 2023 VS 2029
- Figure 213:
- VOLUME OF COLLAGEN MARKET, METRIC TONNES, CANADA, 2017 - 2029
- Figure 214:
- VALUE OF COLLAGEN MARKET, USD, CANADA, 2017 - 2029
- Figure 215:
- VALUE SHARE OF COLLAGEN MARKET BY END USER, % , CANADA, 2022 VS 2029
- Figure 216:
- VOLUME OF COLLAGEN MARKET, METRIC TONNES, MEXICO, 2017 - 2029
- Figure 217:
- VALUE OF COLLAGEN MARKET, USD, MEXICO, 2017 - 2029
- Figure 218:
- VALUE SHARE OF COLLAGEN MARKET BY END USER, % , MEXICO, 2022 VS 2029
- Figure 219:
- VOLUME OF COLLAGEN MARKET, METRIC TONNES, UNITED STATES, 2017 - 2029
- Figure 220:
- VALUE OF COLLAGEN MARKET, USD, UNITED STATES, 2017 - 2029
- Figure 221:
- VALUE SHARE OF COLLAGEN MARKET BY END USER, % , UNITED STATES, 2022 VS 2029
- Figure 222:
- VOLUME OF COLLAGEN MARKET, METRIC TONNES, REST OF NORTH AMERICA, 2017 - 2029
- Figure 223:
- VALUE OF COLLAGEN MARKET, USD, REST OF NORTH AMERICA, 2017 - 2029
- Figure 224:
- VALUE SHARE OF COLLAGEN MARKET BY END USER, % , REST OF NORTH AMERICA, 2022 VS 2029
- Figure 225:
- VOLUME OF COLLAGEN MARKET BY FORM, METRIC TONNES, SOUTH AMERICA, 2017 - 2029
- Figure 226:
- VALUE OF COLLAGEN MARKET BY FORM, USD, SOUTH AMERICA, 2017 - 2029
- Figure 227:
- VALUE SHARE OF COLLAGEN MARKET BY FORM, %, SOUTH AMERICA, 2017 VS 2023 VS 2029
- Figure 228:
- VOLUME SHARE OF COLLAGEN MARKET BY FORM, %, SOUTH AMERICA, 2017 VS 2023 VS 2029
- Figure 229:
- VOLUME OF COLLAGEN MARKET BY END USER, METRIC TONNES, SOUTH AMERICA, 2017 - 2029
- Figure 230:
- VALUE OF COLLAGEN MARKET BY END USER, USD, SOUTH AMERICA, 2017 - 2029
- Figure 231:
- VALUE SHARE OF COLLAGEN MARKET BY END USER, %, SOUTH AMERICA, 2017 VS 2023 VS 2029
- Figure 232:
- VOLUME SHARE OF COLLAGEN MARKET BY END USER, %, SOUTH AMERICA, 2017 VS 2023 VS 2029
- Figure 233:
- VOLUME OF COLLAGEN MARKET BY COUNTRY, METRIC TONNES, SOUTH AMERICA, 2017 - 2029
- Figure 234:
- VALUE OF COLLAGEN MARKET BY COUNTRY, USD, SOUTH AMERICA, 2017 - 2029
- Figure 235:
- VALUE SHARE OF COLLAGEN MARKET BY COUNTRY, %, SOUTH AMERICA, 2017 VS 2023 VS 2029
- Figure 236:
- VOLUME SHARE OF COLLAGEN MARKET BY COUNTRY, %, SOUTH AMERICA, 2017 VS 2023 VS 2029
- Figure 237:
- VOLUME OF COLLAGEN MARKET, METRIC TONNES, ARGENTINA, 2017 - 2029
- Figure 238:
- VALUE OF COLLAGEN MARKET, USD, ARGENTINA, 2017 - 2029
- Figure 239:
- VALUE SHARE OF COLLAGEN MARKET BY END USER, % , ARGENTINA, 2022 VS 2029
- Figure 240:
- VOLUME OF COLLAGEN MARKET, METRIC TONNES, BRAZIL, 2017 - 2029
- Figure 241:
- VALUE OF COLLAGEN MARKET, USD, BRAZIL, 2017 - 2029
- Figure 242:
- VALUE SHARE OF COLLAGEN MARKET BY END USER, % , BRAZIL, 2022 VS 2029
- Figure 243:
- VOLUME OF COLLAGEN MARKET, METRIC TONNES, REST OF SOUTH AMERICA, 2017 - 2029
- Figure 244:
- VALUE OF COLLAGEN MARKET, USD, REST OF SOUTH AMERICA, 2017 - 2029
- Figure 245:
- VALUE SHARE OF COLLAGEN MARKET BY END USER, % , REST OF SOUTH AMERICA, 2022 VS 2029
- Figure 246:
- MOST ACTIVE COMPANIES BY NUMBER OF STRATEGIC MOVES, COUNT, GLOBAL COLLAGEN MARKET, 2017 - 2022
- Figure 247:
- MOST ADOPTED STRATEGIES, COUNT, GLOBAL, 2017 - 2022
- Figure 248:
- VALUE SHARE OF MAJOR PLAYERS, %, GLOBAL COLLAGEN MARKET
Collagen Industry Segmentation
Animal Based, Marine Based are covered as segments by Form. Animal Feed, Food and Beverages, Personal Care and Cosmetics, Supplements are covered as segments by End User. Africa, Asia-Pacific, Europe, Middle East, North America, South America are covered as segments by Region.| Form | Animal Based | |||
| Marine Based | ||||
| End User | Animal Feed | |||
| Food and Beverages | By Sub End User | Bakery | ||
| Beverages | ||||
| Breakfast Cereals | ||||
| Snacks | ||||
| Personal Care and Cosmetics | ||||
| Supplements | By Sub End User | Elderly Nutrition and Medical Nutrition | ||
| Sport/Performance Nutrition | ||||
| Region | Africa | By Form | ||
| By End User | ||||
| By Country | Nigeria | |||
| South Africa | ||||
| Rest of Africa | ||||
| Asia-Pacific | By Form | |||
| By End User | ||||
| Australia | ||||
| China | ||||
| India | ||||
| Indonesia | ||||
| Japan | ||||
| Malaysia | ||||
| New Zealand | ||||
| South Korea | ||||
| Thailand | ||||
| Vietnam | ||||
| Rest of Asia-Pacific | ||||
| Europe | By Form | |||
| By End User | ||||
| Belgium | ||||
| France | ||||
| Germany | ||||
| Italy | ||||
| Netherlands | ||||
| Russia | ||||
| Spain | ||||
| Turkey | ||||
| United Kingdom | ||||
| Rest of Europe | ||||
| Middle East | By Form | |||
| By End User | ||||
| Iran | ||||
| Saudi Arabia | ||||
| United Arab Emirates | ||||
| Rest of Middle East | ||||
| North America | By Form | |||
| By End User | ||||
| Canada | ||||
| Mexico | ||||
| United States | ||||
| Rest of North America | ||||
| South America | By Form | |||
| By End User | ||||
| Argentina | ||||
| Brazil | ||||
| Rest of South America | ||||
Need A Different Region or Segment?
Customize Now
Market Definition
- End User - The Protein Ingredients Market operates on a B2B basis. Food, Beverages, Supplements, Animal Feed, and Personal Care & Cosmetic manufacturers are considered to be end-consumers in the market studied. The scope excludes manufacturers buying liquid/dry whey to be used for application as a binding agent or thickener or other non-protein applications.
- Penetration Rate - Penetration Rate is defined as the percentage of Protein-Fortified End User Market Volume in the Overall End User Market Volume.
- Average Protein Content - Average protein content is the average protein content present per 100 g of product manufactured by all end-user companies considered under the scope of this report.
- End User Market Volume - End-user market volume is the consolidated volume of all types and forms of end-user products in the country or region.
| Keyword | Definition |
|---|---|
| Alpha-lactalbumin (α-Lactalbumin) | It is a protein that regulates the production of lactose in the milk of almost all mammalian species. |
| Amino acid | It is an organic compound that contains both amino and carboxylic acid functional groups, which are required for the synthesis of body protein and other important nitrogen-containing compounds, such as creatine, peptide hormones, and some neurotransmitters. |
| Blanching | It is the process of briefly heating vegetables with steam or boiling water. |
| BRC | British Retail Consortium |
| Bread improver | It is a flour-based blend of several components with specific functional properties designed to modify dough characteristics and give quality attributes to bread. |
| BSF | Black Soldier Fly |
| Caseinate | It is a substance produced by adding an alkali to acid casein, a derivative of casein. |
| Celiac disease | Celiac disease is an immune reaction to eating gluten, a protein found in wheat, barley, and rye. |
| Colostrum | It is a milky fluid that’s released by mammals that have recently given birth before breast milk production begins. |
| Concentrate | It is the least processed form of protein and has a protein content ranging from 40-90% by weight. |
| Dry protein basis | It refers to the percentage of "pure protein" present in a supplement after the water in it is completely removed through heat. |
| Dry whey | It is the product resulting from drying fresh whey which has been pasteurized and to which nothing has been added as a preservative. |
| Egg protein | It is a mixture of individual proteins, including ovalbumin, ovomucoid, ovoglobulin, conalbumin, vitellin, and vitellenin. |
| Emulsifier | It is a food additive that facilitates the blending of foods that are immiscible with one another, such as oil and water. |
| Enrichment | It is the process of addition of micronutrients that are lost during the processing of the product. |
| ERS | Economic Research Service of the USDA |
| Extrusion | It is the process of forcing soft mixed ingredients through an opening in a perforated plate or die designed to produce the required shape. The extruded food is then cut to a specific size by blades. |
| Fava | Also known as Faba, it is another word for yellow split beans. |
| FDA | Food and Drug Administration |
| Flaking | It is a process in which typically a cereal grain (like corn, wheat, or rice) is broken down into grits, cooked with flavors and syrups, and then pressed into flakes between cooled rollers. |
| Foaming agent | It is a food ingredient that makes it possible to form or maintain a uniform dispersion of a gaseous phase in a liquid or solid food. |
| Foodservice | It refers to the part of the food industry which includes businesses, institutions, and companies which prepare meals outside the home. It includes restaurants, school and hospital cafeterias, catering operations, and many other formats. |
| Fortification | It is the deliberate addition of micronutrients that are not found in them naturally or which are lost during processing, to improve a food product's nutritional value. |
| FSANZ | Food Standards Australia New Zealand |
| FSIS | Food Safety and Inspection Service |
| FSSAI | Food Safety and Standards Authority of India |
| Gelling agent | It is an ingredient that functions as a stabilizer and thickener to provide thickening without stiffness through the formation of gel. |
| GHG | Greenhouse Gas |
| Gluten | It is a family of proteins found in grains, including wheat, rye, spelt, and barley. |
| Hemp | It is a botanical class of Cannabis sativa cultivars grown specifically for industrial or medicinal use. |
| Hydrolysate | It is a form of protein manufactured by exposing the protein to enzymes that can partially break the bonds between the protein's amino acids and break down large, complicated proteins into smaller pieces. Its processing makes it easier and quicker to digest. |
| Hypoallergenic | It refers to a substance that causes fewer allergic reactions. |
| Isolate | It is the purest and most processed form of protein which has undergone separation to obtain a pure protein fraction. It typically contains ≥ 90% of protein by weight. |
| Keratin | It is a protein that helps form hair, nails, and the outer layer of skin. |
| Lactalbumin | It is the albumin contained in milk and obtained from whey. |
| Lactoferrin | It is an iron‑binding glycoprotein that is present in the milk of most mammals. |
| Lupin | It is the yellow legume seeds of the genus Lupinus. |
| Millenial | Also known as Generation Y or Gen Y, it refers to the people born from 1981 to 1996. |
| Monogastric | It refers to an animal with a single-compartmented stomach. Examples of monogastric include humans, poultry, pigs, horses, rabbits, dogs, and cats. Most monogastric are generally unable to digest much cellulose food materials such as grasses. |
| MPC | Milk protein concentrate |
| MPI | Milk protein isolate |
| MSPI | Methylated soy protein isolate |
| Mycoprotein | Mycoprotein is a form of single-cell protein, also known as fungal protein, derived from fungi for human consumption. |
| Nutricosmetics | It is a category of products and ingredients that act as nutritional supplements to care for skin, nails, and hair natural beauty. |
| Osteoporosis | It is a medical condition in which the bones become brittle and fragile from loss of tissue, typically as a result of hormonal changes, or deficiency of calcium or vitamin D. |
| PDCAAS | Protein digestibility-corrected amino acid score (PDCAAS) is a method of evaluating the quality of a protein based on both the amino acid requirements of humans and their ability to digest it. |
| Per-capita consumption of animal protein | It is the average amount of animal protein (such as milk, whey, gelatin, collagen, and egg proteins) that is readily available for consumption by each person in an actual population. |
| Per-capita consumption of plant protein | It is the average amount of plant protein (such as soy, wheat, pea, oat, and hemp proteins) that is readily available for consumption by each person in an actual population. |
| Quorn | It is a microbial protein manufactured using mycoprotein as an ingredient, in which the fungus culture is dried and mixed with egg albumen or potato protein, which acts as a binder, and then is adjusted in texture and pressed into various forms. |
| Ready-to-Cook (RTC) | It refers to food products that include all of the ingredients, where some preparation or cooking is required through a process that is given on the package. |
| Ready-to-Eat (RTE) | It refers to a food product prepared or cooked in advance, with no further cooking or preparation required before being eaten. |
| RTD | Ready-to-Drink |
| RTS | Ready-to-Serve |
| Saturated fat | It is a type of fat in which the fatty acid chains have all single bonds. It is generally considered unhealthy. |
| Sausage | It is a meat product made of finely chopped and seasoned meat, which may be fresh, smoked, or pickled and which is then usually stuffed into a casing. |
| Seitan | It is a plant-based meat substitute made out of wheat gluten. |
| Softgel | It is a gelatin-based capsule with a liquid fill. |
| SPC | Soy protein concentrate |
| SPI | Soy protein isolate |
| Spirulina | It is a biomass of cyanobacteria that can be consumed by humans and animals. |
| Stabilizer | It is an ingredient added to food products to help maintain or enhance their original texture, and physical and chemical characteristics. |
| Supplementation | It is the consumption or provision of concentrated sources of nutrients or other substances that are intended to supplement nutrients in the diet and is intended to correct nutritional deficiencies. |
| Texturant | It is a specific type of food ingredient that is used to control and alter the mouthfeel and texture of food and beverage products. |
| Thickener | It is an ingredient that is used to increase the viscosity of a liquid or dough and make it thicker, without substantially changing its other properties. |
| Trans fat | Also called trans-unsaturated fatty acids or trans fatty acids, it is a type of unsaturated fat that naturally occurs in small amounts in meat. |
| TSP | Textured soy protein |
| TVP | Textured vegetable protein |
| WPC | Whey protein concentrate |
| WPI | Whey protein isolate |
Need More Details on Market Definition?
Ask a Question
Research Methodology
Mordor Intelligence follows a four-step methodology in all our reports.
- Step-1: Identify Key Variables: The quantifiable key variables (industry and extraneous) pertaining to the specific product segment and country are selected from a group of relevant variables & factors based on desk research & literature review; along with primary expert inputs. These variables are further confirmed through regression modeling (wherever required).
- Step-2: Build a Market Model: In order to build a robust forecasting methodology, the variables and factors identified in Step-1 are tested against available historical market numbers. Through an iterative process, the variables required for market forecast are set and the model is built on the basis of these variables.
- Step-3: Validate and Finalize: In this important step, all market numbers, variables and analyst calls are validated through an extensive network of primary research experts from the market studied. The respondents are selected across levels and functions to generate a holistic picture of the market studied.
- Step-4: Research Outputs: Syndicated Reports, Custom Consulting Assignments, Databases & Subscription Platforms

Get More Details On Research Methodology
Download PDF


