
City Surveillance Market Size and Share
Market Overview
| Study Period | 2020 - 2031 |
|---|---|
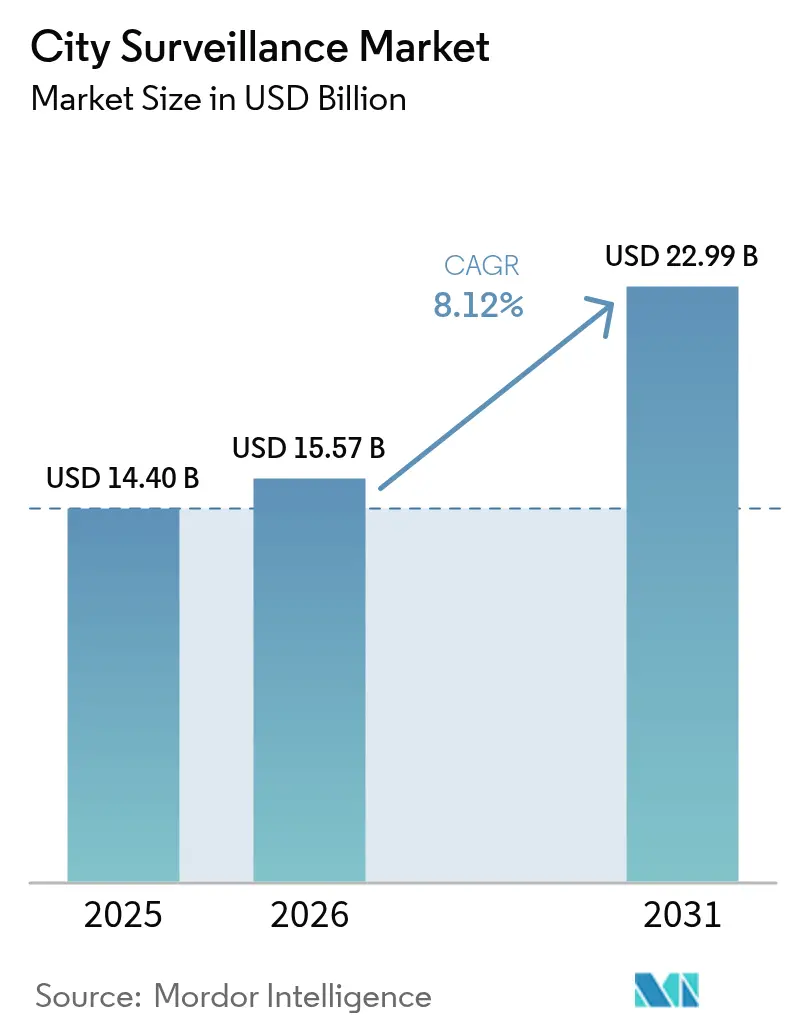
| Market Size (2026) | USD 15.57 Billion |
| Market Size (2031) | USD 22.99 Billion |
| Growth Rate (2026 - 2031) | 8.12% CAGR |
| Fastest Growing Market | Middle East |
| Largest Market | Asia Pacific |
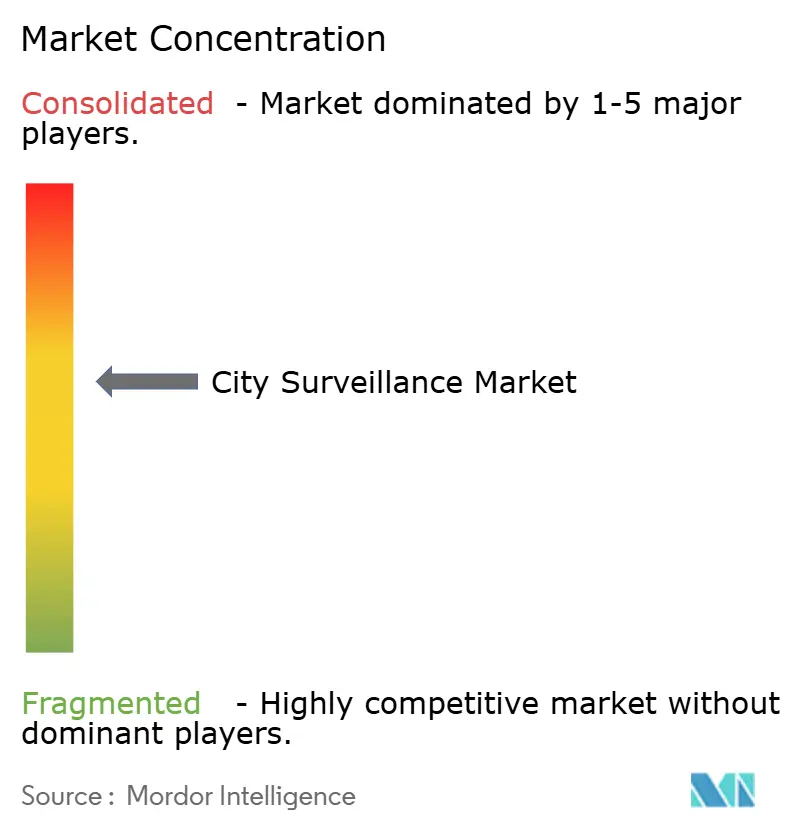
| Market Concentration | Medium |
Major Players *Disclaimer: Major Players sorted in no particular order Image © Mordor Intelligence. Reuse requires attribution under CC BY 4.0. | |
City Surveillance Market Analysis by Mordor Intelligence
city surveillance market size in 2026 is estimated at USD 15.57 billion, growing from 2025 value of USD 14.40 billion with 2031 projections showing USD 22.99 billion, growing at 8.12% CAGR over 2026-2031. Rising allocations for integrated video networks, the sharp decline in IP camera prices, and the rapid maturation of edge analytics form the core growth engines that shape the current competitive dynamic of the city surveillance market. Mid-sized municipalities now justify capital outlays through measurable reductions in crime, lower incident response times, and new revenue streams from traffic violation enforcement. Vendors differentiate less on hardware specifications and more on cybersecurity, privacy compliance, and AI-led software ecosystems that convert video feeds into actionable insights. Partnerships between camera makers and cloud hyperscalers continue to expand the scope of solutions, while 5G adoption accelerates wireless deployments in dense, retrofit-intensive city cores.
Key Report Takeaways
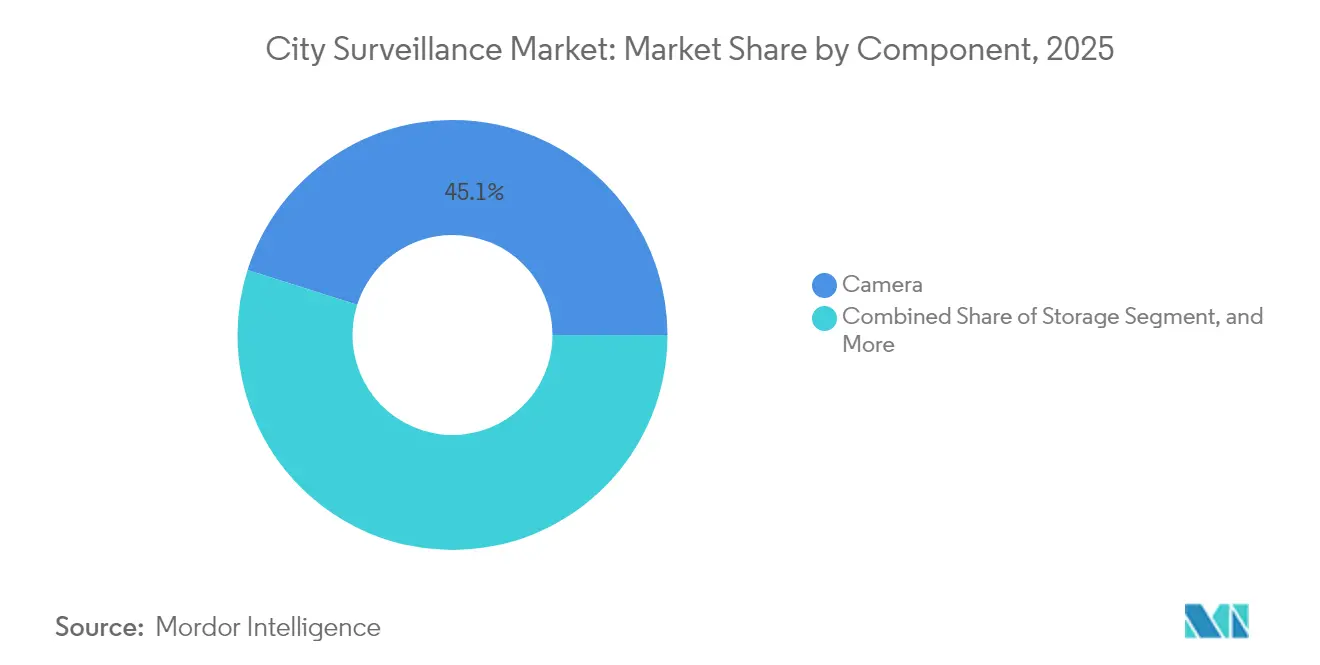
- By component, camera systems held a 45.12% share of the city surveillance market in 2025, while video analytics is forecast to advance at a 9.02% CAGR to 2031.
- By deployment mode, on-premise installations accounted for 61.74% of the city surveillance market size in 2025; cloud solutions are projected to record the highest CAGR of 9.29% through 2031.
- By camera connectivity, wired networks captured 66.10% of the city surveillance market share in 2025, whereas wireless nodes are projected to expand at a 9.74% CAGR between 2026-2031.
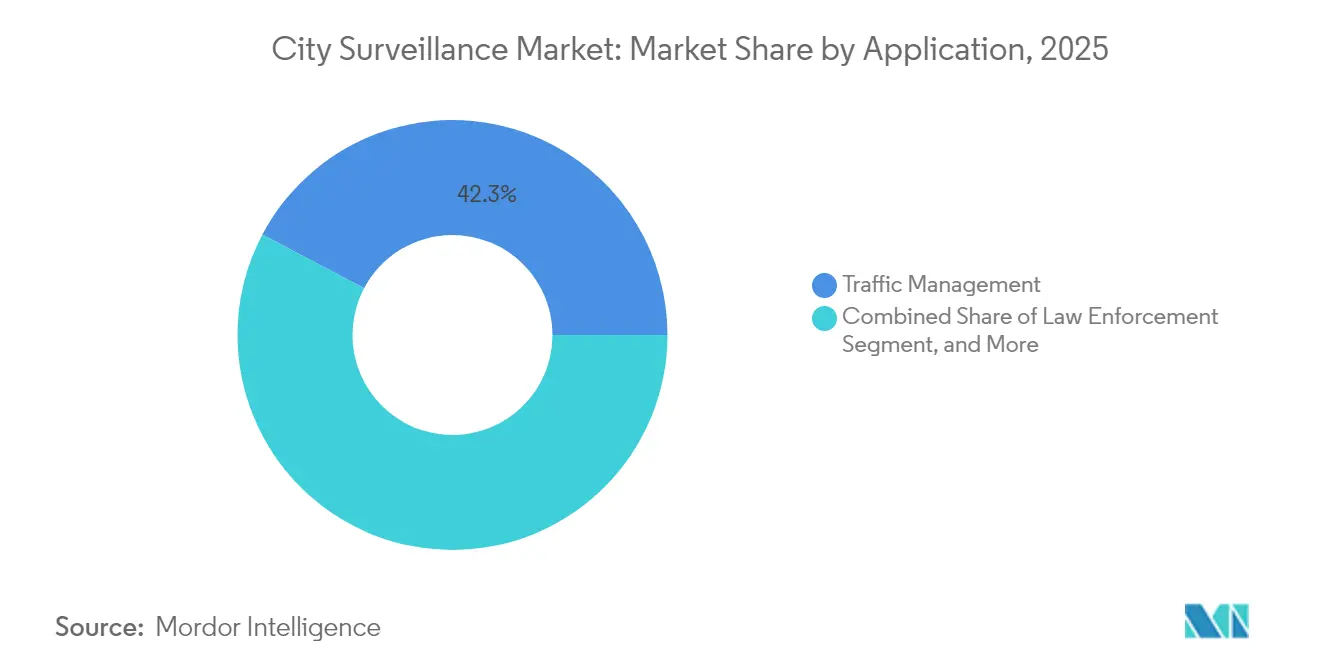
- By application, traffic management led with a 42.26% revenue share in 2025; public transportation hubs are poised for the fastest growth, with a 8.83% CAGR through 2031.
- By end user, municipal authorities commanded 38.21% of spending in 2025, while transportation agencies are projected to grow at a 8.96% CAGR to 2031.
- By geography, Asia-Pacific contributed 35.05% of market revenue in 2025; the Middle East and Africa region is projected to register a 8.92% CAGR through 2031.
Note: Market size and forecast figures in this report are generated using Mordor Intelligence’s proprietary estimation framework, updated with the latest available data and insights as of 2026.
Global City Surveillance Market Trends and Insights
Drivers Impact Analysis*
| Driver | (~) % Impact on CAGR Forecast | Geographic Relevance | Impact Timeline |
|---|---|---|---|
| Increased Spending on Urban Security Infrastructure | +2.1% | Global, with concentration in North America and Europe | Medium term (2-4 years) |
| Declining IP Camera Prices and Enhanced Video Analytics | +1.8% | Global, particularly Asia-Pacific manufacturing hubs | Short term (≤ 2 years) |
| Growing Terrorism and Crime Concerns in Mega-Cities | +1.5% | Global urban centers, especially high-density metropolitan areas | Long term (≥ 4 years) |
| Expansion of Smart City Budgets for Integrated Surveillance | +1.4% | Asia-Pacific, Middle East, with selective North American cities | Medium term (2-4 years) |
| Edge AI Chips Cutting Bandwidth Costs | +1.0% | Global, with early adoption in developed markets | Short term (≤ 2 years) |
| Smart Lighting Poles Embedding Camera Modules | +0.7% | Europe, North America, select Asia-Pacific cities | Long term (≥ 4 years) |
| Source: Mordor Intelligence | |||
Increased Spending on Urban Security Infrastructure
Escalating crime and higher terrorism threat assessments prompted cities to earmark USD 3.2 billion for camera-network upgrades during 2024, with Detroit’s Project Green Light alone channeling USD 7 million toward integrated video feeds that link public and privately owned sites.[1]City of Detroit, “Project Green Light Expansion Program,” detroitmi.gov Similar budget expansions are visible in Barcelona, where EUR 50 million (USD 54.5 million) funded a camera grid that merges security, traffic flow, and environmental monitoring functions. Federal and regional grant programs, including the U.S. Community Oriented Policing Services, continue to de-risk large-scale procurements for municipalities that lack discretionary capital. The resulting demand pipeline favors platform vendors that supply end-to-end solutions and provide documented return-on-safety metrics, thereby reinforcing the growth trajectory of the city surveillance market.
Declining IP-Camera Prices and Enhanced Video Analytics
A component cost erosion of 15-20% per year has shifted procurement criteria from image resolution to embedded intelligence, enabling budget-constrained cities to deploy 4K cameras with on-device analytics. San Francisco achieved a 40% total cost of ownership reduction after migrating to edge-enabled units that automatically classify events and reduce storage requirements.[2]San Francisco Police Department, “Video Analytics Cost Reduction Report,” sanfranciscopolice.org As AI inference now executes on camera chipsets, municipalities capture real-time insights while trimming bandwidth loads by up to 90%. The affordability-intelligence nexus is expected to keep the city surveillance market on a robust expansion path through 2030.
Growing Terrorism and Crime Concerns in Mega-Cities
Global property and violent crime climbed 12% in 2024, with incidents heavily concentrated in metros housing over 1 million residents.[3]U.S. Department of Homeland Security, “Urban Security Threat Assessment 2024,” dhs.gov São Paulo’s 20,000-camera predictive-policing platform cut offenses in monitored districts by 18%, illustrating tangible benefits that justify expansion. Such data-backed successes persuade other mega-cities to allocate larger surveillance budgets, amplifying unit shipments and strengthening recurring-service revenue within the city surveillance market.
Expansion of Smart-City Budgets for Integrated Surveillance
Smart-city outlays totaled USD 189 billion in 2024, with surveillance systems receiving 8-12% of the pool as cities recognize video data as a foundation for multiple municipal services. Seoul’s USD 2.8 billion Digital New Deal anchors cameras as multipurpose sensors for public safety, traffic optimization, and disaster management. This multi-utility approach widens the buyer base and accelerates platform upgrades, reinforcing the long-term demand outlook across the city surveillance market.
Restraints Impact Analysis*
| Restraint | (~) % Impact on CAGR Forecast | Geographic Relevance | Impact Timeline |
|---|---|---|---|
| Heightened Privacy Regulations and Public Opposition | -1.2% | Europe, North America, with emerging concerns in Asia-Pacific | Long term (≥ 4 years) |
| Rising Cybersecurity Vulnerabilities in IoT Cameras | -0.8% | Global, with acute impact in connected infrastructure deployments | Medium term (2-4 years) |
| Shortage of Skilled Video Analytics Personnel | -0.6% | Global, particularly acute in developing markets | Medium term (2-4 years) |
| Interoperability Gaps with Legacy Public Safety Systems | -0.4% | North America, Europe, mature markets with existing infrastructure | Short term (≤ 2 years) |
| Source: Mordor Intelligence | |||
Heightened Privacy Regulations and Public Opposition
The European Union’s AI Act restricts real-time biometric identification, driving compliance costs that can add 20% to project budgets. GDPR enforcement actions against municipalities increased threefold in 2024, with an average fine of EUR 2.8 million (USD 3.05 million) for mishandling surveillance data. Citizen activism has delayed or canceled camera deployments in 15 major European cities, forcing local governments to apply privacy-by-design principles that lengthen roll-out timelines and limit feature sets, thereby tempering the growth of the city surveillance market.
Rising Cybersecurity Vulnerabilities in IoT Cameras
Reported firmware flaws affecting 2.3 million IP cameras in 2024 prompted Austin and Portland to pause expansion plans after data breaches exposed policing footage. The new European Cyber Resilience Act mandates now require security-by-design certification, which extends development cycles and raises vendor qualification hurdles. Municipal buyers are increasingly stipulating end-to-end encryption, regular vulnerability audits, and vendor-borne liability, all of which introduce procurement friction that can slow the adoption of city surveillance markets.
*Our forecasts treat driver/restraint impacts as directional, not additive. The impact forecasts reflect baseline growth, mix effects, and variable interactions.
Segment Analysis
By Component: Analytics Drive Intelligence Revolution
Camera hardware accounted for 45.12% of city surveillance market revenue in 2025, affirming its status as the indispensable capture layer. Video analytics platforms, however, are projected to deliver a 9.02% CAGR, the fastest among components, as municipalities shift from passive recording to real-time intelligence. The city surveillance market size for video analytics is set to expand rapidly because on-device inference reduces bandwidth and storage costs while enhancing situational awareness.
Storage arrays face share erosion as edge analytics retains only critical metadata, curbing long-term archiving volumes. Software vendors differentiate through GDPR-compliant anonymization, automated redaction, and open APIs that integrate with traffic and environmental sensors. These attributes position analytics firms to command premium pricing and shape procurement criteria, reinforcing their emerging dominance within the city surveillance market.


By Deployment Mode: Cloud Adoption Accelerates
On-premise solutions controlled 61.74% of the city surveillance market share in 2025, reflecting legacy investments and a perception of greater data custody. Cloud deployments, however, are forecast to post a 9.29% CAGR, buoyed by elastic storage, automatic software updates, and lower lifecycle costs. Hybrid models bridge real-time local processing with cloud analytics, enabling large cities like Phoenix to store high-resolution footage for extended periods without expanding on-site hardware.
Regulatory stringency is paradoxically accelerating migration, as certified cloud providers offer encryption, audit trails, and compliance documentation that surpass most municipal IT budgets. As these concerns ease, the city surveillance market gains a fresh layer of recurring, software-as-a-service revenue, further diversifying vendor income streams.
By Camera Connectivity: Wireless Gains Momentum
Wired links dominated the market, accounting for 66.10% of revenue in 2025, particularly in greenfield infrastructure, where fiber is laid concurrently with other utilities. Wireless nodes, supported by 5G and low-power solar options, are projected to expand at a 9.74% CAGR, thanks to quick roll-outs in heritage districts where trenching is cost-prohibitive. The city surveillance market size for wireless cameras now expands not merely on convenience but also on resilience, as mesh topologies reroute data when individual nodes fail.
Municipalities deploy wireless units for temporary event security and rapid-response crime-hotspot coverage. Battery-assisted solar panels enhance operational autonomy, while remote firmware updates ensure cyber defenses remain current. These advantages ensure wireless connectivity will capture incremental share, particularly in the Middle East and Africa, where greenfield smart-city projects favor flexible infrastructure.
By Application: Transportation Security Leads Growth
Traffic-management solutions accounted for 42.26% of revenue in 2025, underpinning automated violation enforcement and congestion analytics that help cities recoup their camera investments through fines. Public transportation hubs are expected to rise at the fastest rate, with a 8.83% CAGR, as mass transit operators integrate passenger flow monitoring with threat detection. The city surveillance market size allocated to transit security continues to expand further with multimodal hubs seeking unified views across rail, bus, and metro assets.
Law enforcement applications increasingly harness AI to shift from reactive forensics to predictive patrolling, while critical infrastructure surveillance adds redundant cybersecurity overlays to protect energy and water assets. These developments illustrate how application diversity underpins the city surveillance market’s resilience across budget cycles.
By End User: Municipal Authorities Lead Investment
Municipal authorities represented 38.21% of spending in 2025 and will remain the anchor customer set through 2031. Transportation agencies, projected to grow at a 8.96% CAGR, recognize the operational gains from converging surveillance with fare-collection and asset-management data. The city surveillance market share for utilities also rises as power and water companies confront new physical-security mandates for grid resilience.
Police departments now partner with traffic and emergency services on unified video platforms, creating joint procurement pools that command volume discounts. Educational and healthcare institutions are increasingly connecting to municipal video networks, signaling a long-term trend toward regional surveillance grids that pool assets and analytics budgets.
Geography Analysis
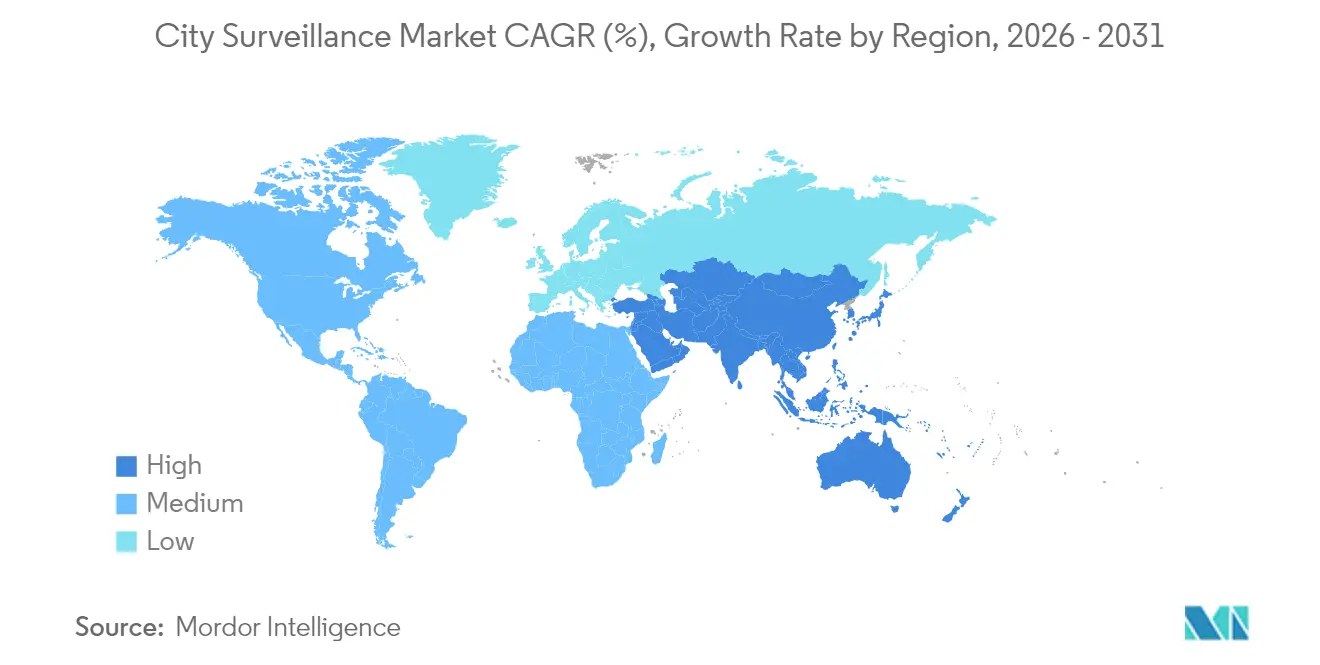
The Asia-Pacific region dominated with 35.05% of 2025 revenue and is forecasted to grow at an 8.46% CAGR through 2031. China’s high-density urban surveillance programs and India’s USD 15 billion Smart Cities Mission anchor the region’s demand pipeline. Singapore’s Smart Nation initiative already interconnects 200,000 cameras with citywide analytics to manage traffic, crowd density, and environmental monitoring. Australia committed AUD 500 million (USD 335 million) in 2024 toward privacy-compliant transport hub security, while Japan’s aging population dynamics drive AI-based anomaly detection to assist emergency response.
North America recorded sustained upgrades, with U.S. municipalities allocating USD 3.2 billion for modernization in 2024. Federal infrastructure bills subsidize smaller cities, while Canadian metropolitan areas pilot hybrid-cloud deployments that meet local data-sovereignty requirements. Europe’s 7.84% projected CAGR reflects GDPR-driven equipment refresh cycles and the AI Act’s technical-compliance impetus. The city surveillance market size expansion across these mature regions is steadier but underpinned by mandatory cybersecurity and privacy overhauls. The Middle East and Africa are projected to record a 8.92% CAGR, powered by megaprojects such as Saudi Arabia’s NEOM and the UAE’s national digital-city programs. Qatar repurposes 2022 World Cup infrastructure into multi-agency surveillance grids, while Nigeria’s USD 200 million urban security outlay underscores the rising demand in sub-Saharan Africa. South America is experiencing emergent growth, as evidenced by Brazil’s USD 800 million smart-city commitments and Argentina’s integration of surveillance with 911-call centers. Currency volatility and procurement red tape temper volume but not strategic intent, signaling a gradual uptick in the city surveillance market.

Regulatory Landscape
Regulation increasingly shapes city surveillance feature sets, procurement practices, and vendor qualification, especially around biometric identification, data protection, and cyber hardening. In Europe, the EU Artificial Intelligence Act (Regulation (EU) 2024/1689) tightens requirements for AI-enabled surveillance, including high-risk use cases such as biometric identification in publicly accessible spaces. It also adds obligations such as fundamental-rights impact assessments and third-party conformity assessment through notified bodies, with key provisions taking effect from August 2, 2026. GDPR enforcement has heightened compliance risk for municipalities that mishandle surveillance data, pushing buyers toward privacy-by-design deployments and stronger governance around retention, access logging, and redaction or anonymization capabilities.
In the United States, federal and local controls are influencing both supply chains and operating practices. NIST's AI Risk Management Framework continues to be used as a reference point for trustworthy AI governance, and in April 2026 NIST released a concept note for an AI RMF Profile focused on Trustworthy AI in Critical Infrastructure, relevant to AI-enabled monitoring systems deployed in public safety and critical infrastructure contexts. Separately, the FCC's supply chain security actions through its Covered List have continued to affect eligible equipment for government facility security and critical infrastructure surveillance. A July 2026 Federal Register notice addressed prohibitions affecting continued importation and marketing of previously authorized equipment tied to the Covered List, increasing the importance of compliance screening during municipal procurements.
Value Chain Analysis
The city surveillance value chain spans hardware, software, and services, with procurement increasingly anchored in integrated outcomes rather than standalone devices. The upstream layer includes image sensors, optics, SoCs and edge AI chips, enclosures, storage, and networking (wired fiber and wireless/5G backhaul). Camera OEMs and ODMs assemble edge devices and gateways, which then feed into midstream software such as video management systems, AI analytics, and integration middleware connecting to emergency response, traffic operations, and smart city platforms. Downstream delivery is dominated by system integrators, telecom and cloud partners, and managed service providers that operate, patch, and tune analytics across multi-year municipal contracts.
Regulatory and geopolitical constraints are reshaping channel choices and vendor qualification steps across the chain. The EU AI Act elevates compliance and documentation requirements for certain AI surveillance capabilities, while US-facing procurement restrictions and supply chain screening, including FCC-related constraints and NDAA-style compliance requirements referenced in public procurements, are prompting some buyers to re-evaluate device origin, firmware governance, and lifecycle support commitments. Contracting practices are also evolving around data governance: US GAO guidance for smart city technologies highlights the need for city-level control over data ownership, and municipalities increasingly translate this into RFP clauses covering municipal ownership of video and metadata, limits on secondary use, and audit rights. That shift increases the importance of integrators and cloud providers that can deliver verifiable access controls and retention policies.
Competitive Landscape
The five leading suppliers accounted for approximately 45% of global revenue in 2024, positioning the market at a moderate level of concentration. Regulatory curbs on Chinese brands in the U.S. and parts of Europe have created a white space for Axis Communications, Bosch, and Hanwha Vision, which emphasize GDPR conformity and cybersecurity hardening. Motorola Solutions’ 2024 acquisition of analytics specialist Calipsa strengthens its software stack, while Honeywell augments its video-management platform with cloud connectors and zero-trust security layers.
Edge-AI capabilities, encryption depth, and open-platform interoperability now serve as purchase triggers more than frame rate or pixel density. Cisco expands its smart-city platform to fold video feeds into IoT dashboards, competing head-to-head with Amazon Web Services in the municipal cloud segment. Analytics-only vendors enter via software-subscription models, challenging hardware-centric incumbents by decoupling intelligence from proprietary devices.
Strategic alliances intensify: Axis-Microsoft co-engineering, Genetec-Azure cloud pipelines, and Bosch-AWS data-lake optimizations highlight an ecosystem approach that reshapes buyer expectations. With vendor margins leaning increasingly toward services and recurring licenses, the city surveillance market is transitioning from unit-shipment competition to platform-lifecycle domination.
City Surveillance Industry Leaders
Hangzhou Hikvision Digital Technology Co., Ltd.
Zhejiang Dahua Technology Co., Ltd.
Axis Communications AB (Canon Inc.)
Robert Bosch GmbH – Bosch Security and Safety Systems
Motorola Solutions, Inc. – Avigilon Corporation
- *Disclaimer: Major Players sorted in no particular order

Market Opportunities and Future Outlook
Opportunities cluster around AI-enabled upgrades that convert existing camera footprints into measurable operational outcomes, alongside procurement models that reduce upfront municipal capital burden. Large, multi-phase city programs continue to expand addressable scope for platforms that support hybrid deployments, privacy controls, and open integration. Hong Kong Police Forces SmartView program funding papers for phases two and three include planned expansion pace of over 20,000 cameras per year toward a 60,000-camera target by 2031, which indicates sustained demand for scalable video management and analytics. In South Asia, work commenced on Sindh Safe Cities Authority's Karachi Safe City Project Phase-II (Rs9.98 billion) with 2,314 smart cameras that include facial recognition and ANPR, reinforcing demand for edge analytics, storage optimization, and secure inter-agency access.
Standards and compliance are also creating whitespace for vendors that can document performance and security for intelligent video analytics and connected endpoints. The publication of IEC 62676-6:2026 in February 2026 formalizes performance testing and grading for real-time intelligent video content analysis, giving cities a procurement anchor for comparable benchmarking across AI analytics offerings. Financing and delivery models are evolving as well, with PPP structures and contract variations supporting rapid expansion: Navi Mumbai Municipal Corporation approved a PPP-based smart CCTV and digital display project at 68 junctions (INR 527 crore), and Johor Bahru City Council's contract variation with ITMax System Bhd (RM603.5 million) for AI-enabled surveillance and digital twin elements reflects municipal appetite for bundled, outcomes-oriented deployments that combine monitoring with broader city operations tooling.
Recent Industry Developments
- July 2026: Hikvision announced it had earned what it described as the industry's first EUCC (European Cybersecurity Scheme on Common Criteria) certification for its iDS-2CD7x series network cameras, issued by TrustCB B.V. The milestone reinforces the shift toward security assurance as a differentiator in public-sector camera procurements where lifecycle patching, hardening, and third-party evaluation have become key vendor qualification criteria. The certification signals a growing emphasis on security assurance in public procurement and may influence supplier selection toward vendors with formal EUCC validation.
- October 2025: Axis Communications entered a USD 200 million partnership with Microsoft Azure to build cloud-native surveillance platforms for smart cities. The collaboration deepens hybrid-cloud offerings and strengthens vendor positioning where municipalities want scalable analytics with documented controls for privacy and data governance. This partnership underscores the industry trend toward cloud-enabled, open-architecture surveillance ecosystems.
- July 2024: U.S. municipalities earmarked USD 3.2 billion for camera-network upgrades as integrated video networks became a core element of urban security infrastructure modernization programs. The spending emphasis accelerated competitive focus on end-to-end platforms that integrate cameras, VMS, analytics, and secure connectivity across multi-agency deployments. The scale of investment helped accelerate the shift to platform-centric procurement models.


Research Methodology Framework and Report Scope
Market Definition and Coverage
For this study, the city surveillance market is defined as the revenue generated from selling and installing systems used by city authorities to monitor public spaces for safety and operations, supported by cameras, storage, video management, and video analytics.
Scope exclusions: This sizing does not count private indoor security setups that are not part of citywide monitoring programs, and it also excludes unrelated physical security equipment like access control and intrusion alarms.
Segmentation Overview
- By Component
- Camera
- Storage
- Video Management System
- Video Analytics
- By Deployment Mode
- On-Premise
- Cloud
- Hybrid
- By Camera Connectivity
- Wired
- Wireless
- By Application
- Traffic Management
- Law Enforcement
- Critical Infrastructure Protection
- Public Transportation Hubs
- Other Application
- By End User
- Municipal Authorities
- Police Departments
- Transportation Agencies
- Utilities
- Other End User
- By Geography
- North America
- United States
- Canada
- Mexico
- Europe
- Germany
- United Kingdom
- France
- Russia
- Rest of Europe
- Asia-Pacific
- China
- Japan
- India
- South Korea
- Australia
- Rest of Asia-Pacific
- Middle East and Africa
- Middle East
- Saudi Arabia
- United Arab Emirates
- Rest of Middle East
- Africa
- South Africa
- Egypt
- Rest of Africa
- Middle East
- South America
- Brazil
- Argentina
- Rest of South America
- North America
Data Sources, Market Sizing, and Validation
Desk Research
Desk research was used to set the market boundaries and to build a practical demand story across regions before we started modeling. We leaned on public sources such as national procurement and tender portals, city budget documents, and police or transport authority annual reports that describe surveillance expansion plans. We also referred to trade and standards bodies such as ISO/IEC publications, as well as broadband and mobile network coverage data from official telecom regulators, since connectivity influences how systems are deployed.
To sanity check the supply side, we reviewed company annual reports, regulatory filings, and investor presentations where surveillance related revenue, margins, or backlog commentary is disclosed. Patent databases were also scanned to understand the direction of video analytics and edge processing, since those technology trends tend to affect pricing over time. In a few cases, paid subscriptions focused on company financials and another that tracks global tenders were used to cross-verify timelines and contract values. These sources are illustrative only, and many other public documents and data points were used during data collection, validation, and clarification.
Primary Interviews and Surveys
Primary work was carried out through expert interviews and structured surveys with stakeholders across the city surveillance ecosystem, including system integrators, component suppliers, software providers, and end users involved in municipal safety and traffic monitoring. Inputs were gathered across APAC, EMEA, and the Americas to pressure test adoption assumptions, typical project scopes, and how hybrid and cloud deployment choices are changing system budgets. Where desk sources were thin, respondents helped confirm renewal cycles, pricing behavior, and what is counted as installation versus ongoing support, so the model could be tuned with realistic boundaries.
Distribution of primary research fieldwork respondents
| Company type | Respondent position | Region |
|---|---|---|
| Top tier: 31% | CXOs: 18% | APAC: 39% |
| Mid tier: 50% | Functional/Unit leaders: 39% | EMEA: 36% |
| Smaller Players: 19% | Managers: 43% | Americas: 25% |
Market-Sizing & Forecasting
The market was sized using a top-down approach where city surveillance demand is reconstructed from public safety and smart-city spending signals, procurement pipelines, and the typical system cost mix across cameras, storage, VMS, and analytics. Once the total demand pool was formed, it was split by deployment style and connectivity patterns (on-premise, cloud, hybrid, and wired versus wireless) to keep the totals consistent with how solutions are actually purchased.
To keep the outputs grounded, the totals were cross-checked with selective bottom-up approximations, such as sampled project budgets by city size, a reasonableness check on installed camera additions, and an indicative ASP times volume view for key system elements. Where gaps appeared in the bottom-up checks, we adjusted assumptions using interview feedback and then re-tested the math so the story stayed traceable. The model uses a small set of practical inputs, including new camera deployments linked to urban infrastructure projects, replacement and upgrade cycles, the share of projects adding analytics licenses, storage capacity per camera for higher resolution video, and connectivity availability that supports remote monitoring.
For forecasting, scenario analysis was used with a base case that aligns to what city buyers and integrators described as realistic funding and rollout speeds. Adoption curves for cloud and hybrid deployments were refreshed year by year, and pricing was moved using expected mix shifts toward higher resolution hardware and more analytics per camera. Where regional data was uneven, we filled the gaps using proxy indicators like municipal budget growth and project announcements, then reviewed those proxies again through primary feedback.
Data Validation & Update Cycle
Validation was handled through multiple checks so the final market number did not rely on one data stream. We compared the model outputs against independent signals such as city tender activity, large program timelines, and reported public safety technology spending, then reviewed any variances that looked out of line. Where an anomaly showed up, assumptions were revisited and, when needed, the relevant experts were re-contacted to confirm whether the issue was a one-off project, a timing mismatch, or a scope overlap.
Before sign-off, the work goes through a step-by-step analyst review where definitions, calculations, and year-on-year movements are checked for consistency. The report is refreshed annually, and interim updates are triggered when material events occur, such as major policy shifts or unusually large citywide program awards. Right before delivery, we run a final pass to ensure the latest public announcements and macro indicators have been reflected.
Mordor Intelligence's Global City Surveillance Market Sizing Compared With Other Published Estimates
It is normal to see different market values for city surveillance, even when everyone is talking about similar technologies. The spread usually comes from differences in what is counted, the year used as the reference point, and how pricing and deployment shifts are treated across the forecast window.
By tracking deployment mode mix shifts and refreshing installation versus ongoing service boundaries, Mordor Intelligence keeps the 2026 market size tied to sale and installation revenues of city surveillance systems rather than broad public security spend that can pull in adjacent categories. In addition, some publishers anchor their totals to camera-only definitions, or they use aggressive assumptions for analytics attach rates and cloud adoption, which can inflate ASPs when city budgets are staged over multiple years.
Benchmark comparison
| Source | Market Size | Gaps in Research Methodology |
|---|---|---|
| Mordor Intelligence | USD 15.57 B (2026) | |
| Industry Publisher A | USD 33.25 B (2024) | Uses a camera-system scope and a different base year, which shifts the comparison because the estimate is not aligned to a full city surveillance stack definition and may treat revenue and unit outputs together. |
| Regional Consultancy B | USD 62.40 B (2025) | Appears to bundle hardware, software, and services across wider public security use cases, which can double count adjacent spending categories and apply higher assumed adoption of analytics and IP upgrades. |
The table shows that timing and scope choices explain most of the difference, not just growth expectations. When boundaries are kept tight around city surveillance system sales and installation, and assumptions are checked against procurement signals and real project behavior, the final number becomes easier to reproduce and defend on a client call.


Key Questions Answered in the Report
How large is the global city surveillance market in 2026?
The city surveillance market size stands at USD 15.57 billion in 2026.
What is the projected CAGR for city-wide surveillance spending through 2031?
Spending is forecast to rise at an 8.12% CAGR between 2026 and 2031.
Which region currently leads city-camera deployments?
Asia-Pacific holds 35.05% of revenue, the largest regional share.
Which application segment is growing fastest?
Surveillance for public transportation hubs is projected to advance at a 8.83% CAGR.
What deployment model is gaining traction over on-premise setups?
Cloud-based and hybrid deployments together form the fastest-growing approach, with cloud alone forecast at a 9.29% CAGR.
Which regulatory trend most affects future camera roll-outs in Europe?
Which regulatory trend most affects future camera roll-outs in Europe?
Page last updated on:






