
Chemotherapy-Induced Neutropenia Market Size and Share
Market Overview
| Study Period | 2020 - 2031 |
|---|---|
| Market Size (2026) | USD 674.31 Million |
| Market Size (2031) | USD 801.57 Million |
| Growth Rate (2026 - 2031) | 3.54 % |
| Fastest Growing Market | Asia-Pacific |
| Largest Market | North America |
| Market Concentration | Medium |
Major Players *Disclaimer: Major Players sorted in no particular order Image © Mordor Intelligence. Reuse requires attribution under CC BY 4.0. | |
Chemotherapy-Induced Neutropenia Market Analysis by Mordor Intelligence
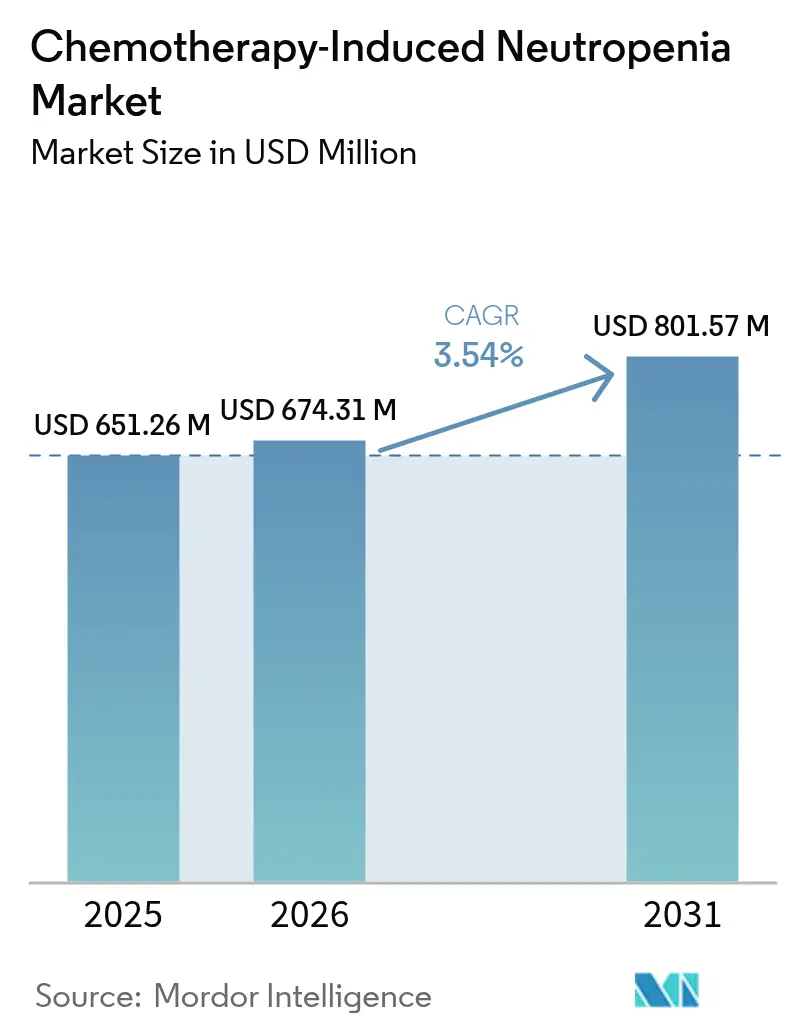
The chemotherapy-induced neutropenia market size was valued at USD 651.26 million in 2025 and estimated to grow from USD 674.31 million in 2026 to reach USD 801.57 million by 2031, at a CAGR of 3.54% during the forecast period (2026-2031). Moderate expansion stems from the growing number of cancer patients who require myelosuppressive regimens, the steady roll-out of long-acting granulocyte colony-stimulating factors, and wider clinical uptake of predictive analytics that refine febrile neutropenia risk assessment. Although biosimilars continue to compress prices, regulatory approvals for differentiated products such as efbemalenograstim alfa offset margin pressure and maintain revenue growth drivers. The chemotherapy-induced neutropenia market now pivots on manufacturing reliability after multiple supply interruptions demonstrated the commercial importance of redundant facilities and robust quality controls. Parallel progress in outpatient oncology models and tele-pharmacy solutions supports geographic expansion as patients and payers increasingly prefer home-based prophylaxis options that reduce hospitalization costs.
Key Report Takeaways
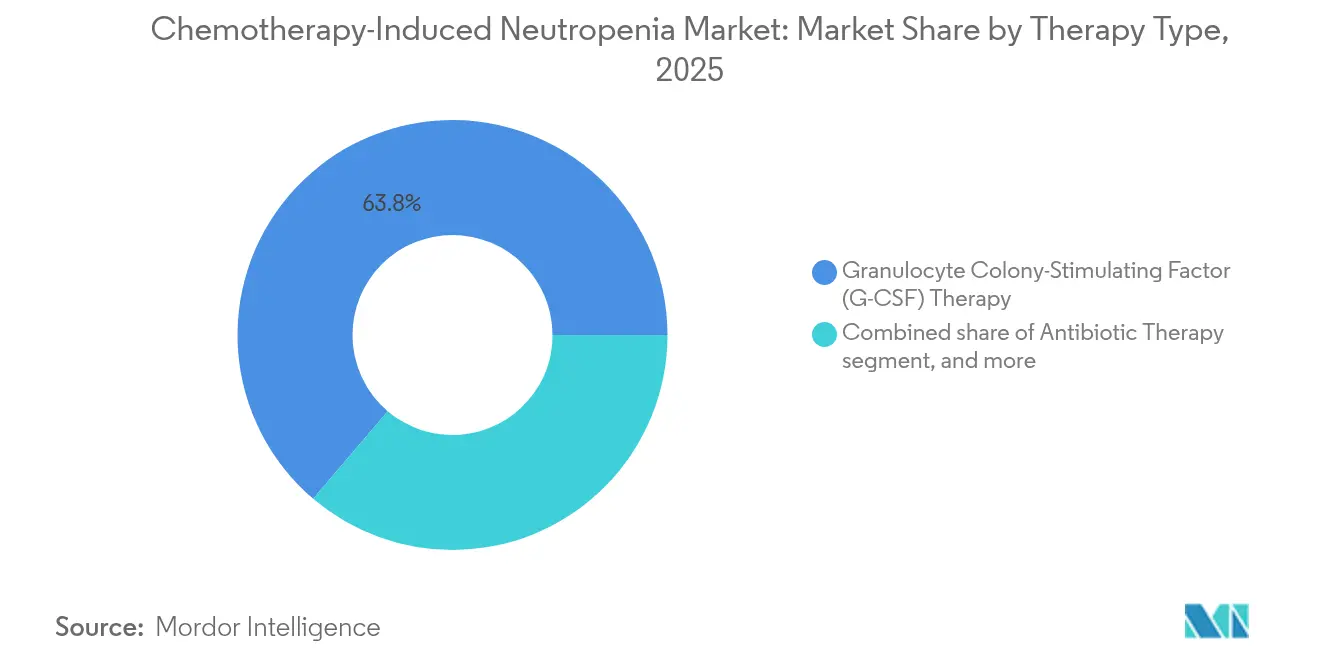
- By therapy type, granulocyte colony-stimulating factor commanded 63.78% of Chemotherapy-Induced Neutropenia market share in 2025, while granulocyte transfusion is advancing at a 5.21% CAGR through 2031.
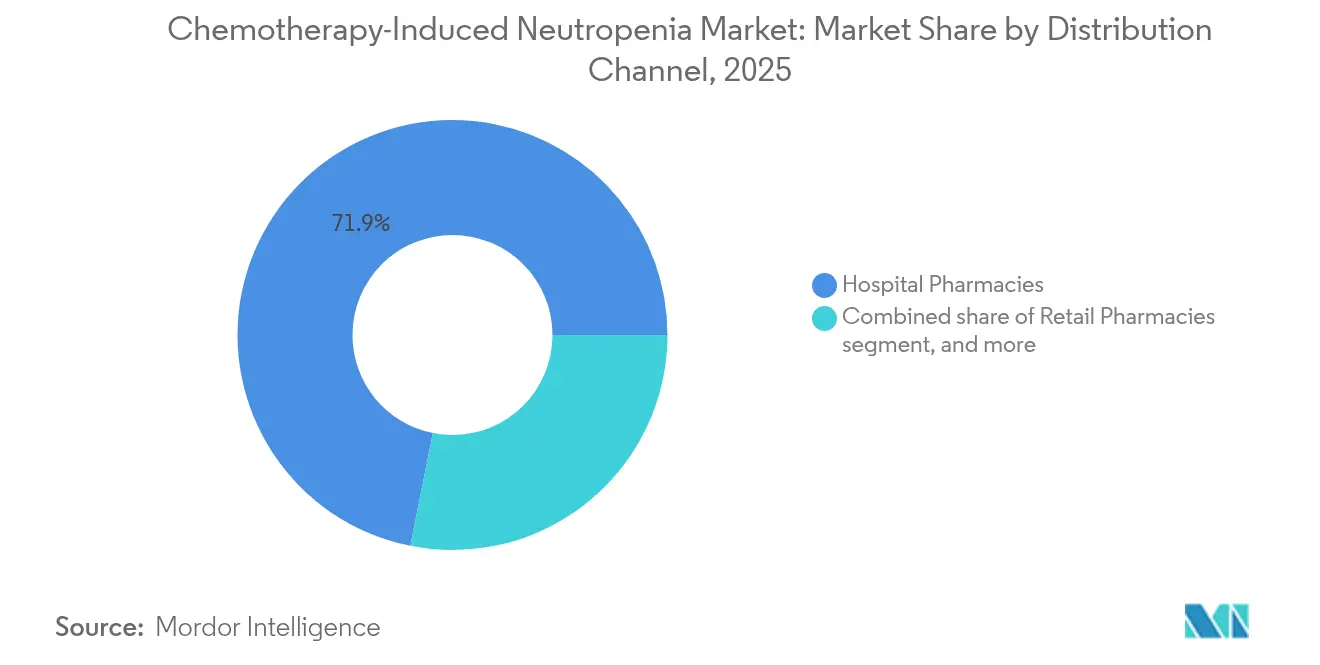
- By distribution channel, hospital pharmacies held 71.86% of the Chemotherapy-Induced Neutropenia market size in 2025, whereas online pharmacies record the fastest expansion at a 6.46% CAGR to 2031.
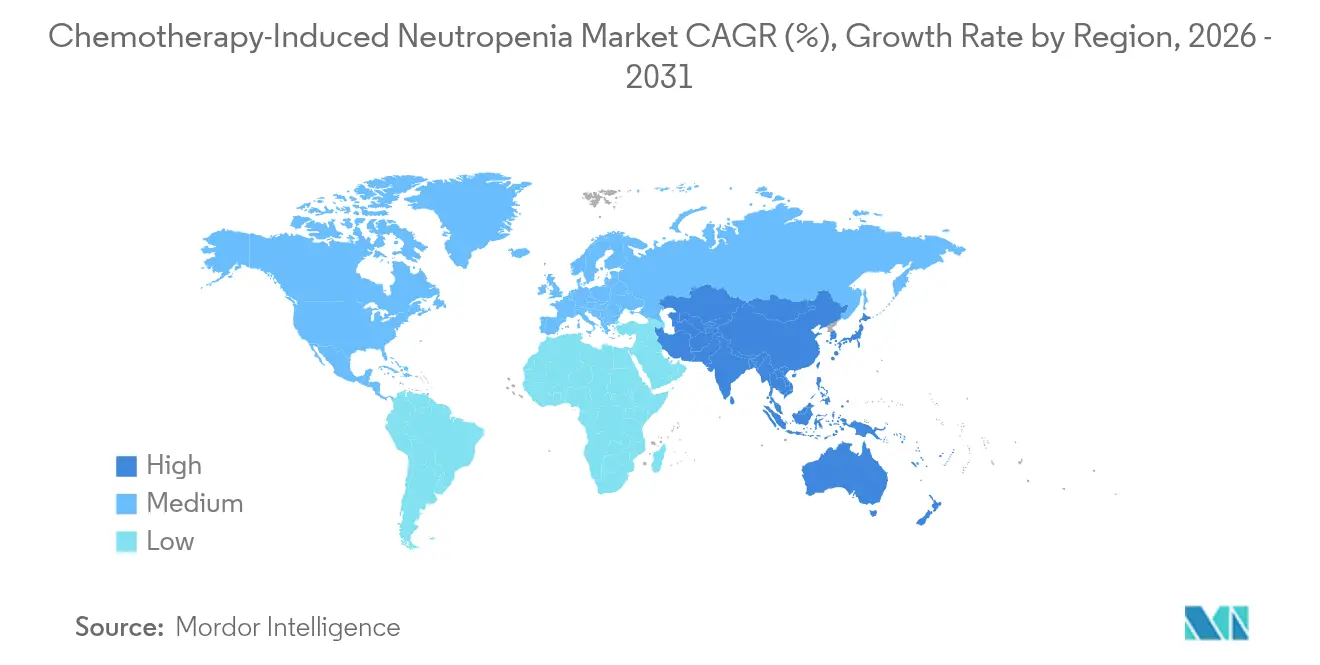
- By geography, North America led with 42.10% share in 2025 and Asia-Pacific is projected to increase at a 4.70% CAGR between 2026 and 2031.
Note: Market size and forecast figures in this report are generated using Mordor Intelligence’s proprietary estimation framework, updated with the latest available data and insights as of 2026.
Market Trends and Insights
Drivers Impact Analysis of Chemotherapy-Induced Neutropenia Market*
| Driver | % Impact on CAGR Forecast | Geographic Relevance | Impact Timeline |
|---|---|---|---|
| Rising global cancer burden | +1.2% | Global with highest impact in Asia-Pacific | Long term (≥ 4 years) |
| Growing adoption of chemotherapy regimens | +0.8% | North America and Europe expanding to Asia-Pacific | Medium term (2-4 years) |
| Expanding access to biosimilar growth factors | +0.6% | Global, especially cost-sensitive markets | Short term (≤ 2 years) |
| Favorable clinical guidelines for prophylactic G-CSF | +0.4% | North America and Europe | Medium term (2-4 years) |
| Shift toward outpatient oncology care models | +0.3% | North America and Europe, early urban Asia-Pacific | Medium term (2-4 years) |
| Integration of predictive analytics for risk profiling | +0.2% | Technology-advanced markets in North America and Europe | Long term (≥ 4 years) |
| Source: Mordor Intelligence | |||
Rising Global Cancer Burden
Higher incidence of solid tumors and hematologic malignancies raises demand for prophylactic supportive care. Acute myeloid leukemia treatment protocols that combine venetoclax with conventional 7+3 chemotherapy intensify myelosuppression, leading to more frequent G-CSF use. Aging populations in North America and Europe further enlarge the eligible patient base because elderly individuals carry increased risk for febrile neutropenia. In Asia-Pacific, adoption of Western-style dose-dense regimens expands addressable volumes as oncology capacity scales. Population-based screening programs also detect cancers earlier, allowing more patients to complete multi-cycle chemotherapy that necessitates prophylaxis. The Chemotherapy-Induced Neutropenia market therefore gains steady patient inflow even as overall chemotherapy utilization faces competitive pressure from immunotherapy.
Expanding Access to Biosimilar Growth Factors
Pegfilgrastim biosimilar average selling prices reached USD 2,050 compared with reference products above USD 3,600, reducing payer burden and unlocking treatment for under-insured patients. Streamlined FDA guidance that clarifies analytical similarity testing decreased review cycles by three months in 2024 and encouraged mid-size manufacturers to file abbreviated biologics license applications. Tanvex BioPharma’s filgrastim biosimilar won FDA approval and accessed a USD 403 million opportunity, illustrating the potential scale achievable through regulatory excellence. In Europe, interchangeability recommendations simplify substitution in hospital formularies and accelerate hospital tender volumes. Lower unit prices, paired with equivalent efficacy, strengthen the Chemotherapy-Induced Neutropenia market as payers authorize broader prophylaxis coverage.
Favorable Clinical Guidelines for Prophylactic G-CSF Use
The NCCN recommends primary prophylaxis when febrile neutropenia risk surpasses 20%, a threshold now reached by many modern regimens[1]. European consensus statements similarly propose individualized risk models that integrate age, performance status, and comorbidities. The same-day administration paradigm gained validation through multi-center studies that documented no rise in infection events, thereby simplifying logistics. Japanese guidelines for acute myeloid leukemia formally incorporate long-acting G-CSF after consolidation cycles, raising standard-of-care expectations across Asia. Insurance reimbursement in the United States now mirrors guideline language, improving alignment between payers and prescribers and fortifying growth prospects for the Chemotherapy-Induced Neutropenia market.
Integration of Predictive Analytics for Neutropenia Risk Profiling
Machine-learning models using electronic health record data predicted febrile neutropenia with 97% accuracy and 93% sensitivity, allowing clinicians to target prophylaxis more precisely[2]. Adoption of these tools reduces overtreatment and optimizes scheduling of growth factors, especially in value-based care arrangements. Vendors now embed risk algorithms into oncology electronic prescribing modules, which simplifies clinician workflow and increases adherence to guideline-defined prophylaxis. Pharmaceutical companies partner with health-tech firms to offer integrated care pathways that pair biologics with analytics, reinforcing brand loyalty. As these models mature, they further stabilize volumes within the Chemotherapy-Induced Neutropenia market.
Restraints Impact Analysis of Chemotherapy-Induced Neutropenia Market*
| Restraints Impact Analysis | (~) % Impact on CAGR Forecast | Geographic Relevance | Impact Timeline |
|---|---|---|---|
| High treatment costs and reimbursement gaps | -0.8% | Global, strongly felt in emerging markets | Short term (≤ 2 years) |
| Stringent regulatory requirements for biologics | -0.4% | Global with variable local intensity | Medium term (2-4 years) |
| Declining chemotherapy utilization in IO era | -0.3% | Developed regions with rapid immunotherapy uptake | Long term (≥ 4 years) |
| Manufacturing capacity constraints for biologic APIs | -0.2% | Global with supply chain concentration risks | Short term (≤ 2 years) |
| Source: Mordor Intelligence | |||
High Treatment Costs and Reimbursement Gaps
Average hospitalization cost for a febrile neutropenia episode reached USD 35,899 in 2024, placing a heavy burden on health systems. Patients in low-income countries confront out-of-pocket expenses exceeding annual household income. Although biosimilars reduce drug acquisition prices, ancillary costs such as infusion chair time and laboratory monitoring persist. Prior authorization processes delay therapy start by up to four days according to payer audits, potentially heightening infection risk. Charitable foundations fill financial gaps, yet lifetime maximums cap assistance at USD 2,200 per year, well below typical multi-cycle prophylaxis costs. These financial frictions temper the otherwise positive outlook for the Chemotherapy-Induced Neutropenia market.
Stringent Regulatory Requirements for Biologics and Biosimilars
An FDA biosimilar application requiring clinical data incurs USD 1.47 million in user fees, while post-approval pharmacovigilance adds further expense. Divergent dossier requirements among EMA, PMDA, and NMPA oblige manufacturers to run simultaneous regulatory tracks that elevate cost and stretch timelines. Maintaining cold-chain integrity and meeting global GMP audits tighten operational budgets, particularly for emerging market entrants. Although harmonization dialogues promise gradual alignment, near-term administrative complexity trims several basis points from the Chemotherapy-Induced Neutropenia market CAGR. Small developers sometimes license assets to regional partners instead of seeking global approvals, which fragments the competitive field.
*Our forecasts treat driver/restraint impacts as directional, not additive. The impact forecasts reflect baseline growth, mix effects, and variable interactions.
Chemotherapy-Induced Neutropenia Market Segment Analysis
By Therapy Type:
G-CSF Dominance Drives InnovationG-CSF therapy generated the largest Chemotherapy-Induced Neutropenia market size contribution in 2025, accounting for 63.78% of revenues as hospitals adhere to evidence-based prophylaxis protocols. The product class includes filgrastim, pegfilgrastim, and efbemalenograstim alfa, each offering varying half-lives that align with different chemotherapy schedules. Competitive tendering in Europe fostered rapid biosimilar uptake, yet brand loyalty in on-body devices sustains premium segments. Long-acting agents reduce clinic visits and enhance adherence, which positions them favourably in value-based contracts. A pipeline of engineered variants aims to improve receptor affinity without raising bone pain incidence, indicating continued innovation within an already mature class.
Granulocyte transfusion, while niche, records the fastest CAGR at 5.21% through 2031 as gene-edited donor cells and ex-vivo expansion technologies overcome historical supply limitations. Pediatric oncology centres adopt high-dose transfusions for refractory infections that fail to respond to growth factors, thereby carving a unique clinical foothold. Academic collaborations investigate induced pluripotent stem cells to mass-produce functional neutrophils, an advance that could redefine supportive care. Antibiotic therapy remains an indispensable pillar, yet stewardship programs temper volume growth by encouraging de-escalation once cultures clear. Novel prophylactic agents such as trilaciclib aim to pre-empt neutropenia by transiently arresting bone-marrow cell cycling; positive phase III data sets the stage for commercial entry by 2027. Together, these sub-segments ensure a diversified and resilient Chemotherapy-Induced Neutropenia market.

By Distribution Channel:
Digital Transformation AcceleratesHospital pharmacies contributed 71.86% of Chemotherapy-Induced Neutropenia market size in 2025, anchored by integrated physician-pharmacy organisations that manage complex biologic logistics under one roof. Closed-door centralised locations streamline compounding, uphold cold-chain fidelity, and facilitate billing, which protects share despite the rise of external competitors. Oncology groups appreciate tighter control over formulary adherence and patient education that in-house settings provide.
Online pharmacies expand at a 6.46% CAGR on the strength of patient preference for doorstep delivery of specialty medicines and payer push for lower dispensing fees. Remote supervision protocols, including video-enabled injection training, assure safety and compliance. Legislative changes in several US states now permit biologic drop-shipping with temperature loggers, widening reach into rural markets. Retail pharmacies meet demand for oral supportive care, yet their share plateaus as biologics dominate revenue skew. Clinical home infusion companies partner with device makers to bundle on-body injectors with nursing services, an arrangement that reinforces direct-to-patient supply chains and reshapes competitive boundaries inside the Chemotherapy-Induced Neutropenia market.
Geography Analysis
North America Chemotherapy-Induced Neutropenia Market
North America delivered the largest regional revenue pool, holding 42.10% share of the chemotherapy-induced neutropenia market in 2025, propelled by broad insurance coverage and early adoption of long-acting biosimilars. Medicare reimbursement supports same-day G-CSF administration for qualifying regimens, which lowers infusion chair utilisation and supports outpatient growth. The region features advanced analytics that integrate electronic health records with risk algorithms, allowing oncologists to personalise prophylactic cycles and limit unnecessary spending. Amgen and Coherus maintain robust commercial infrastructure that secures high formulary presence across US hospital systems, while pharmaceutical benefit managers leverage biosimilar competition to negotiate lower price corridors.
APAC Chemotherapy-Induced Neutropenia Market
Asia-Pacific represents the fastest expanding territory with a 4.70% CAGR to 2031. China approved Mabwell’s Mailisheng injection in 2025, adding a domestically produced long-acting G-CSF that reduces dependence on imports. Uptake of Western-style dose-dense chemotherapy grows across tier-2 cities, boosting prophylaxis volumes. Japan’s evidence-anchored guidelines encourage early G-CSF prophylaxis after intensive AML therapy, which solidifies class uptake. India and South-East Asia witness rising biosimilar penetration as government procurement favours cost-effective options for national cancer programmes. Tele-oncology services bridge geographic barriers, making remote G-CSF administration feasible in rural provinces.
EMEA and LATAM Chemotherapy-Induced Neutropenia Market
Europe maintains a mature yet opportunity-laden environment where tender dynamics foster rapid micro-shifts in share between originators and biosimilars. The EMA approved Ryzneuta in 2024, adding a novel long-acting alternative that lengthens patient dosing intervals. National health services leverage central procurement to drive price deflation, benefiting budget sustainability but compressing margins. Eastern European countries with historically limited access to biologics adopt biosimilars at accelerated rates as reimbursement policies evolve. Latin America, the Middle East, and Africa still account for modest volumes, yet partnership models such as Teva’s Global HOPE programme improve paediatric oncology supportive care and lay groundwork for future chemotherapy-induced neutropenia market expansion.
Regulatory Landscape
In the United States, the FDA continues to apply stringent comparability, GMP, and pharmacovigilance expectations for G-CSF biologics and biosimilars, a burden reflected in post-approval monitoring and payer alignment. Clinical practice standards also shape real-world use and reimbursement, including NCCN Myeloid Growth Factors guidance (Version 3.2026) and an updated ASCO guideline on hematopoietic colony-stimulating factors published in March 2026.
Competitive Landscape
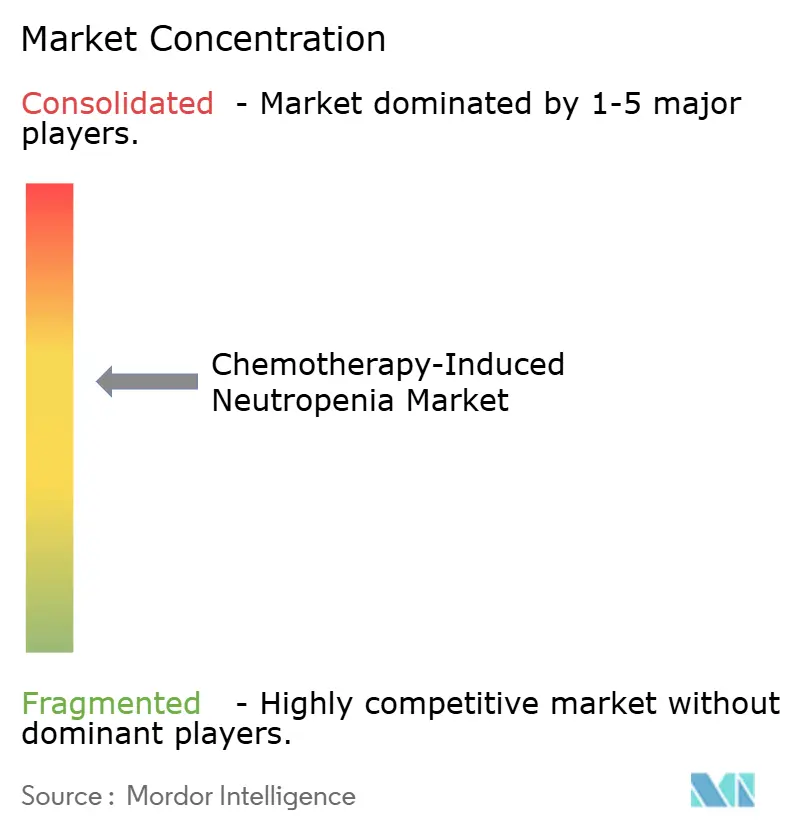
The chemotherapy-induced neutropenia market exhibits moderate consolidation with a top-five collective share hovering near 68%. Amgen leverages a diversified oncology portfolio and proprietary on-body injector technology to defend its leading position. Coherus BioSciences competes on value and recently won FDA approval for Udenyca Onpro, a five-minute injector that narrows the feature gap with Neulasta Onpro while undercutting on price. Sandoz continues to build a multi-region biosimilar footprint via aggressive tender strategies and broad product portfolios. Tanvex and Mabwell embody the rise of Asia-based challengers that rely on cost-efficient manufacturing, regulatory agility, and domestic procurement relationships.
Technology convergence sharpens competitive angles as players integrate remote monitoring devices, artificial intelligence risk tools, and digital companion apps. MIT’s Leuko device uses optical imaging to estimate white-blood-cell counts non-invasively and could pair with long-acting G-CSF to create a bundled adherence solution. Firms explore strategic partnerships, such as X4 Pharmaceuticals licensing Mavorixafor to Norgine for Europe and Oceania, broadening reach without diluting core focus. Horizontal mergers remain limited as regulators scrutinise biologic portfolio overlaps, yet supply chain collaborations flourish to ensure redundant drug substance capacity.
Manufacturing resilience emerges as a market differentiator after Covid-19 and isolated contamination events revealed vulnerabilities. Companies with dual sourcing and captive fill-finish lines gain purchasing preference from large group purchasing organisations. Innovative delivery devices further separate brands; retractable needle on-body systems and temperature-stable formulations promise lower nursing burden and higher patient satisfaction. Price competition intensifies, but differentiated service offerings and evidence-backed outcomes sustain profitability across the Chemotherapy-Induced Neutropenia market.
Chemotherapy-Induced Neutropenia Industry Leaders
-
Amgen, Inc.
-
Teva Pharmaceuticals Industries Ltd.
-
BeyondSpring Pharmaceuticals Inc
-
Aurobindo Pharma
-
Merck & Co.
- *Disclaimer: Major Players sorted in no particular order
Chemotherapy-Induced Neutropenia Market Companies Covered in this Report
- Amgen
- Pfizer
- Sandoz (Novartis)
- Teva Pharmaceutical Industries
- Merck
- GlaxoSmithKline
- Coherus BioSciences
- Aurobindo Pharma
- Fresenius
- BeyondSpring Pharma
- Kyowa Kirin
- Intas Pharmaceuticals
- Dr. Reddy’s Laboratories
- Accord Healthcare
- Viatris
- Hanmi Pharmaceutical
- Apotex
- Mundipharma
- Lupin
- Celltrion
Market Opportunities and Future Outlook
The current landscape shows a broadening of long-acting G-CSF option sets through biosimilars and differentiated long-acting agents, expanding payer adoption and channel reach beyond hospital pharmacies. This is anchored by concrete regulatory momentum, including FDA approvals in 2026 for Accord BioPharma biosimilars Ennumo (pegfilgrastim-pccg) and Filkri (filgrastim-laha) and the EMA CHMP positive opinion in June 2026 recommending marketing authorization for Nylaspeg (pegfilgrastim). Licencing activity around Ryzneuta illustrates a route to market access in mature European markets, complementing supply reliability and the growing role of home-based prophylaxis and specialty distribution. In parallel, clinical development continues to feed future differentiation within supportive care, including phase III neutropenia-prophylaxis evidence in common solid tumors and wider integration of predictive analytics and remote monitoring tools noted in the report context to refine targeting and reduce avoidable utilization.
Recent Industry Developments in Chemotherapy-Induced Neutropenia Market
- July 2026: Accord BioPharma announced that the US FDA approved Ennumo (pegfilgrastim-pccg), a pegfilgrastim biosimilar, for reducing infection incidence in patients with non-myeloid malignancies receiving myelosuppressive anti-cancer drugs. The approval adds another long-acting G-CSF option and intensifies price and contracting competition in prophylaxis-heavy regimens across US oncology channels.
- June 2025: Mabwell received China NMPA approval for Mailisheng injection, a long-acting G-CSF for neutropenia prophylaxis. The decision expands domestic supply options in China and supports broader use of prophylactic growth factors as oncology capacity scales beyond major tier-1 centers.
- March 2024: The European Commission granted marketing authorisation for Ryzneuta (efbemalenograstim alfa), adding a novel long-acting alternative within the EU. This approval widened therapeutic choice for prophylaxis and reinforced manufacturer incentives to differentiate on dosing convenience and service support alongside biosimilar tender competition.
Chemotherapy-Induced Neutropenia Market Report Scope and Research Methodology
Market Definition and Coverage
For this study, the market is defined as revenues generated from therapies used to prevent or treat chemotherapy-induced neutropenia in cancer patients, across prophylaxis and treatment use in routine clinical practice, and reported in USD at manufacturer level.
Scope exclusions: This sizing excludes chemotherapy drugs themselves and counts supportive products only when they are used specifically for chemotherapy-induced neutropenia management.
Segments Covered in This Report
- By Therapy Type
- Antibiotic Therapy
- Granulocyte Colony-Stimulating Factor (G-CSF) Therapy
- Granulocyte Transfusion
- Other Therapy Types
- By Distribution Channel
- Hospital Pharmacies
- Retail Pharmacies
- Online Pharmacies
- Geography
- North America
- United States
- Canada
- Mexico
- Europe
- Germany
- United Kingdom
- France
- Italy
- Spain
- Rest of Europe
- Asia-Pacific
- China
- Japan
- India
- Australia
- South Korea
- Rest of Asia-Pacific
- Middle East & Africa
- GCC
- South Africa
- Rest of Middle East & Africa
- South America
- Brazil
- Argentina
- Rest of South America
- North America
Data Sources, Market Sizing, and Validation
Desk Research
Desk work started with mapping the clinical and utilization backbone for chemotherapy-related neutropenia so that the model stays tied to real treatment pathways. Public sources such as the World Health Organization cancer burden datasets, U.S. National Cancer Institute publications, OECD health statistics, and peer reviewed articles indexed on PubMed Central were used to understand chemotherapy use patterns, febrile neutropenia risk thresholds, and guideline based prophylaxis triggers.
Next, the commercialization view was built using sources such as company annual reports and investor presentations, official product labels and safety updates from regulators (for example, FDA and EMA public pages), and reputable medical society guidance that affects growth factor adoption. Where it helped fill gaps on pricing bands, patent timing, and launch sequencing, we also referenced standard paid subscriptions for company financials, patent lookups, and a shipment level trade view for selected markets. These sources are illustrative only, and many other public materials were also checked for data collection, validation, and clarification.
Primary Interviews and Surveys
Primary work was done through expert interviews and short surveys with oncologists, hospital pharmacists, specialty distributors, and senior commercial roles who track supportive care demand. Because this is a global market, inputs were validated across major treatment settings in the Americas, EMEA, and APAC, then used to confirm therapy mix, average course per cycle behavior, and realistic price erosion for biosimilar exposed products.
Distribution of primary research fieldwork respondents
| Company type | Respondent position | Region |
|---|---|---|
| Top tier: 34% | CXOs: 17% | APAC: 40% |
| Mid tier: 47% | Functional/Unit leaders: 25% | EMEA: 33% |
| Smaller Players: 19% | Managers: 58% | Americas: 27% |
Market-Sizing & Forecasting
Sizing used a top-down and bottom-up approach, where the demand pool was first reconstructed from chemotherapy exposure and febrile neutropenia risk based prophylaxis eligibility, and then translated into therapy volumes and value. At the country level, we used practical inputs such as cancer incidence by major tumor groups, estimated share of patients receiving myelosuppressive regimens, guideline driven G-CSF use rates at the 20% febrile neutropenia risk threshold, average number of chemotherapy cycles per patient, and typical dosing patterns (daily versus long acting per cycle).
Once the demand pool was formed, pricing was applied using regional list price references and net price directionality gathered from interviews, and then adjusted for biosimilar penetration and tender driven discounts where those are common. Results were corroborated with selective bottom-up checks, including supplier and channel feedback on unit movement trends and sampled average selling price by pack type, and gaps were handled by using proxy markets with similar treatment protocols before being re-validated with local experts.
For forecasting, scenario analysis was used because uptake is sensitive to switching between originators and biosimilars, payer controls, and chemotherapy mix changes by tumor type. Assumptions for adoption and pricing were pressure tested in interviews, and the final curve was kept consistent with observable signals such as regulatory approvals, expanding indications, and expected price compression timing.
Data Validation & Update Cycle
Outputs were cross checked at several steps so that one unusual assumption does not drive the final total. We compared country results against independent signals such as chemotherapy volumes, supportive care utilization norms, and known product availability by region, and then investigated outliers before the model was signed off.
A second analyst review was done to re-check formulas, unit conversions, and currency handling, followed by a final consistency pass across regions so that the global roll up matches the sum of parts. The report is refreshed annually, and interim updates are triggered when there are material events such as major approvals, safety label changes, reimbursement shifts, or sudden price moves. Before delivery, we run a fresh update pass so clients receive the latest view based on the most recent public and interview inputs.
Mordor Intelligence's Global Chemotherapy Induced Neutropenia Market Size Versus Other Published Estimates
Published market values for chemotherapy-induced neutropenia often vary because the same condition can be sized through different treatment baskets, different years, and different ways of handling biosimilar pricing.
The main gap comes from whether antibiotic therapy and granulocyte transfusion are counted inside the condition spend, where Mordor Intelligence includes these alongside G-CSF therapy only when they are used for chemotherapy-induced neutropenia management, and then keeps pricing and utilization aligned to the 2026 to 2031 clinical use outlook.
Benchmark comparison
| Source | Market Size | Gaps in Research Methodology |
|---|---|---|
| Mordor Intelligence | USD 674.31 M (2026) | |
| Trade Publisher A | USD 606.00 M (2024) | Uses a narrower product lens centered on recombinant human G-CSF and pegylated forms, and the earlier base year can understate later cycle coverage and pricing resets as biosimilars expand. |
| Global Consultancy B | USD 600.50 M (2025) | Applies a longer range forecast with broader therapy wording, yet regional utilization and net price logic are not clearly tied to cycle level dosing and switching behavior, which can compress the near term market value. |
The spread in values is largely explained by what gets counted inside the condition spend and how price erosion is carried through the forecast window. By linking volumes to chemotherapy cycles and then applying interview tested adoption and pricing assumptions, the estimate stays traceable to a defined treated population and repeatable steps.
Key Questions Answered in the Report
What is the current value of the Chemotherapy-Induced Neutropenia market?
The market is valued at USD 674.31 million in 2026, with a projected CAGR of 3.54% to 2031.
Which therapy type holds the largest market share?
Granulocyte colony-stimulating factor therapy led with 63.78% share of 2025 revenues.
Why are biosimilars important in this market?
Pegfilgrastim biosimilars reduced average selling prices by over 40% and achieved 81% penetration five years after launch, making prophylaxis more accessible.
Which region is growing fastest?
Asia-Pacific is expanding at a 4.70% CAGR between 2026 and 2031, driven by regulatory approvals and greater chemotherapy adoption.
How are outpatient care models influencing demand?
A shift to ambulatory and home-based oncology services boosts use of long-acting injectors and online pharmacies, expanding patient reach.
What technological trends are emerging?
Predictive analytics with up to 97% accuracy and remote white-blood-cell monitoring devices are enhancing personalized prophylaxis and adherence.