
Market Overview
| Study Period | 2020 - 2031 |
|---|---|
| Market Size (2026) | USD 28.86 Billion |
| Market Size (2031) | USD 38.36 Billion |
| Growth Rate (2026 - 2031) | 5.86 % |
| Fastest Growing Market | Asia-Pacific |
| Largest Market | North America |
| Market Concentration | Low |
Major Players *Disclaimer: Major Players sorted in no particular order Image © Mordor Intelligence. Reuse requires attribution under CC BY 4.0. | |
Chemical Sensors Market Analysis by Mordor Intelligence
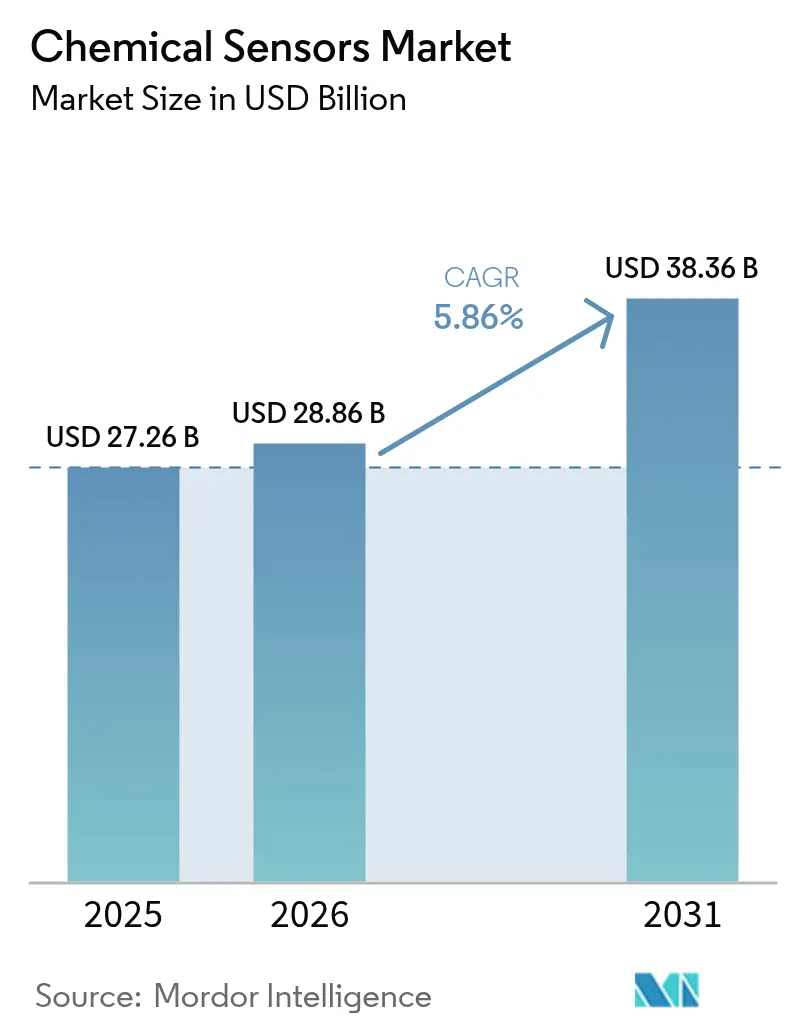
The chemical sensors market size in 2026 is estimated at USD 28.86 billion, growing from 2025 value of USD 27.26 billion with 2031 projections showing USD 38.36 billion, growing at 5.86% CAGR over 2026-2031. Sweeping air-quality laws, miniaturized biosensing in point-of-care devices, and hydrogen safety regulations are raising global demand. Electrochemical platforms still dominate toxic-gas detection because they achieve parts-per-million accuracy at low power draw. Optical architectures, particularly non-dispersive infrared carbon dioxide monitors, are gaining traction as replacements for catalytic beads in confined spaces. Investment in automated refineries and battery gigafactories continues to favor multi-sensor modules that combine combustible, oxygen, and toxic gas channels on a single board. Meanwhile, printed and flexible sensors are transitioning from pilot-scale to high-volume roll-to-roll lines, bringing sub-USD1 wireless tags within reach for food-safety and athletic-performance markets.
Key Report Takeaways
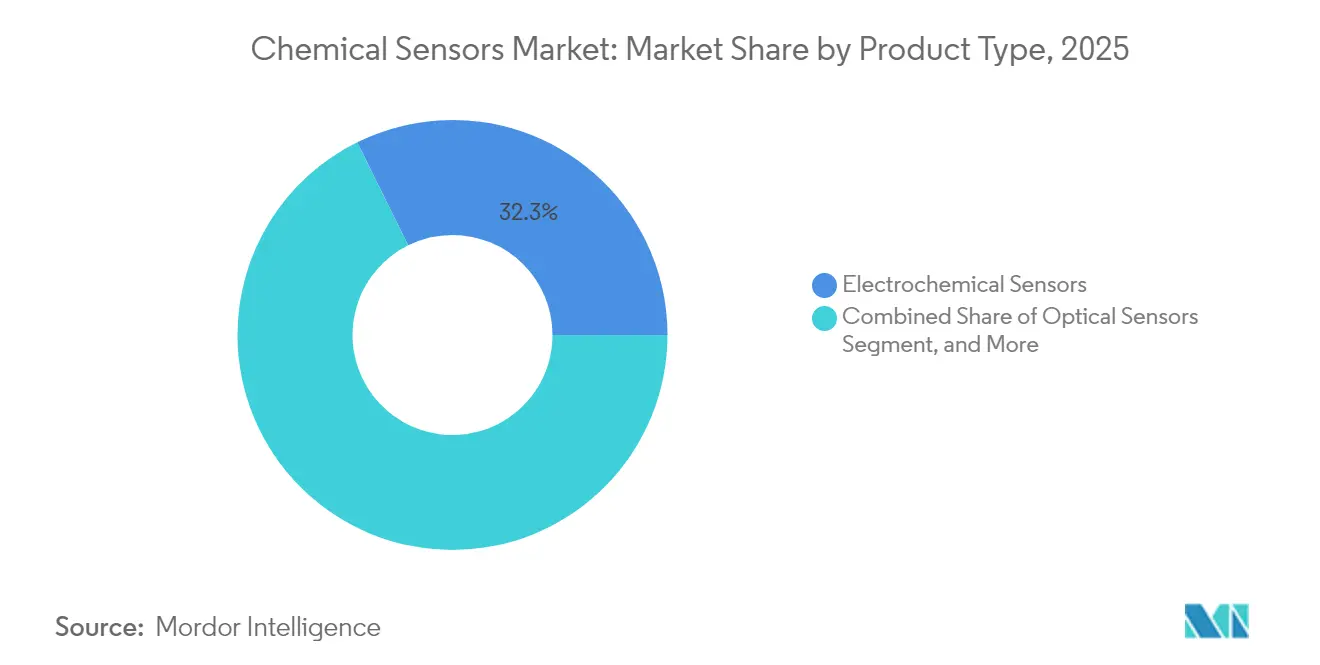
- By product type, electrochemical sensors led with a 32.31% share of the chemical sensors market in 2025, while optical sensors are expected to advance at a 6.98% CAGR to 2031.
- By technology, MEMS-based sensors led with a 27.02% share of the chemical sensors market in 2025, while printed/flexible sensors are expected to advance at a 6.86% CAGR to 2031.
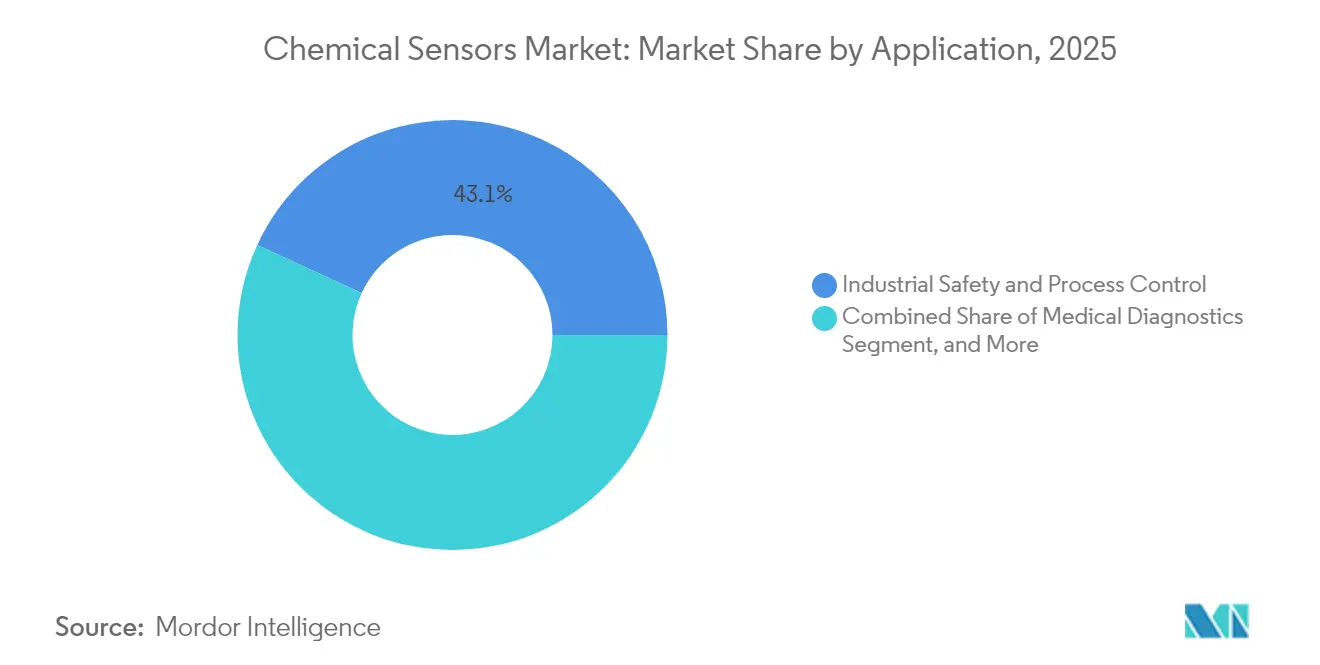
- By application, industrial safety and process control accounted for a 43.12% share of the chemical sensors market in 2025, and medical diagnostics is expected to expand at a 7.12% CAGR through 2031.
- By analyte phase, gas phase accounted for 61.44% share of the chemical sensors market in 2025, and liquid-phase sensing is projected to grow at a 6.63% CAGR between 2026 and 2031.
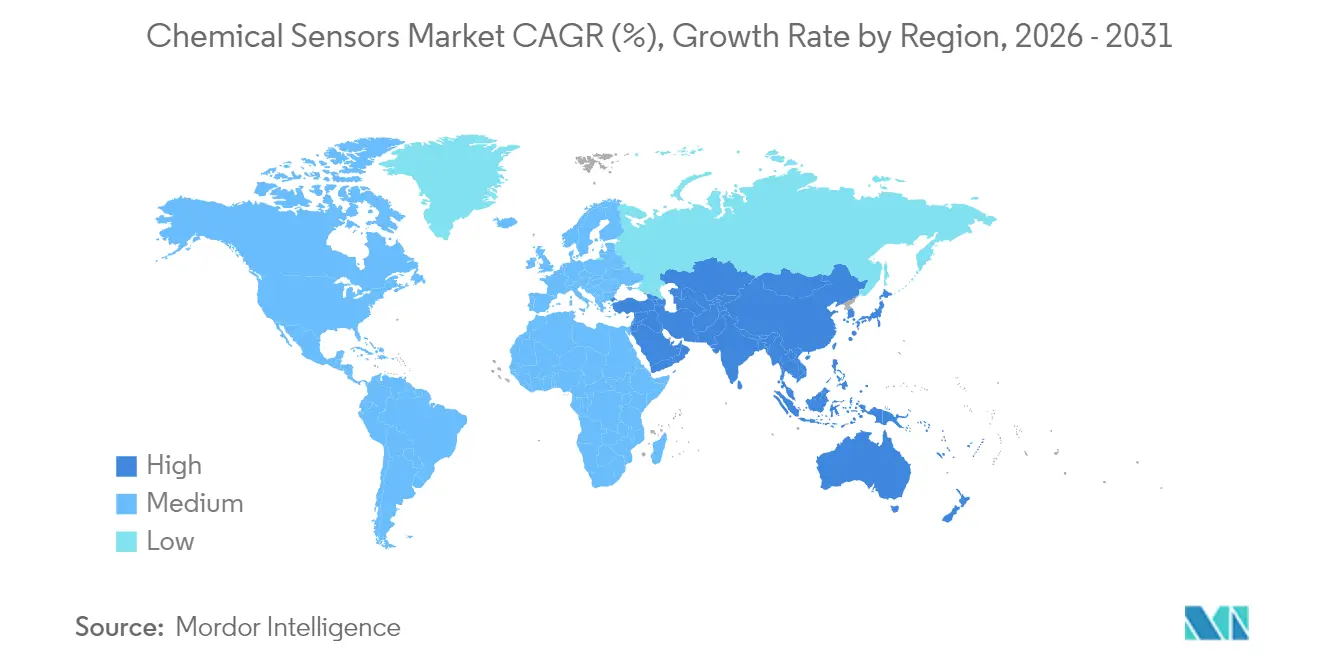
- By geography, North America held 46.55% share of the chemical sensors market in 2025, while the Asia-Pacific region is forecast to log the fastest CAGR of 6.88% from 2026 to 2031.
Note: Market size and forecast figures in this report are generated using Mordor Intelligence’s proprietary estimation framework, updated with the latest available data and insights as of 2026.
Global Chemical Sensors Market Trends and Insights
Drivers Impact Analysis*
| Driver | (~) % Impact on CAGR Forecast | Geographic Relevance | Impact Timeline |
|---|---|---|---|
| Stringent Environmental Regulations Driving Demand For Industrial Gas Detection | +1.8% | Global, with early enforcement in EU and North America | Medium term (2-4 years) |
| Growing Adoption Of Miniaturized Electrochemical Sensors In Medical Diagnostics | +1.5% | North America, Europe, and urban Asia-Pacific | Short term (≤ 2 years) |
| Expansion Of Industrial Automation And Process Safety Systems | +1.2% | Global, concentrated in manufacturing hubs across Asia-Pacific and North America | Medium term (2-4 years) |
| Emergence Of Flexible Printed Chemical Sensors For Disposable IoT Devices | +0.9% | North America, Europe, and Japan | Long term (≥ 4 years) |
| Integration Of Chemical Sensors Into Hydrogen Infrastructure Safety Systems | +0.7% | Europe, Japan, South Korea, and select North American corridors | Long term (≥ 4 years) |
| Rapid Proliferation Of Indoor Air Quality Mandates In Commercial Real Estate | +0.6% | North America, Europe, and urban centers in China and India | Short term (≤ 2 years) |
| Source: Mordor Intelligence | |||
Stringent Environmental Regulations Driving Demand For Industrial Gas Detection
Revisions to the U.S. National Ambient Air Quality Standards in 2024 lowered the annual PM2.5 limit, obliging facilities to install multi-gas monitors that stream electrochemical sulfur-dioxide and nitrogen-dioxide data in real time.[1] The European Union amended its Industrial Emissions Directive the same year, forcing chemical plants over 100 tonnes throughput to publish near-continuous volatile-organic-compound readouts. China expanded its ambient network to 1,800 stations by mid-2025 and each site runs ozone, carbon-monoxide, and nitrogen-oxides cells that collectively created a USD 400 million procurement pool. India’s Central Pollution Control Board mandated Source Emission Monitoring Systems for thermal plants, which spurred a 31% YoY spike in sensor shipments during early 2025. Refineries swapping catalytic-bead elements for infrared heads have cut false alarms by 40% and doubled calibration intervals, reinforcing this regulatory tailwind.
Growing Adoption Of Miniaturized Electrochemical Sensors In Medical Diagnostics
The U.S. FDA cleared seven new point-of-care electrochemical platforms in 2024 that shrink form factors under 15 mm, opening hospital and at-home use cases. Abbott’s FreeStyle Libre posted USD 5.3 billion revenue in 2024, up 21% YoY, underscoring reimbursement-led diffusion of amperometric glucose oxidase stacks. Sensirion introduced a 10 mm-square carbon-dioxide cell in March 2025 that fits ventilator circuits at one-third the cost of infrared alternatives. Europe’s In Vitro Diagnostic Regulation tightened detection-limit rules in May 2024, prompting nanostructured electrodes that drop lactate thresholds below 1 µM.[2] Screen-printed sweat-lactate patches launched for endurance athletes in 2024 and already measure 2-25 mM ranges on the fly.
Expansion Of Industrial Automation And Process Safety Systems
Siemens logged EUR 9.2 billion (USD 10.4 billion) in process-automation orders during fiscal 2024 as factories inserted gas-detection nodes into distributed-control networks. Honeywell earmarked USD 300 million for a Mexicali expansion in January 2025 aimed at hydrogen-fluoride and silane monitoring for gigafactories. ISA published a 2024 technical report that sets safety-integrity levels for hydrogen stations, requiring dual electrochemical sensors with sub-10-second response.[3] Yokogawa added AI-driven drift analytics to its CENTUM VP platform in 2024, cutting unscheduled downtime at LNG terminals by 25%. OSHA’s proposed confined-space rule will replace single-gas units with four-gas ensembles across utilities and construction sites.
Emergence Of Flexible Printed Chemical Sensors For Disposable IoT Devices
MIT researchers demonstrated sub-USD 0.10 printed ammonia films in 2024 that pave the way for single-use soil probes and cold-chain labels. PARC licensed its printed volatile-organic-compound patents to consumer-electronics OEMs, bringing USD 2-sensors into smart thermostats. The U.S. Department of Defense funded stretchable nerve-agent patches for uniforms, demanding detection in under 15 seconds. Thin Film Electronics shipped 2.3 million near-field tags with integrated ammonia sensors for protein spoilage testing, a 140% YoY leap. ISO published durability test rules that require printed devices to survive 10,000 bends, accelerating wearables commercialization.
Restraints Impact Analysis*
| Restraint | (~) % Impact on CAGR Forecast | Geographic Relevance | Impact Timeline |
|---|---|---|---|
| Calibration And Maintenance Costs Limit Adoption In Cost-Sensitive Industries | -0.8% | Global, particularly acute in South America, Africa, and Southeast Asia | Short term (≤ 2 years) |
| Sensor Drift And Limited Lifespan Affect Long-Term Reliability | -0.6% | Global, with heightened impact in harsh industrial environments | Medium term (2-4 years) |
| Supply Chain Bottlenecks For Specialty Electrochemical Catalysts | -0.4% | Global, concentrated in platinum-group metal sourcing | Short term (≤ 2 years) |
| Data Governance Concerns Slowing Deployment Of Cloud-Connected Sensors | -0.3% | Europe, North America, and regulated sectors globally | Medium term (2-4 years) |
| Source: Mordor Intelligence | |||
Calibration And Maintenance Costs Limit Adoption In Cost-Sensitive Industries
Field calibration every 90-180 days costs USD 150-300 per instrument and quickly eclipses hardware outlays over a five-year run. A 2024 survey of 340 food processors pegged annual upkeep at USD 18,000 per site, 2.8 times capex, discouraging broader coverage. Warehousing operators running net margins below 5% favor handheld spot checks over continuous monitors because service contracts strain budgets. NFPA eased residential carbon-monoxide detector intervals to seven-year cycles in 2025, but industrial units remain on quarterly schedules, cementing this cost divide.
Sensor Drift And Limited Lifespan Affect Long-Term Reliability
Electrochemical oxygen cells drift 0.3% per month at room temperature but quadruple under 40 °C humidity, forcing replacement within three years. A Singapore HVAC study found 18% of 1,200 metal-oxide units wandered out of spec in 18 months, triggering costly false alarms. Honeywell reported field hydrogen-sulfide sensors saw service life shorten from 36 to 22 months when exposed to >50 ppm spikes. IEC’s 2024 accelerated-aging rule now requires <15% signal loss after 1,000 hours at double concentration, raising the R&D bar for next-gen electrodes.
*Our forecasts treat driver/restraint impacts as directional, not additive. The impact forecasts reflect baseline growth, mix effects, and variable interactions.
Segment Analysis
By Product Type: Electrochemical Platforms Anchor Safety While Optical Architectures Gain Share
Electrochemical cells captured 32.31% of 2025 revenue and remain the preferred route for hydrogen-sulfide, carbon-monoxide, and nitrogen-dioxide alarms in refineries and wastewater plants. Optical devices are expanding at a 6.98% CAGR through 2031 as operators migrate toward non-dispersive infrared heads that extend maintenance intervals beyond 24 months.
Catalytic-bead sensors, once a staple for combustible gas, are slipping below 17.60% share because intrinsic-safety rules encourage ignition-free optics. Semiconductor metal-oxide devices, now 21.70% of demand, dominate budget indoor-air applications where sub-USD 5 price points matter. Infrared spectroscopy upgrades in natural-gas pipeline inspection push parts-per-billion methane detection and are a key reason optical traction is accelerating. U.S. methane-reduction incentives add a USD 280 million annual pull for these modules. Electrochemical single-gas badges still rule personal protective gear because electrolyte depletion drives repeat sales and predictable replacement cycles, keeping the chemical sensors market robust in consumables revenue.

By Technology: MEMS Integration Trims Cost While Printed Sensors Target Disposables
MEMS variants delivered 27.02% of 2025 revenue by slipping sensing elements and mixed-signal ASICs onto 5 mm silicon dies. Wafer-level packaging slashes assembly overhead and has pulled retail air-quality monitors under USD 50. Printed and flexible formats are logging a 6.86% CAGR as roll-to-roll gravure drops unit cost to USD 0.10 for single-use biosensing strips, opening new frontiers in athletics and decentralized medicine.
CMOS-integrated units, currently 18.70% share, add on-chip calibration that pares bill-of-materials by 30%. Infrared blocks represent about 20.80% of demand, serving HVAC, incubators, and greenhouses where optical lifetime exceeds a decade. Surface-acoustic-wave lines, roughly 12.80% share, stay in niche defense roles for chemical warfare agent alerts, but standardization work on shock and vibration tests is making them more attractive in transport safety. ISO 27891 now requires MEMS gas chips to survive 1,500 g shock with no drift, a hurdle most mainline suppliers have cleared, shoring up confidence in automotive and industrial buyers.
By Application: Industrial Safety Leads While Medical Diagnostics Posts Fastest Expansion
Industrial safety and process control generated 43.12% of 2025 revenue thanks to mandatory multi-gas arrays in confined spaces and continuous emission systems on petrochemical stacks. Medical diagnostics is registering the fastest 7.12% CAGR as payers expand coverage for continuous glucose monitoring and emergency departments adopt point-of-care lactate cards.
Environmental monitoring contributes 15.80% by value through city air-quality grids and water-utility discharge testing. Automotive exhaust and cabin air modules, about 11.70% share, march toward real-time nitrogen-oxides reporting to meet Euro 7 and China 7 rules. Oil and gas upstream and refining uses, now 10.80% of turnover, rely on waterproof electrochemical hydrogen-sulfide cells at wellheads and flare stacks to keep OSHA exposure within 10 ppm. Defense contracts, 5.90% share, focus on trace explosives and warfare agents, reinforcing demand for high-sensitivity surface-acoustic-wave and colorimetric papers. The transition toward value-based healthcare makes remote metabolic monitoring a reimbursable necessity, sustaining double-digit biosensor shipments.
By Analyte Phase: Gas Detection Dominates Revenue While Liquid Sensing Gains From Water Quality Mandates
Gas detection holds 61.44% of 2025 sales, underpinned by industrial-safety badges, ambient air stations, and hydrogen infrastructure diagnostics. Liquid-phase probes are growing at 6.63% CAGR because utilities must track lead, nitrate, and phosphate at tighter thresholds after the 2024 U.S. drinking-water rule update.
Solid-phase sensing, 7.90% share, remains the tool of analytical labs checking soil contamination or tablet dissolution. New hydrogen codes stipulate electrochemical or catalytic detection at 1,000 ppm within one second, intensifying gas-cell R&D. The European Drinking Water Directive inserted per- and polyfluoroalkyl substances at nanogram levels, fueling aptamer-based electrochemical innovations. Aquaculture pilots show dissolved-oxygen and ammonia telemetry cuts fish mortality by up to 18%, indicating another vector for liquid-phase upside in the chemical sensors market.
Geography Analysis
North America generated 46.55% of 2025 revenue, a lead built on strict OSHA confined-space laws and Medicare expansion that added 3.2 million glucose-monitoring beneficiaries. The 2024 PM2.5 standard drove a USD 340 million sensor retrofit wave, and Canada earmarked CAD 180 million (USD 133 million) to extend ozone and particulate networks into remote communities.
Europe contributed 27.98% of sales; its shift to Euro 7 exhaust norms mandates ±10% accuracy across -40-85 °C, generating steady orders for electrochemical and solid-state stacks. Germany carved EUR 500 million (USD 565 million) for hydrogen stations that each need redundant sub-second detectors, while the United Kingdom cut the formaldehyde limit to 0.3 ppm, spurring upgrades across laboratories.
Asia-Pacific is projected to outpace all regions at a 6.88% CAGR through 2031. China’s 1,800-node air network and factory VOC rules, India’s Source Emission Monitoring rollout, and Japan’s hydrogen-fuel road map combine to unlock multi-billion-dollar tenders. South Korea’s semiconductor VOC law adds another USD 85 million annual pull. Middle East and Africa and South America remain smaller slices but are moving toward national gas-pipeline safety laws that hinge on infrared methane trackers, creating long-tail opportunities for local integrators.
Regulatory Landscape
Environmental and chemical-safety regimes are tightening measurement, reporting, and materials-compliance requirements that feed into chemical sensor specifications and deployment volumes. In the United States, the EPA advanced Toxic Substances Control Act activity with proposed Significant New Use Rules (SNURs) published in June 2026 for certain chemical substances, which reinforces the need for manufacturers to track substance restrictions and manage compliance for materials used in sensing elements, packaging, and adhesives.
In Europe, the CLP framework was amended via Regulation (EU) 2024/2865 (adopted in October 2024), adding new notification requirements for hazardous mixtures to the European Chemicals Agency (ECHA), while REACH continues to evolve through periodic updates and restriction road-mapping discussed in 2026 through the European Commission expert process. Post-Brexit, the United Kingdom updated its GB classification and labelling framework through the Chemicals (Health and Safety) (Amendment, Consequential and Transitional Provision) Regulations 2026, raising the compliance burden for suppliers serving both EU and Great Britain. Standards bodies are also updating generic specifications relevant to chemical sensing components, such as IEC 61757:2026 for fiber optic sensors, which can shift procurement criteria in regulated industrial and infrastructure settings.
Value Chain Analysis
The chemical sensors value chain spans specialty materials and microfabrication through module assembly, calibration, and software integration. Upstream inputs include noble-metal and catalyst systems for electrochemical cells, functional materials for semiconductor and printed devices, and optics and emitters for NDIR/infrared architectures, followed by MEMS/CMOS fabrication and packaging, board-level integration, and enclosure design to meet intrinsic-safety and environmental durability needs. Midstream, module makers increasingly bundle multiple sensing channels plus signal conditioning and digital interfaces, then deliver through industrial automation distributors and OEM channels into safety, process-control, HVAC, medical, and environmental monitoring systems.
Downstream value is increasingly captured in commissioning, calibration, and lifecycle services, where ownership cost and drift management remain bottlenecks for broad deployments in cost-sensitive sites. Product and integration activity in 2026 reflects movement toward more connected, maintainable instrumentation: Emerson launched the Rosemount 396A Anti-Coating pH Sensor with Modbus digital output for high-solids processes (May 2026), while IMI extended a global framework agreement with Solvay for ATEX Zone 1-rated IIoT sensors with thousands of units already installed across multiple countries (April 2026). These moves point to a shift from standalone sensing elements toward digitally integrated devices that plug into plant control, EAM/MES workflows, and predictive-maintenance programs.
Competitive Landscape
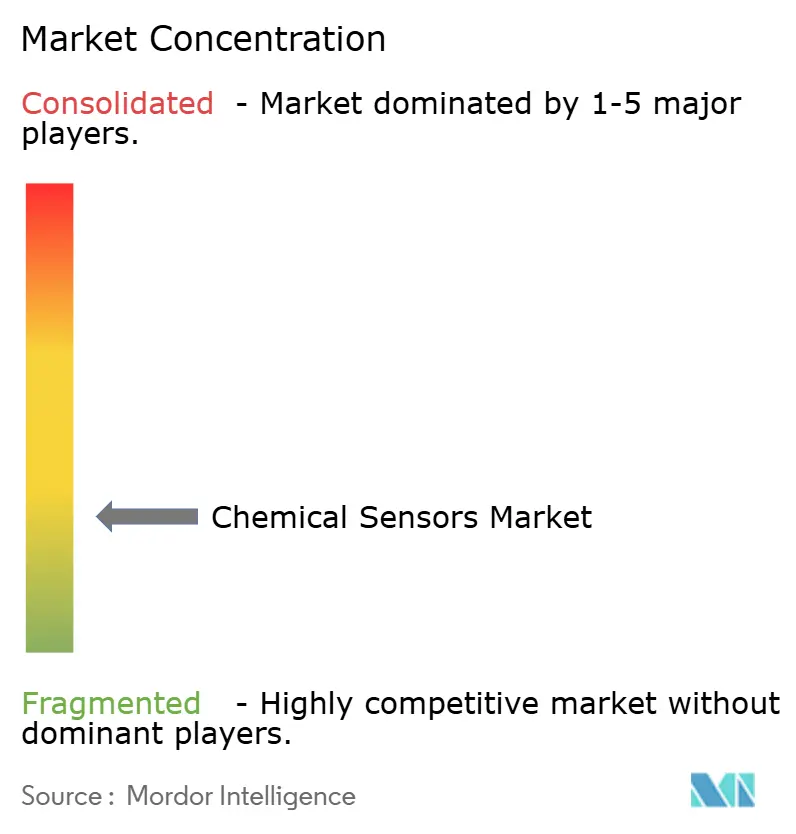
Most of 2024's revenue was attributed to the top five suppliers, confirming moderate fragmentation. Incumbents manage end-to-end verticals, including electrochemical cell winding, MEMS wafer runs, and infrared optics, which enables gross margins above 45%.
Honeywell’s USD 300 million Mexicali buildout will push volumes for gigafactory hydrogen-fluoride arrays, while Siemens folded Sensirion’s industrial gas line into its SIMATIC platform following a EUR 85 million (USD 96 million) deal. Software-led calibration is the new differentiator: AI drift compensation extends service intervals to 180 days and trims ownership cost for budget-sensitive warehouses. Alphasense filed 14 patents in 2024 on nanostructured electrodes that sharpen detection limits by an order of magnitude.
Cloud partnerships also rose; Sensirion added native hooks into AWS IoT Core and Azure IoT Hub so customers mine sensor fleets for predictive insights. Regulation acts as both a moat and a catalyst for firms with in-house IECEx and IVDR labs onboard, new analytes faster, yet niche specialists can win on turnaround speed for third-party test services. Overall, strategic emphasis is tilting toward hydrogen safety, indoor-air mandates, and medical biosensing.
Chemical Sensors Industry Leaders
-
Alphasense Limited
-
Figaro Engineering Inc.
-
Membrapor AG
-
Sensirion AG
-
Aeroqual Limited
- *Disclaimer: Major Players sorted in no particular order
Market Opportunities and Future Outlook
Regulatory-driven monitoring and standards-linked purchasing create visible whitespace for sensor makers that can combine compliance readiness with lower total cost of ownership. Indoor air quality and building-performance programs are translating standards into product requirements for CO2, VOC, NOx, and particulate sensing, supported by Sensirion's SCD43 CO2 sensor being positioned for alignment with named building frameworks (ANSI/ASHRAE 62.1-2022, California Title 24, RESET Grade B, and WELL v2). In industrial environments, calibration cost and frequency remain structural limiters, creating room for designs that extend service intervals through anti-fouling hardware, embedded diagnostics, and digital connectivity into plant systems.
Technology roadmaps are also expanding the addressable space beyond single-analyte nodes toward integrated, edge-intelligent arrays. In 2026 research demonstrations, large-scale sensor arrays integrating thousands of functionalized carbon-nanotube FET devices and silicon-compatible MEMS/FET gas sensor platforms show momentum toward on-chip "smart olfaction" concepts that merge sensing, computation, and data handling in compact form factors. Separately, printed and flexible approaches continue to target disposable and wearable sensing, where durability standards and bend-cycle requirements push suppliers toward industrializing materials stacks and process control, aligning with roll-to-roll manufacturing moving from pilot to higher-volume lines for low-cost tags and patches.
Recent Industry Developments
- July 2026: Sensirion announced global availability of the SEK-SGP4x evaluation kit for VOC and NOx sensor prototyping. Wider access to standardized evaluation hardware helps OEMs shorten design-in cycles for indoor air quality and ventilation controls and improves comparability across competing sensor options.
- December 2025: Industrial Scientific (Fortive) completed the acquisition of Aeroqual Limited. The deal broadened Industrial Scientific's reach from worker safety into real-time environmental monitoring and supports more unified deployments that link perimeter air monitoring with safety workflows.
- October 2024: The European Parliament and Council adopted Regulation (EU) 2024/2865 amending the CLP Regulation, introducing new hazardous-mixture notification requirements to the European Chemicals Agency. The update increases documentation and compliance expectations across chemical value chains, indirectly tightening requirements for sensor materials selection and labeling in regulated deployments.
Research Methodology Framework and Report Scope
Market Definition and Coverage
For this report, the chemical sensors market is defined as the revenue generated from sensors and sensing modules that detect and quantify chemical species in gas or liquid environments for monitoring, safety, quality, and diagnostic uses across industries worldwide.
Scope exclusions: We exclude laboratory analytical instruments and consumables that are not sold as chemical sensors (for example, full-scale chromatography systems and standalone reagents).
Segmentation Overview
- By Product Type
- Electrochemical Sensors
- Optical Sensors
- Pellistor/Catalytic Bead Sensors
- Semiconductor Sensors
- Other Product Type
- By Technology
- CMOS-Integrated Sensors
- MEMS-Based Sensors
- NDIR and Infrared Sensors
- SAW and Acoustic Sensors
- Printed/Flexible Sensors
- By Application
- Industrial Safety and Process Control
- Environmental Monitoring
- Medical Diagnostics
- Automotive Emissions and Cabin Air
- Oil and Gas Exploration and Refining
- Homeland Security and Defense
- Other Application
- By Analyte Phase
- Gas Phase
- Liquid Phase
- Solid Phase
- By Geography
- North America
- United States
- Canada
- Mexico
- Europe
- Germany
- United Kingdom
- France
- Italy
- Rest of Europe
- Asia-Pacific
- China
- Japan
- India
- South Korea
- Australia
- Rest of Asia-Pacific
- Middle East and Africa
- Middle East
- Saudi Arabia
- United Arab Emirates
- Rest of Middle East
- Africa
- South Africa
- Egypt
- Rest of Africa
- Middle East
- South America
- Brazil
- Argentina
- Rest of South America
- North America
Data Sources, Market Sizing, and Validation
Desk Research
Desk work starts by mapping the demand signals that usually pull chemical sensors into projects, and then checking how those signals have moved by region over time. We rely on public sources such as environmental and workplace safety regulations from agencies like the US EPA and OSHA, global guidance from the WHO, and standards and test methods published through bodies like ISO and IEC, since these often spell out adoption triggers.
We also review trade and production indicators where they help explain supply availability and pricing pressure. This includes UN Comtrade-style customs statistics, patent databases for sensing materials and microfabrication trends, and peer-reviewed journals that discuss drift, calibration cycles, and sensor lifetime. Annual reports, investor presentations, and press releases are used to translate technology shifts into realistic commercial rollouts, and we sometimes cross-check company financial and news databases plus patent databases for consistency. These desk sources are illustrative only, and many other public references were also consulted to collect data, validate assumptions, and clarify gaps.
Primary Interviews and Surveys
Primary work focuses on validating what chemical sensors actually ship into, and how pricing changes when products move from single sensors to packaged modules. We speak with a mix of manufacturers, integrators, distributors, and end users across APAC, EMEA, and the Americas to confirm demand drivers like compliance upgrades, plant expansions, and health monitoring adoption, and then we use that input to tighten assumptions that were unclear in desk research.
Distribution of primary research fieldwork respondents
| Company type | Respondent position | Region |
|---|---|---|
| Top tier: 36% | CXOs: 12% | APAC: 39% |
| Mid tier: 42% | Functional/Unit leaders: 43% | EMEA: 37% |
| Smaller Players: 22% | Managers: 45% | Americas: 24% |
Market-Sizing & Forecasting
The sizing model is built by reconstructing the addressable demand pool from end-use adoption and compliance driven need, and then translating that into value using typical sensor counts per system and observed pricing bands. A top-down approach is applied first by linking safety and environmental monitoring activity to deployment intensity, which is then corroborated with selective bottom-up checks like sampled average selling price (ASP) times estimated unit volumes for key use cases and channel feedback.
Inputs that matter in this market include the pace of air-quality and industrial safety enforcement, adoption of point-of-care and wearable diagnostics that embed chemical sensing, hydrogen and gas leak detection rollout, replacement cycles tied to calibration drift, and the shift from single-point sensing to multi-sensor modules. Where direct unit indicators are missing, we fill gaps using proxy variables agreed in interviews, such as installed base growth, project tender activity, and typical spares ratios.
For forecasting, scenario analysis is used so growth can flex with regulation timing, industrial capex cycles, and cost-down trends in miniaturization. The scenarios are anchored to expert views on ASP progression and mix change, and then checked for realism against historical growth patterns and the same demand indicators used in the base year.
Data Validation & Update Cycle
Results are validated through cross-checks between independent signals, where unexpected jumps are investigated before the numbers are finalized. We review outputs by region and by major use case to spot inconsistent ASP or adoption rates, and then re-contact sources when a variance cannot be explained by a clear driver.
Before sign-off, the model is reviewed in more than one step so assumptions, math, and the story align, and adjustments are documented for traceability. Reports are refreshed annually, with interim updates when material events occur, and a final pre-delivery pass is completed so clients receive the most current view.
Mordor Intelligence's Global Chemical Sensors Market Market Size Compared With Other Published Estimates
Published market values for chemical sensors often do not match because each estimate can start from a different base year, currency conversion point, and pricing path, which then changes the total even before forecasting begins. Differences also show up when one study counts modules and integrated systems differently than another, or when replacement demand is treated as a separate pool.
A refresh-led gap is common in this market because ASPs move with mix changes, including the shift toward multi-sensor packages and higher-spec safety deployments, and those price moves need to be re-checked against recent procurement behavior. By updating currency timing and ASP assumptions close to publication and re-validating outliers with follow-up calls, Mordor Intelligence keeps the 2026 value tied to what was being bought and deployed in the latest cycle.
Benchmark comparison
| Source | Market Size | Gaps in Research Methodology |
|---|---|---|
| Mordor Intelligence | USD 28.86 B (2026) | |
| Industry Data Publisher A | USD 34.58 B (2025) | This estimate uses an earlier base year and may bundle a wider set of sensor categories into one total, which can lift the value when module content and adjacent detection products are counted together. |
| Research Outlet B | USD 26.70 B (2024) | This figure is anchored to a prior-year base and appears to apply a flatter ASP pathway, which can understate value when the mix shifts toward higher-spec safety and monitoring deployments. |
The spread across sources is mainly explained by base-year selection, how ASP is progressed with module mix, and what exactly is included when a system contains multiple sensing elements. Using clear scope boundaries, repeatable demand indicators, and refreshed pricing inputs, the resulting market value stays easy to reconcile back to practical adoption and purchase behavior.
Key Questions Answered in the Report
What is the current Chemical Sensor Market size?
The Chemical Sensor Market size is USD 28.86 billion in 2026 and is projected to register a CAGR of 5.86% during the forecast period (2026-2031)
Who are the key players in Chemical Sensor Market?
Smiths Detection Inc., General Electric Co., MSA Safety Incorporated, Pepperl+Fuchs Group and Honeywell International Inc. are the major companies operating in the Chemical Sensor Market.
Which is the fastest growing region in Chemical Sensor Market?
Asia-Pacific is estimated to grow at the highest CAGR over the forecast period (2026-2031).
Which region has the biggest share in Chemical Sensor Market?
In 2025, the North America accounts for the largest market share in Chemical Sensor Market.
What years does this Chemical Sensor Market cover?
The report covers the Chemical Sensor Market historical market size for years: 2019, 2020, 2021, 2022, 2023, 2024 and 2025. The report also forecasts the Chemical Sensor Market size for years: 2026, 2027, 2028, 2029, 2030 and 2031.