
Market Overview
| Study Period | 2020 - 2031 |
|---|---|
| Market Size (2026) | USD 534.37 Billion |
| Market Size (2031) | USD 683.28 Billion |
| Growth Rate (2026 - 2031) | 5.04 % |
| Fastest Growing Market | Asia Pacific |
| Largest Market | Asia-Pacific |
| Market Concentration | Low |
Major Players *Disclaimer: Major Players sorted in no particular order Image © Mordor Intelligence. Reuse requires attribution under CC BY 4.0. | |
Chemical Logistics Market Analysis by Mordor Intelligence
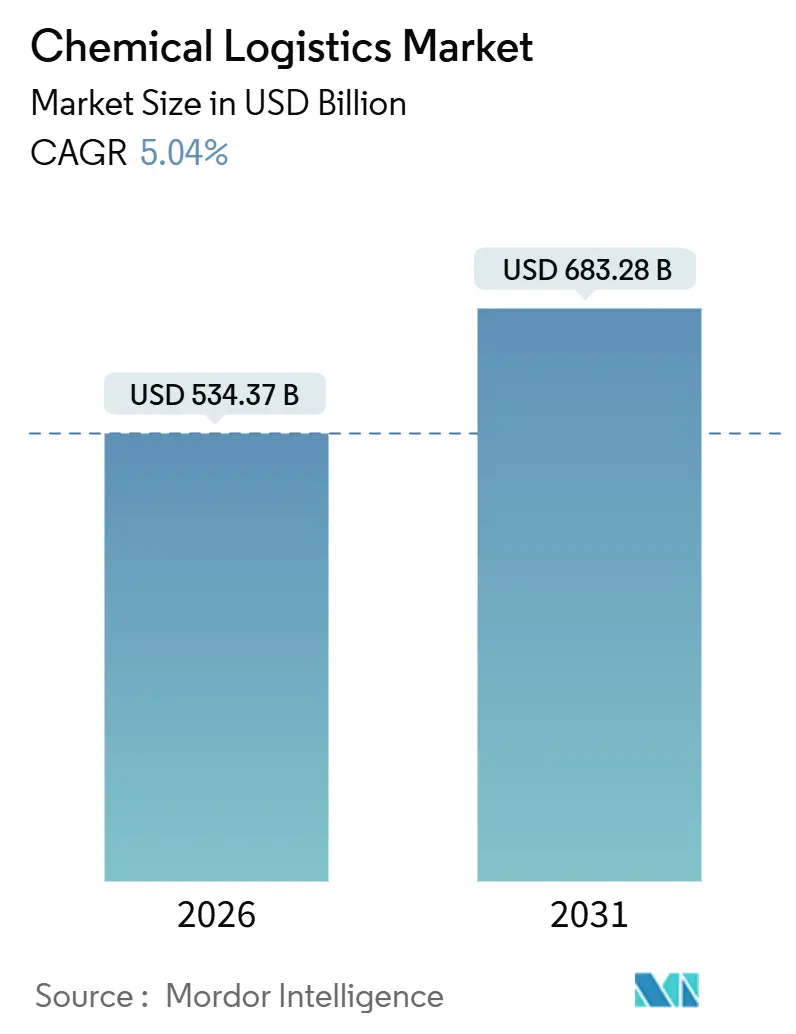
The Chemical Logistics Market size is estimated at USD 534.37 billion in 2026, and is expected to reach USD 683.28 billion by 2031, at a CAGR of 5.04% during the forecast period (2026-2031).
Digital-twin simulations, artificial-intelligence visibility systems, and low-carbon transport mandates are reshaping supply-chain orchestration, rewarding providers that blend compliance rigor with cost discipline. Asia-Pacific’s surging chemical output and widening consumption base are lengthening ton-mile demand even as production overcapacity prompts corridor diversification. Multimodal networks, especially rail-sea combinations, are delivering up to 81% emissions savings compared with road-only routes, creating a structural cost advantage for operators that master interface complexity. Tightened EU ADR and CLP rules, together with rising US hazmat fees, are accelerating consolidation as smaller fleets struggle to finance compliance infrastructure. Finally, premium growth is migrating to temperature-controlled and value-added services areas where specialized assets, telematics, and certified staff generate defensible margins.
Key Report Takeaways
- By service type, transportation held 65.14% of the chemical logistics market share in 2025, whereas Other Services are advancing at a 6.41% CAGR to 2031.
- By end-user, Oil & Gas commanded 30.57% of the chemical logistics market size in 2025, while Specialty Chemicals is projected to post a 6.72% CAGR through 2031.
- By hazard class, hazardous chemicals accounted for 75.04% of 2025 shipments, yet non-hazardous cargo is growing at a 5.64% CAGR to 2031.
- By temperature control, non-temperature-controlled flows captured 61.53% share in 2025, but temperature-controlled logistics is expanding at 7.25% CAGR to 2031.
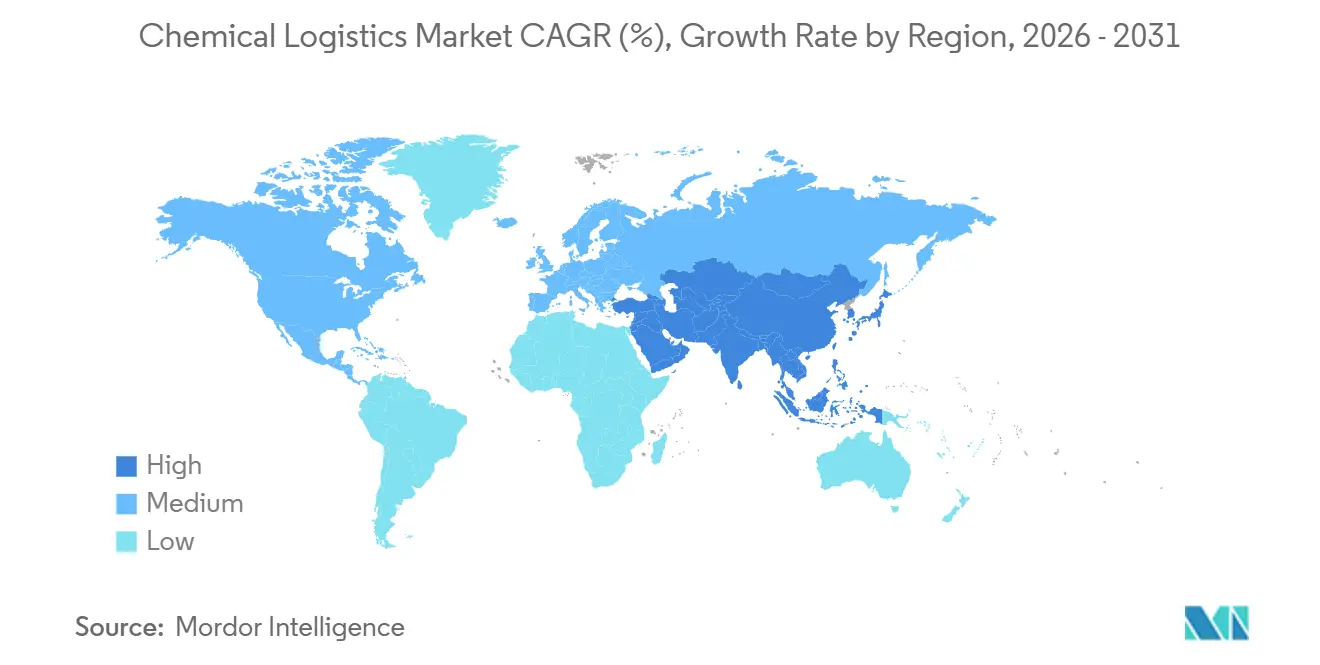
- By geography, Asia-Pacific led with 39.21% revenue share in 2025 and is expanding at a 6.31% CAGR through 2031.
Note: Market size and forecast figures in this report are generated using Mordor Intelligence’s proprietary estimation framework, updated with the latest available data and insights as of January 2026.
Market Trends and Insights
Drivers Impact Analysis of Chemical Logistics Market*
| Driver | (~) % Impact on CAGR Forecast | Geographic Relevance | Impact Timeline |
|---|---|---|---|
| Expansion of Asian chemical production | +1.3% | Asia-Pacific, Middle East, Europe | Medium term (2-4 years) |
| Multimodal networks for hazardous goods | +0.7% | Global | Long term (≥ 4 years) |
| Regulatory push for safer, greener assets | +0.9% | Europe, North America, Asia-Pacific | Short term (≤ 2 years) |
| Outsourcing to 3PL/4PL specialists | +0.8% | Global | Medium term (2-4 years) |
| Low-carbon methanol & bio chains | +0.5% | Europe, Asia-Pacific, Americas | Long term (≥ 4 years) |
| AI-driven visibility & digital twins | +0.6% | Global | Short term (≤ 2 years) |
| Source: Mordor Intelligence | |||
Expansion of Asian Chemical Production Boosting Long-haul Volumes
India’s PCPIR zones and mainland China’s capacity additions have shifted export lanes toward Europe and North America, lengthening voyage distances and raising ton-mile demand. At the regional level, the ASEAN chemical logistics market is also being shaped by expanding chemical production and intra-regional trade flows. Post-Red Sea routing changes have further extended typical Asia-Europe transits, supporting vessel-utilization and intermodal opportunities across rail-sea corridors. Government incentives in India are concentrating output in coastal clusters, yet inland consumption patterns are forcing longer domestic hauls that reward operators with integrated rail, road, and barge solutions.
Rising Use of Multimodal Networks for Hazardous Goods Cost & Safety
Sea-rail systems cut greenhouse-gas emissions by 81% and logistics costs by 70% versus road-only haulage, but adoption hinges on seamless regulatory alignment at modal junctions. The US Federal Railroad Administration highlights dual-mode locomotives and intermittent electrification as cost-effective for bulk chemical corridors when supported by utility partnerships. European operators such as Bertschi already avoid 300,000 tons of CO₂ annually through integrated terminals that synchronize rail, barge, and road legs[1].Bertschi Group, “Sustainability and Intermodal Transport,” bertschi.com
Regulatory Push for Safer, Greener Logistics Assets & Practices
The EU’s revised CLP Regulation activated digital labeling and refillable-packaging mandates in December 2024, compelling fleet owners to deploy track-and-trace and reusable-container pools. ADR 2025 tightens vehicle specifications and driver certifications, while US hazmat fees have risen to USD 3,000 per carrier, pushing compliance costs sharply higher. These converging rules favor incumbents with dedicated hazmat fleets and legal departments.
Outsourcing of Supply-chain Functions to 3PL/4PL Specialists
About 76% of chemical producers plan to boost third-party reliance as they reallocate internal capital toward R&D. DHL’s EUR 2 billion (USD 2.33 billion) health-logistics program is adding GDP-certified hubs and temperature-controlled fleets that single-plant producers cannot economically replicate. New 4PL models give shippers a single point of accountability while aggregating capacity across multiple carriers.
Restraints Impact Analysis of Chemical Logistics Market*
| Restraint | (~) % Impact on CAGR Forecast | Geographic Relevance | Impact Timeline |
|---|---|---|---|
| High capex & insurance requirements | -0.9% | Global | Medium term (2-4 years) |
| Fragmented multi-jurisdiction compliance | -0.6% | Global | Long term (≥ 4 years) |
| Fuel-price volatility | -0.8% | Global | Short term (≤ 2 years) |
| Shortage of certified hazmat drivers | -1.0% | Asia, Africa, Latin America | Medium term (2-4 years) |
| Source: Mordor Intelligence | |||
High Capex-heavy Asset & Insurance Requirements
Stainless-steel ISO tanks, temperature-controlled chassis, and explosion-proof warehouses cost 2-3 times more than general-cargo equivalents. Peacock Container’s USD 350 million sustainability-linked facility extension underlines the scale of capital required for fleet renewal[2]Peacock Container, “Sustainability-Linked Debt Facility Extension,” peacockcontainer.com. Insurance premiums now absorb up to 5% of revenue for dangerous-goods hauls, magnifying entry barriers.
Fragmented Multi-jurisdiction Compliance Burdens
Differences in hazard classification, labeling, and documentation across borders force operators to maintain parallel compliance protocols. The latest UN Model Regulations add sodium-ion battery rules that some states will not adopt until 2027, obligating mid-journey relabeling when cargo crosses early-adopter borders. African corridors are especially complex, with each member of the African Continental Free Trade Area retaining unique hazmat codes.
*Our forecasts treat driver/restraint impacts as directional, not additive. The impact forecasts reflect baseline growth, mix effects, and variable interactions.
Chemical Logistics Market Segment Analysis
By Service Type:
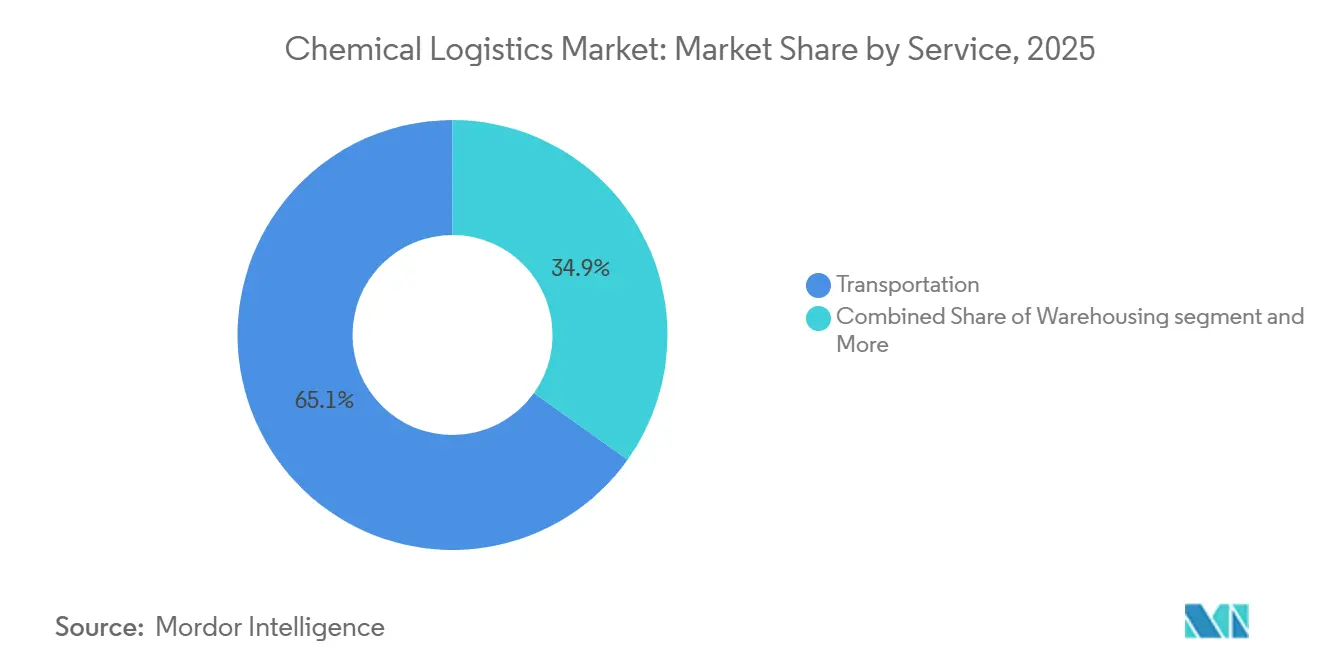
Integrated Solutions Lift ProfitabilityTransportation retained 65.14% of the chemical logistics market share in 2025 because physical movement remains unavoidable. Yet Other Services, covering blending, compliance management, and orchestration platforms, are forecast to grow at a 6.41% CAGR, reflecting shipper demand for one-stop solutions that reduce administrative burden. Value-added warehousing anchors working-capital programs by positioning inventory near consumption hubs, while digital platforms capture data exhaust that underpins predictive scheduling and emission reporting. DHL’s acquisition of CryoPDP added 600,000 temperature-sensitive shipments annually, demonstrating how tuck-ins can accelerate capability expansion.
Second-generation 4PL models monetize orchestration by bundling carrier procurement, control-tower analytics, and compliance documentation in subscription packages. As shippers embed these APIs into enterprise resource planning systems, switching costs rise, allowing logistics providers to defend margins even in commodity haulage. Consequently, the chemical logistics market is witnessing a migration of profit pools from tonnage toward information, risk management, and near-customer customization.


By End-User Industry:
Specialty Chemicals AccelerateOil & Gas held 30.57% of the chemical logistics market size in 2025 due to entrenched refinery-to-petrochemical flows, but its low growth exposes providers to price pressure. Specialty Chemicals is slated for a 6.72% CAGR as lithium-ion battery electrolytes and pharmaceutical intermediates demand precision handling, chain-of-custody records, and temperature-stable environments. Argonne National Laboratory projects battery-grade electrolyte output to exceed 1,300 GWh by 2030, multiplying demand for moisture-controlled tank containers.
Pharmaceutical and cosmetics traffic supplies revenue stability because GDP or GMP protocols mandate certified storage and tracked transportation, giving compliant carriers pricing power. Cosmetics raw-materials shifts toward botanical extracts create small-lot, high-frequency lanes that are unsuitable for bulk tanker fleets but ideal for ISO tank relocation and regional depot networks. Thus, the chemical logistics market faces bifurcated growth where low-margin commodity flows coexist with high-service specialty niches requiring differentiated expertise[3]Argonne National Laboratory, “Lithium-Ion Battery Production and Supply Chain Analysis,” anl.gov .
By Hazard Class:
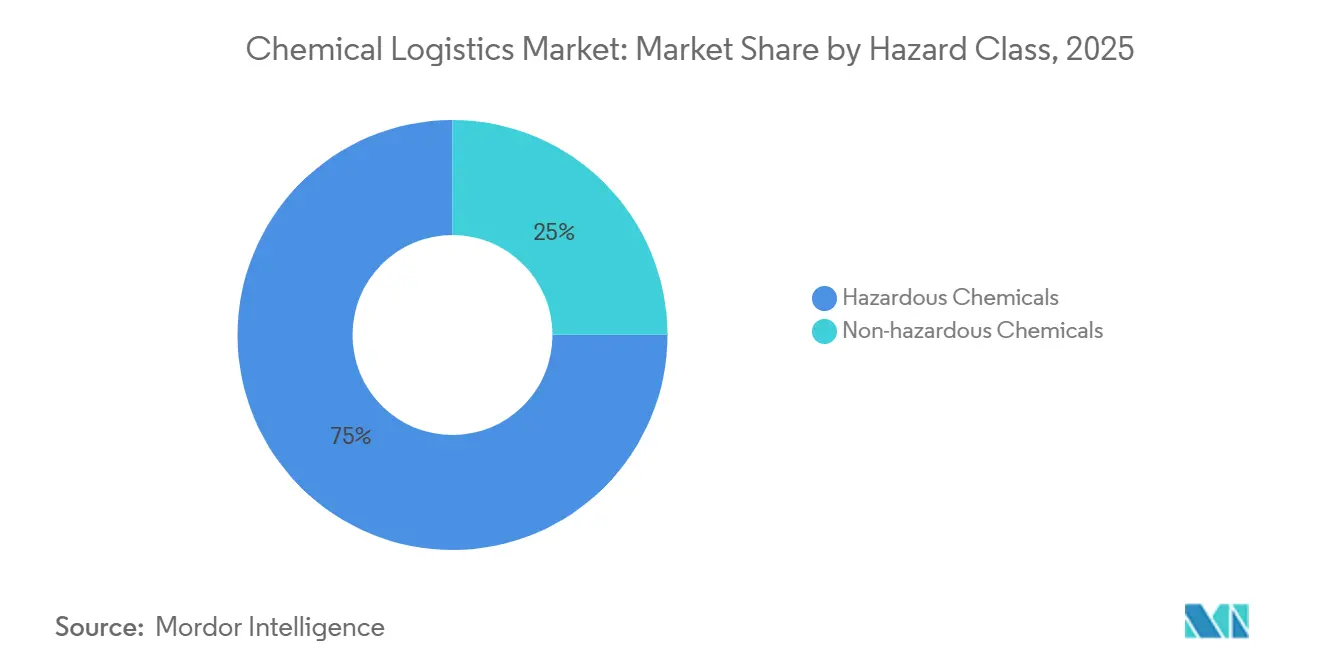
Compliance Costs Define Competitive MoatsHazardous cargo comprised 75.04% of 2025 shipments, anchoring premium rate structures that offset elevated insurance and asset costs. Non-hazardous shipments, growing at a 5.64% CAGR, are benefiting from green-chemistry reformulations that downgrade hazard classes, reducing documentation and equipment requirements. PHMSA lifted hazmat registration to USD 3,000 and civil penalties of over USD 100,000 per day, creating existential risks for non-compliant operators.
Leading fleets exploit these barriers by embedding compliance software that automates MSDS retrieval, label printing, and cross-regulation validation, cutting administrative lead times. However, general-freight entrants are targeting non-hazardous volumes through price competition, pushing incumbents to defend share via service reliability and digital transparency. This divide is steering the chemical logistics market toward dual-track competition where expertise trumps scale in hazmat, whereas cost leadership matters more in benign categories.
By Temperature Control:
Cold Chain Outpaces BulkAlthough non-temperature-controlled loads still make up 61.53% of volume, the temperature-controlled segment is expanding at a 7.25% CAGR, outstripping every other slice of the chemical logistics market. IoT devices now provide real-time temperature and pressure alarms, and many fleets add redundant power sources and phase-change materials to satisfy pharmaceutical and battery-electrolyte stability windows. Maersk’s remote-container-management program offers lane-level temperature assurance, minimizing excursion-related product write-offs.
Higher yields offset capital intensity: premium freight rates can be 150% above ambient-cargo levels, and shippers are willing to pay when a single temperature spike can destroy USD 5 million of active pharmaceutical ingredient. Expansion of electric-vehicle battery corridors across Europe and Asia-Pacific adds incremental, specification-heavy flows that small domestic haulers struggle to serve. Consequently, investment in advanced reefer tanks and telematics will remain a key differentiator within the chemical logistics market.
Geography Analysis
APAC Chemical Logistics Market
Asia-Pacific accounted for 39.21% of global revenue in 2025 and will expand at a 6.31% CAGR through 2031. China’s export overcapacity is propelling intra-Asian trade and rerouting cargo toward India and Southeast Asia, creating fresh multimodal lanes where ports, dedicated freight corridors, and coastal shipping converge. India’s PCPIR clusters anchor integrated complexes along the western and eastern seaboards, but inland demand growth is extending domestic road-rail legs, amplifying demand for ISO-tank repositioning services.
North America and Europe Chemical Logistics Market
North America and Europe remain premium markets, underpinned by extensive rail networks, strict safety rules, and high digital-adoption rates. Revised ADR and CLP frameworks in Europe require upgraded fleets and digital labels, encouraging shippers to lock in long-term contracts with certified providers. In North America, integrated rail corridors linking Gulf-Coast petrochemical complexes to Midwest consumers provide cost-effective, low-emission options that favor operators owning trans-load terminals.
South America and Africa Chemical Logistics Market
South America and Africa offer upside tempered by infrastructure gaps. Prolonged port dwell times in Lagos, Durban, and Mombasa inflate inventory costs and compel carriers to build buffer stocks. The African Continental Free Trade Area aspires to harmonize customs procedures, but interim fragmentation necessitates country-specific expertise and localized partnerships[4]MDPI, “African Continental Free Trade Area and Logistics Challenges,” mdpi.com . Despite these hurdles, nearshoring trends in Latin America are driving chemical manufacturers to relocate intermediate-processing stages closer to US buyers, stimulating corridor development for providers with bilingual staff and customs-broker networks.

Regulatory Landscape
Chemical logistics is shaped by overlapping chemical safety and dangerous-goods transport regimes, and they increasingly require digital-ready documentation and consistent classification across modes. In Europe, the revised CLP Regulation (EU) 2024/2865 activated new requirements in December 2024, and ECHA has published transitional provisions that begin applying in 2026. Those phased compliance windows affect inventory already placed on the market and raise the need for tighter traceability and labeling control across warehouses and distribution nodes.
On transport standards, the 2026 cycle tightened alignment across air, sea, and land. IMDG Code Amendment 42-24 and the ICAO Technical Instructions 2026 became fully operative for maritime and air movements from January 2026. In the US, the Pipeline and Hazardous Materials Safety Administration (PHMSA) issued a final rule under HM-265 effective February 13, 2026 and advanced a harmonization NPRM (HM-215R) referencing ICAO and IMDG updates, reinforcing a broader shift toward harmonized hazmat documentation, training, and packaging compliance for multimodal providers.
Value Chain Analysis
The chemical logistics value chain runs from chemical producers and distributors to packaging and tank-container providers (ISO tanks, IBCs, drums), to compliant transport operators (road tanker, rail, ocean/short-sea, air DG), and into specialized storage and handling infrastructure (hazmat warehouses, temperature-controlled facilities, terminals, and transload sites). Service providers differentiate through risk management (classification, SDS/MSDS control, DG documentation), certified operations (trained staff and audits), and orchestration layers such as control towers, visibility, and carbon reporting. Multimodal handoffs are a primary stress point for both service reliability and compliance.
Recent industry moves point to tighter bundling of capacity and capabilities across the chain to deliver integrated solutions. In North America, Quantix announced partnerships with MC Tank Lines and Leahy Transport (January 2026) to expand liquid transportation coverage, while Rinchem announced a business combination with Dupre Logistics (January 2026) to link chemical warehousing with distribution and transportation capacity. On the customer and association side, ECTA, Cefic, and ECLIC have highlighted interoperable data standards and API-based connectivity in 2026 digitalization efforts, reflecting a shift from document-centric execution to standardized data exchange that can support multi-jurisdiction compliance and visibility across carriers, depots, and terminals.
Competitive Landscape
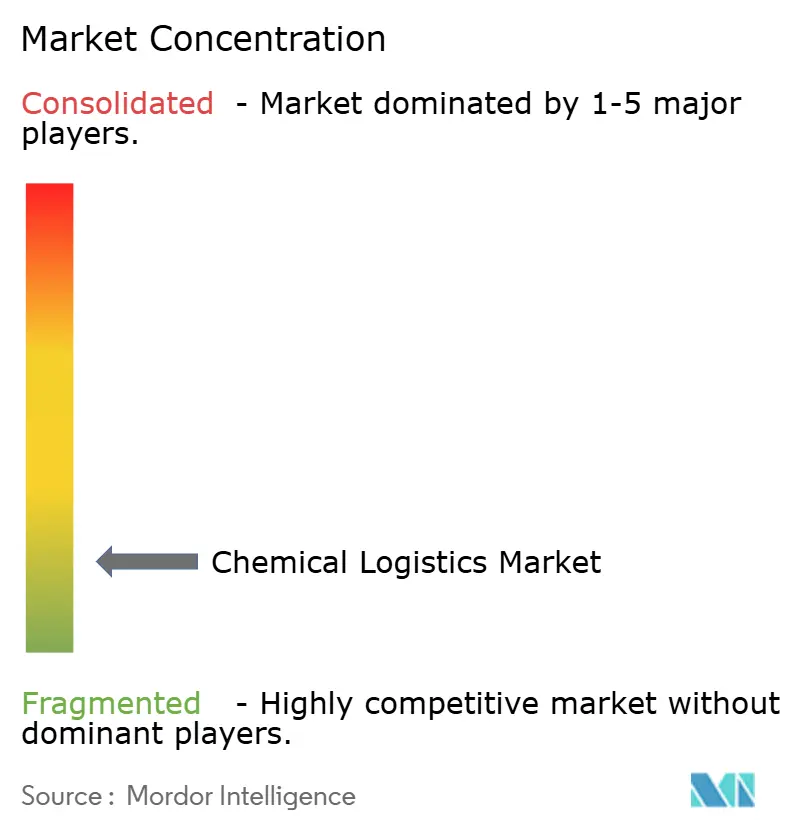
The chemical logistics market is fragmented; the top five providers captured roughly 25% global share in 2025. Scale, specialized assets, and compliance infrastructure underpin competitive advantage. DHL, Kuehne + Nagel, and Maersk integrate transportation, warehousing, and digital orchestration, enabling one-invoice models that resonate with multinational shippers. DSV consolidated its position by acquiring DB Schenker for EUR 14.3 billion (USD 16.70 billion), targeting DKK 9.0 billion (USD 1.41 billion) in annual synergies by 2028.
Strategic focus areas include temperature-controlled capacity, sustainability metrics, and digital platforms. DHL’s EUR 2 billion (USD 2.33 billion) health-logistics outlay adds GDP-compliant nodes across all continents, while Kuehne + Nagel’s visibility suite provides shipment-level carbon accounting, aligning with chemical-producer Scope 3 targets. Emerging digital brokers aggregate spare tank-container capacity but often lack licenses, insurance cover, and driver pools to manage hazmat moves, limiting disruption risk.
Asset specialists such as HOYER, Den Hartogh, and Bertschi maintain an edge in ISO-tank, rail-linked depots, and intermodal know-how, cultivating long-term contracts that cushion cyclical downturns. Tanker owners are greening fleets; NYK-Stolt ordered six methanol-ready ships capable of battery-hybrid propulsion, anticipating tightening IMO rules. Ultimately, competitive intensity will pivot on the ability to fuse compliance, sustainability, and digital transparency into integrated service propositions.
Chemical Logistics Industry Leaders
Deutsche Post DHL Group
Kuehne + Nagel
BDP International
DSV
A.P. Moller - Maersk
- *Disclaimer: Major Players sorted in no particular order
Chemical Logistics Market Companies Covered in this Report
- DHL Supply Chain
- Kuehne + Nagel International AG
- Maersk Logistics & Services
- HOYER Group
- C.H. Robinson Worldwide
- BDP International
- DSV (incl. DB Schenker)
- Rhenus SE & Co. KG
- A&R Logistics (Quantix)
- CEVA Logistics (Acquired by CMA CGM)
- Al-Futtaim Logistics
- Petrochem Middle East (PME)
- Sinotrans Chemical Logistics
- Bertschi AG
- Suttons Group
- Den Hartogh Logistics
- Brenntag Logistics Services
- MOL Chemical Tankers
- Stolt-Nielsen Ltd.
- Katoen Natie N.V.
- Toll Group
- Yusen Logistics Co., Ltd. (Nippon Yusen Group)
- Hellmann Worldwide Logistics SE & Co. KG*

Market Opportunities and Future Outlook
Investment and capacity additions around chemical terminals and storage are creating near-term whitespace for providers that combine compliant handling with inventory and distribution services near industrial hubs. Examples in 2026 include Petrochem Middle East inaugurating a new AED 300 million terminal and headquarters at Jebel Ali to expand petrochemical storage and logistics capacity, BP and Ultracargo completing a new 20,000 cubic meter tank at Paulinia in Brazil (lifting the terminal to about 202,000 cubic meters of static capacity), and LBC Tank Terminals approving the Rainbow 5 Phase A expansion in Rotterdam, adding 41,000 cubic meters of storage capacity. These projects increase the addressable mix of storage, drayage, and value-added services (sampling, blending, labeling, and compliance management) that sit alongside long-haul transportation.
Digital collaboration and document standardization are also an execution-led opportunity, particularly for hazardous and temperature-controlled flows where handoffs and audits occur frequently. ECTA has positioned eFTI as an enabling framework for digital freight information in Europe, and industry initiatives such as electronic European Chemical Transport Document (eECD) processes and standards work like prEN 18219:2025 (Digital Material ID) aim to support more consistent product data exchange. In Asia, the Physical Internet Realization Council (Chemicals Working Group) completed nationwide visualization of dangerous-goods logistics flows in Japan (June 2026), identifying priority areas for joint logistics schemes. This supports multi-shipper collaboration models that improve asset utilization (tanks, depots, and relay points) while keeping hazardous-goods governance in place.
Recent Industry Developments in Chemical Logistics Market
- June 2026: DHL Group expanded its New Energy Logistics services portfolio across segments such as battery energy storage, hydrogen, and solar infrastructure. The move strengthens DHL's position in specialized, compliance-heavy industrial flows that overlap with chemical logistics handling requirements and broadens the value-added service mix beyond standard transport.
- February 2026: DSV signed a two-year framework agreement with Hapag-Lloyd to contract 18,000 tonnes of CO2e emission reductions through the use of sustainable marine fuels in ocean freight. This formalizes access to lower-emission capacity on key sea lanes used for chemicals and raises the importance of verified emissions accounting in shipper procurement.
- April 2025: DHL Supply Chain entered into a five-year lead logistics partner agreement with Sanyo Chemical Industries in Japan, taking over domestic logistics responsibilities. The contract underlines the shift toward LLP/4PL-style outsourcing in chemicals, where providers run integrated transport, warehousing, and compliance processes under a single operational governance model.


Chemical Logistics Market Report Scope and Research Methodology
Market Definition and Coverage
For this study, the chemical logistics market is defined as revenues earned from moving, storing, and handling chemicals safely across modes, including transportation, warehousing, distribution, inventory management, and related value-added services for bulk and packaged chemicals.
Scope exclusions: Direct-to-consumer parcel delivery of household chemical products is excluded from this market size.
Segments Covered in This Report
- By Service
- Transportation
- Road
- Rail
- Sea/Ocean
- Air
- Warehousing, Distribution & Inventory Management
- Other Services
- Transportation
- By End-user Industry
- Pharmaceutical
- Cosmetics & Personal Care
- Oil & Gas
- Specialty Chemicals
- Other End-users
- By Hazard Class
- Hazardous Chemicals
- Non-hazardous Chemicals
- By Temperature Control
- Temperature-Controlled (Refrigerated/Heated)
- Non-Temperature-Controlled
- By Geography
- North America
- United States
- Canada
- Mexico
- South America
- Brazil
- Peru
- Chile
- Argentina
- Rest of South America
- Asia-Pacific
- India
- China
- Japan
- Australia
- South Korea
- South East Asia (Singapore, Malaysia, Thailand, Indonesia, Vietnam, Philippines)
- Rest of Asia-Pacific
- Europe
- United Kingdom
- Germany
- France
- Spain
- Italy
- BENELUX (Belgium, Netherlands, Luxembourg)
- NORDICS (Denmark, Finland, Iceland, Norway, Sweden)
- Rest of Europe
- Middle East and Africa
- United Arab Emirates
- Saudi Arabia
- South Africa
- Nigeria
- Rest of Middle East and Africa
- North America
Data Sources, Market Sizing, and Validation
Desk Research
Desk work started with establishing the demand and supply context for chemicals that typically require specialized handling, and then mapping that flow to logistics activities that earn third-party revenue. We leaned on public statistical series and safety rulebooks to understand where volumes are moving and what constraints shape service pricing and capacity.
Sources included non-paywalled references such as UN Comtrade trade statistics, the International Energy Agency for related industrial demand signals, the US Bureau of Transportation Statistics for mode and freight indicators, Eurostat freight transport data, and UNECE and ADR related public documentation for hazardous goods movement requirements. We also reviewed company annual reports, investor presentations, and reputable press coverage to identify service mixes and recent capacity actions, and we used a paid subscription for company financials and news to cross-check reported logistics exposure and regional revenue split patterns. These examples are not exhaustive, and many other public and paid sources were also referred to for data collection, validation, and clarification.
Primary Interviews and Surveys
Primary discussions were used to pressure-test how chemical shippers buy logistics, how lane mix changes with macro cycles, and how value-added services (like compliant storage and documentation support) affect realized pricing. We spoke with a mix of logistics providers, chemical producers and distributors, and domain specialists across major regions so gaps from desk research could be closed and assumptions could be adjusted before finalizing the model.
Distribution of primary research fieldwork respondents
| Company type | Respondent position | Region |
|---|---|---|
| Top tier: 33% | CXOs: 15% | APAC: 42% |
| Mid tier: 49% | Functional/Unit leaders: 31% | EMEA: 36% |
| Smaller Players: 18% | Managers: 54% | Americas: 22% |
Market-Sizing & Forecasting
The sizing logic starts with a top-down build where chemical production and trade flows are translated into logistics activity pools by region, and then converted into revenue using service intensity and price benchmarks tied to the way chemicals are stored and transported. Once the headline totals were formed, we corroborated them with selective bottom-up approximations, such as sampling provider revenue exposure to chemical logistics, channel checks on warehousing utilization, and spot validation using volume and average service-rate ranges.
Key inputs in the model include the mix of bulk versus packaged chemical movements, hazardous handling requirements and compliance costs, modal split by lane type (road, rail, sea, air, pipelines), warehouse capacity additions and utilization trends, and fuel and labor cost movement that typically passes through to service rates. Where primary inputs were missing for smaller corridors, gaps were handled using proxy lanes with similar chemical mix and distance bands, followed by expert validation so the assumption stayed practical.
For forecasting, we used scenario analysis anchored on expected chemical output, trade momentum, and logistics cost inflation, and then tuned the path using interview-backed views on capacity tightness and service-level requirements. As the final step, the short-term and mid-term trajectories were reviewed to ensure they stayed consistent with observed freight and industrial activity signals, and with known regulatory and safety-driven cost patterns.
Data Validation & Update Cycle
Model outputs are checked against independent signals, such as chemical production and trade direction, freight mode indicators, and visible warehousing expansion announcements, and then variances are reviewed to find the cause. If an outlier is linked to an assumption, it is reworked and, when needed, a follow-up call is triggered so the adjustment is supported by real operating feedback.
Before sign-off, the build goes through multi-step analyst reviews where calculations, unit logic, and currency consistency are rechecked, and then the narrative is aligned to the final numbers. Reports are refreshed annually, with interim updates when material events occur, and a fresh pre-delivery pass is completed so clients receive the latest updated view.
Mordor Intelligence's Global Chemical Logistics Market Sizing Compared With Other Published Estimates
Published market sizes for chemical logistics rarely match exactly because the counting boundary is not uniform across studies, and because different assumptions are used for what revenue gets treated as logistics versus adjacent services. Differences also come from which modes are counted, how value-added services are priced, and which year and currency timing is used for conversion.
The table shows a wide spread mainly because some estimates fold in broader logistics categories, or they use a different base year and then carry the value forward with a single growth rate. The table-led gap is most visible around whether bulk and packaged chemical handling across all hazard classes is counted only when it is logistics revenue, and, in Mordor Intelligence's model, direct-to-consumer parcel delivery of household chemical products is left out even if it moves through similar networks.
Benchmark comparison
| Source | Market Size | Gaps in Research Methodology |
|---|---|---|
| Mordor Intelligence | USD 534.37 B (2026) | |
| Trade Journal A | USD 291.90 B (2025) | Uses a smaller starting-year base and appears to rely on a broader, simplified service-rate assumption, which can undercount value-added chemical handling and mode-specific compliance cost effects. |
| Industry Association B | USD 300.00 B (2024) | Often reflects a high-level industry snapshot where scope can blend general freight and chemical distribution activities, and where regional weighting and currency timing are not always stated clearly. |
Across the three figures, the practical takeaway is that scope and revenue recognition choices drive most of the gap, not just growth rates. By tying the market to clear logistics services and checking results against chemical flow signals and provider exposure patterns, we keep a traceable number that is easier to replicate and update when conditions change.


Key Questions Answered in the Report
What is the projected value of the chemical logistics market in 2031?
The chemical logistics market size is forecast to reach USD 683.28 billion by 2031.
Which region will grow the fastest through 2031?
Asia-Pacific is expected to register a 6.31% CAGR, the highest among all regions.
Which service category is expanding more quickly than transportation?
Other Services including blending, compliance, and orchestration are advancing at a 6.41% CAGR.
Why are temperature-controlled shipments gaining share?
Their 7.25% CAGR is fueled by pharmaceutical chemicals and battery electrolytes that demand strict thermal stability.
How is regulation influencing market consolidation?
Higher ADR, CLP, and hazmat-fee requirements elevate compliance costs, encouraging mergers among operators that can spread fixed costs over larger volumes.
Page last updated on:


 Your data is secure and never sold or shared.


