
Car Sharing Telematics Market Size and Share
Market Overview
| Study Period | 2020 - 2031 |
|---|---|
| Market Size (2026) | USD 19.11 Billion |
| Market Size (2031) | USD 35.63 Billion |
| Growth Rate (2026 - 2031) | 13.29 % |
| Fastest Growing Market | Asia-Pacific |
| Largest Market | Europe |
| Market Concentration | Medium |
Major Players *Disclaimer: Major Players sorted in no particular order Image © Mordor Intelligence. Reuse requires attribution under CC BY 4.0. | |
Car Sharing Telematics Market Analysis by Mordor Intelligence
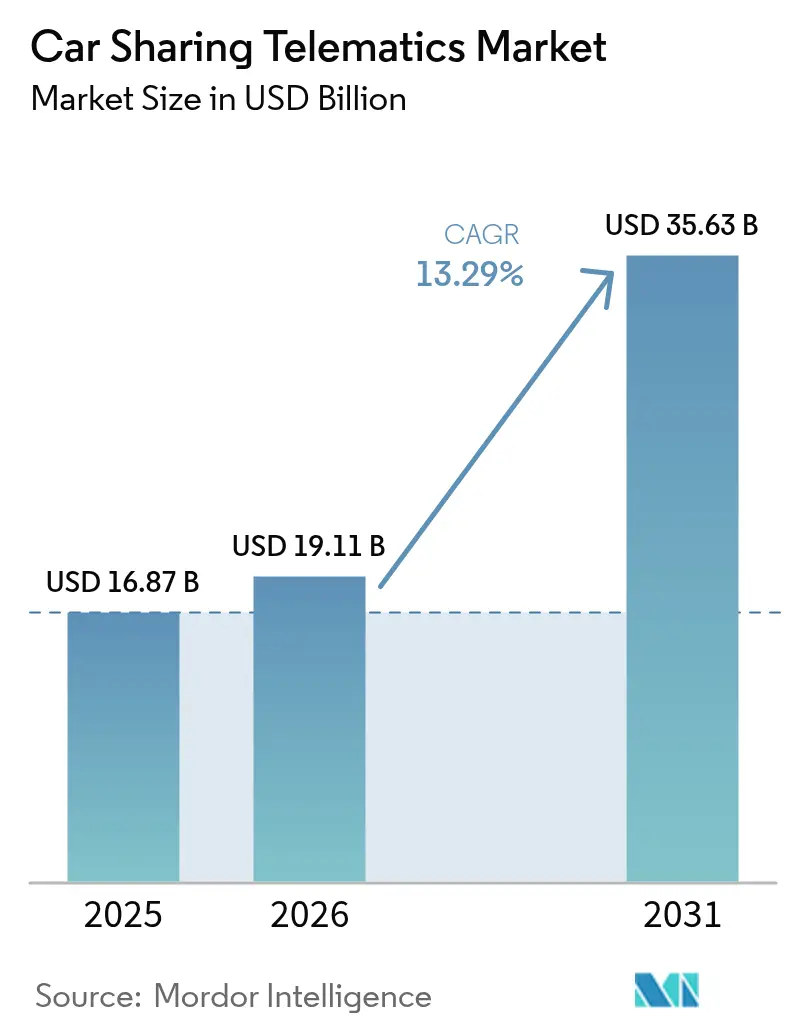
Car Sharing Telematics Market size in 2026 is estimated at USD 19.11 billion, growing from 2025 value of USD 16.87 billion with 2031 projections showing USD 35.63 billion, growing at 13.29% CAGR over 2026-2031.
Expansion is driven by tighter urban congestion policies, mandatory in-vehicle safety regulations, and a rapid infusion of IoT-enabled fleet management architectures, which together redefine urban mobility economics. Europe retains a 37% revenue lead, driven by eCall compliance and long-standing shared-mobility ecosystems, whereas the Asia Pacific registers the fastest pace at 14.51% CAGR, largely due to smart-city spending and autonomous-vehicle pilots. Embedded connectivity, cloud analytics, and battery-electric-vehicle (BEV) proliferation combine to raise telematics complexity and opportunity across all major business models. The resulting data deluge underpins new revenue pathways in usage-based insurance, MaaS aggregation, and energy management, cementing telematics as the core digital spine of shared mobility.
Key Report Takeaways
- By channel, the aftermarket segment secured 57.42% of the car sharing telematics market share in 2025, while OEM-embedded solutions are advancing at a 14.92% CAGR through 2031.
- By form factor, integrated telematics platforms are expanding at 16.65% CAGR, overtaking embedded solutions that held 45.48% revenue share in 2025.
- By car-sharing model, free-floating services commanded 60.35% revenue in 2025; peer-to-peer platforms are projected to grow at 18.74% CAGR to 2031.
- By vehicle propulsion, BEVs accounted for 39.28% of the car sharing telematics market size in 2025 and are growing at 22.38% CAGR through 2031.
- By region, Europe led with 36.62% revenue in 2025, whereas Asia Pacific is forecast to log the fastest 14.33% CAGR to 2031.
Note: Market size and forecast figures in this report are generated using Mordor Intelligence’s proprietary estimation framework, updated with the latest available data and insights as of 2026.
Market Trends and Insights
Drivers Impact Analysis of Car Sharing Telematics Market*
| Driver | (~) % Impact on CAGR Forecast | Geographic Relevance | Impact Timeline |
|---|---|---|---|
| Growing urban preference for shared mobility | +2.8% | Global tier-1 cities | Medium term (2–4 years) |
| Government mandates for vehicle telematics (eCall, safety) | +2.1% | Europe, North America, emerging APAC | Short term (≤2 years) |
| Integration of IoT/AI/ML for fleet optimization | +2.4% | North America and Europe | Medium term (2–4 years) |
| Rapid electrification of car-sharing fleets | +1.9% | Europe, China, California | Long term (≥4 years) |
| Usage-based-insurance partnerships lowering OPEX | +1.6% | North America and Europe | Medium term (2–4 years) |
| API-first telematics platforms enabling MaaS aggregation | +1.4% | Global tech hubs | Long term (≥4 years) |
| Source: Mordor Intelligence | |||
Growing Urban Preference for Shared Mobility
Continued densification and escalating congestion-charging schemes are shifting commuter economics toward shared fleets, nudging municipal planners to re-allocate curb space for multimodal mobility hubs that integrate car sharing, micro-mobility, and public transit. Free-floating operators use real-time heat-map telemetry to reposition vehicles in zones of peak demand, cutting customer wait times and trimming fleet idle minutes. In Munich and Berlin, usage clusters align with demographic density and proximity to subway interchanges, confirming location analytics as a core profitability lever. Dynamic-pricing engines, trained on weather feeds and event calendars, optimize vehicle distribution while lowering per-ride emissions footprints. Such urban network effects underscore why investors continue to back car sharing telematics market platforms that internalize both transportation and environmental externalities.
Government Mandates for Vehicle Telematics (eCall, Safety)
Regulators are accelerating adoption by making telematics a legal obligation. Under the EU General Safety Regulation II, all new M1 and N1 vehicles must feature intelligent speed assistance, automatic emergency-braking, and event-data recorders from July 2024.[1] Next-Generation eCall shifts the emergency-alert backbone from 2G/3G to 4G/5G, demanding hardware refreshes across car-sharing fleets.[2]Comparable frameworks are rolling out in Russia and Brazil, and the FCC is reviewing a similar mandate, giving scale economies to vendors able to standardize multi-region compliance. Vehicles upgraded for NG-eCall deliver richer crash datasets that operators now monetize through safer-driving programs and refined insurance pricing.
Integration of IoT/AI/ML for Fleet Optimization
AI-enabled telematics platforms process upward of 300 vehicle signals per second to predict component failures, optimize charging windows, and personalize in-app offers. Geotab forecasts industry-wide migration to edge-AI architectures that embed machine-learning accelerators in telematics control units, slashing cloud-compute costs and latency.[3]V2X interoperability leveraging 5G bandwidth allows shared cars to coordinate lane merges and parking maneuvers, boosting average fleet utilization. HARMAN’s 5G-ready control unit exemplifies the shift from connectivity modules to holistic vehicular computers, a prerequisite for Level-4 autonomy deployment.
Rapid Electrification of Car-Sharing Fleets
Operational math favors BEVs in shared fleets: centralized depots lower charging overhead, regenerative braking cuts wear, and predictable daily mileage eases range anxiety. ChargePoint’s telematics suite co-optimizes route scheduling and charger assignment, reducing per-mile energy costs by double digits. Renault Group’s Utrecht pilot shows Vehicle-to-Grid (V2G) participation earning ancillary revenue while keeping state-of-charge within warranty limits.[4] The push toward 800-V architectures heightens requirements for thermal-management telemetry and silicon-carbide inverter diagnostics, expanding the bill of materials for car sharing telematics market hardware.
Restraints Impact Analysis of Car Sharing Telematics Market*
| Restraint | (~) % Impact on CAGR Forecast | Geographic Relevance | Impact Timeline |
|---|---|---|---|
| High hardware and installation costs | -1.8% | Global, price-sensitive markets | Short term (≤2 years) |
| Data-privacy and cyber-security concerns | -1.4% | Europe, North America | Medium term (2–4 years) |
| Lack of telematics interoperability standards | -1.1% | Global | Long term (≥4 years) |
| Low utilization in suburban and rural zones | -0.9% | North America suburbs, rural Europe and APAC | Long term (≥4 years) |
| Source: Mordor Intelligence | |||
High Hardware and Installation Costs
Silicon supply constraints and escalating sensor counts are pushing semiconductor content per vehicle toward USD 1,200 by 2030, doubling 2022 levels, a trend highlighted by NITI Aayog’s component-cost tracking. Upgrading fleets from 4G to 5G radios elevates module prices yet delivers minimal payback until low-latency apps reach scale. Consequently, smaller operators defer refresh cycles or seek subscription models that spread capital outlay across contractual terms. Strategic OEM-tier-one alliances—Geotab with Volkswagen Group, Samsara with Stellantis—are emerging to unlock purchase discounts and shared R&D while ensuring compliance updates flow over-the-air rather than via costly service campaigns.
Data-Privacy and Cyber-Security Concerns
Europe’s GDPR necessitates explicit user consent for location, behavioral, and biometric tracking, forcing developers to adopt privacy-by-design architectures with local data minimization. A 2024 European survey found 67% of drivers trust automakers with their data, but only 33% extend that trust to third-party app providers—placing car-sharing platforms under added scrutiny. Tesla’s documented camera-data leakage underscores reputational stakes and motivates investment in end-to-end encryption and penetration testing. Cyber intrusions ranging from key-relay hacks to CAN-bus injections compel layered defenses, further inflating total cost of ownership for telematics rollouts.
*Our forecasts treat driver/restraint impacts as directional, not additive. The impact forecasts reflect baseline growth, mix effects, and variable interactions.
Car Sharing Telematics Market Segment Analysis
By Channel:
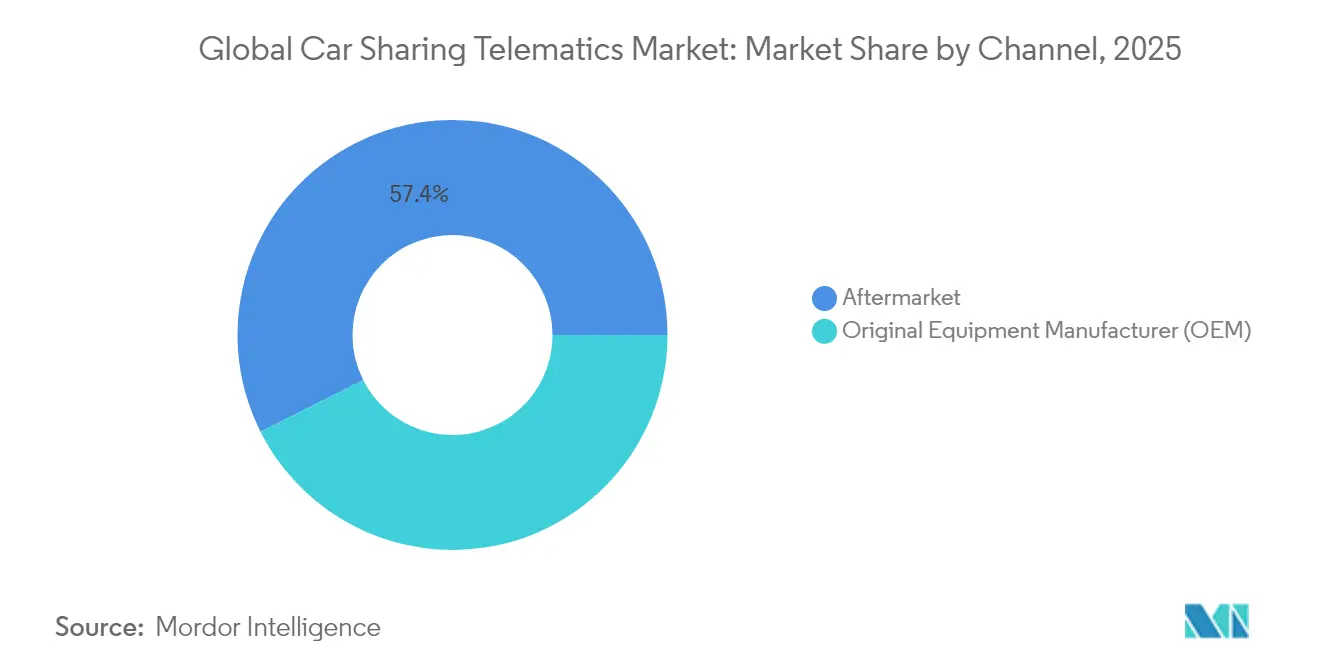
OEM Integration Accelerates Despite Aftermarket DominanceIn 2025, aftermarket retrofits dominated with 57.42% revenue, reflecting the sizeable legacy vehicle pool. Yet OEM-embedded units are advancing at 14.92% CAGR, helped by factory-level compliance with eCall-style mandates and tighter cybersecurity hardening. Automakers now expose on-board APIs that furnish granular battery, ADAS, and climate data, giving operators more levers to drive up fleet utilization. Partnerships such as Geotab’s direct pipeline into Volkswagen Group dashboards exemplify the gravitation toward ecosystem plays that marry hardware, software, and field-updatable firmware in a single lifecycle stack.
The car sharing telematics market size for OEM-integrated deployments is projected to climb sharply as BEV adoption widens, because battery diagnostics demand direct traction-system access that retrofit dongles cannot match reliably. Nonetheless, retrofit vendors still serve mixed-fuel fleets and emerging markets where vehicle ages average above eight years, keeping a two-speed channel landscape intact through the mid-term.
Cost parity between embedded and aftermarket is narrowing as silicon prices climb, while over-the-air provisioning reduces fit-out labor for factory units. Larger operators hedge by blending both strategies: new acquisitions arrive with embedded telematics, but veteran gasoline or hybrid units receive certified third-party devices to unify granular data feeds. This hybrid posture insulates businesses from single-vendor risk and shortens refresh cycles without stranding capital—practices that shape procurement playbooks across the broader car sharing telematics market.

By Form:
Integrated Solutions Drive Next-Generation ConnectivityEmbedded modules accounted for 45.48% revenue in 2025, but fully integrated connectivity platforms—encompassing 4G/5G modems, edge AI, and secure bootloaders—exhibit a 16.65% CAGR. These units aggregate functions that once required discrete devices, trimming wiring harnesses while expanding compute throughput. Integrated architectures expose open APIs, enabling developers to layer MaaS billing engines, predictive-maintenance dashboards, and carbon-footprint calculators atop the same telemetry backbone.Tethered solutions that depend on smartphone pairing are receding as fleet operators prioritize always-on redundancy for lock/unlock, immobilizer, and remote-disabling commands. The car sharing telematics market size attached to integrated-form deployments is forecast to outstrip tethered revenues by 2027 as 5G coverage proliferates across metropolitan corridors, permitting latency-sensitive applications such as tele-driving and remote-valet services.
Edge-side containerization now allows multiple virtualized applications to coexist securely within one telematics control unit, future-proofing fleets against evolving standards. Standardization drives cross-OEM data fusion, simplifying multi-brand fleet operations and trimming software-integration overhead. As a result, integrated solutions increasingly underpin RFP criteria among both new entrants and incumbent operators, accelerating their momentum within the car sharing telematics market.
By Car-Sharing Model:
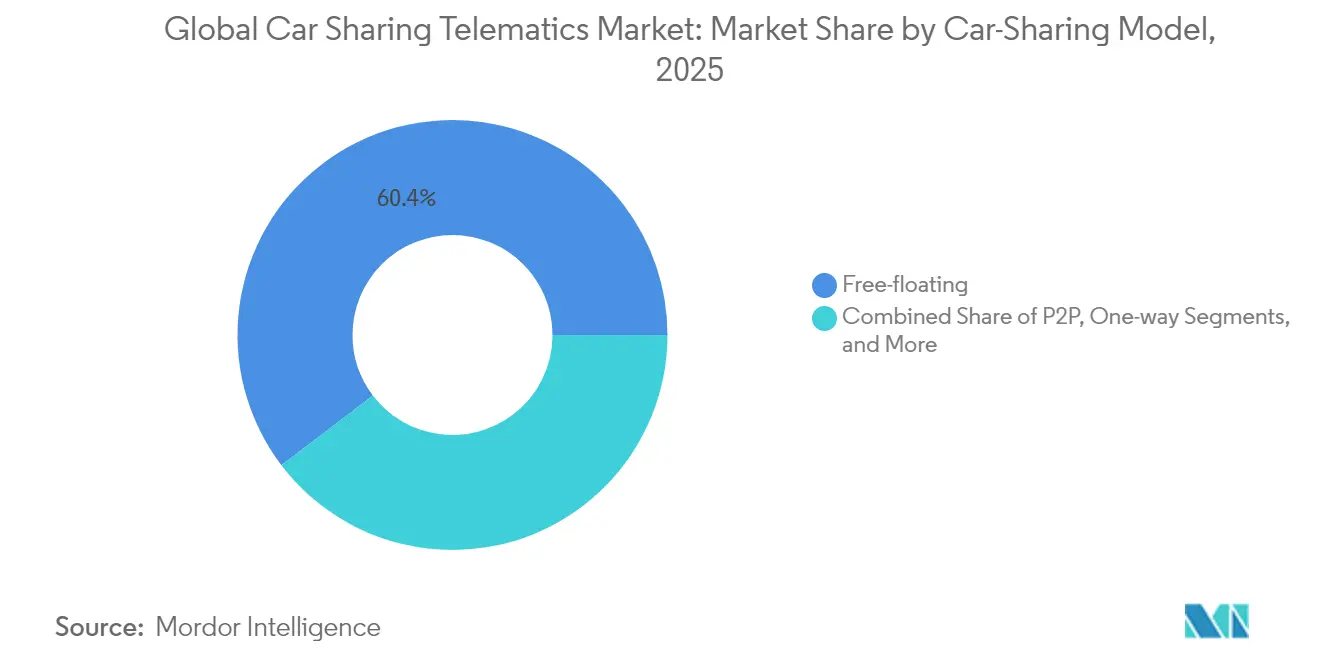
Free-Floating Dominance Meets P2P InnovationFree-floating networks captured 60.35% of 2025 revenue by eliminating rigid station networks, boosting car-per-user ratios in densely populated corridors. AI-guided repositioning reduces time-to-vehicle, and transaction streams feed dynamic-pricing engines that fine-tune hourly tariffs against real-time supply. However, peer-to-peer (P2P) networks—leveraging privately owned vehicles—are sprinting ahead at 18.74% CAGR, aligning with asset-light corporate strategies. Telemetry underpins trust, granting hosts and guests access to odometer validation, fuel-level auditing, and driving scorecards. Station-based and round-trip formats now occupy niche roles—corporate motor pools, university campuses, or peri-urban catchments—where parking capacity offsets the fixed-route limitation. Despite slower growth, their predictable booking patterns support long-duration rentals, cushioning revenue volatility. The diversification of business models broadens addressable demand and disperses risk, underpinning sustained expansion of the overall car sharing telematics market.
Regulators increasingly view P2P models as congestion-mitigating rather than competitive to public transit, granting favorable zoning or parking waivers. Yet P2P growth amplifies cybersecurity and privacy obligations because asset ownership and user base are both atomized. Platform operators embed hardened OBD-gateways and biometric authentication to maintain safety while facilitating frictionless handover—a design imperative shaping the next development wave within the car sharing telematics market.
By Vehicle Propulsion:
Electric Transformation Reshapes Telematics RequirementsBEVs held 39.28% revenue in 2025 and expand at 22.38% CAGR, propelled by zero-emission zones, plunging battery costs, and predictable shared-fleet duty cycles. Real-time battery-state reporting, charge-session orchestration, and residual-value analytics move from nice-to-have to mission-critical. Operators rely on thermal-management telemetry to avoid asset downtime during fast-charging peaks, while V2G-ready firmware converts parked vehicles into distributed grid storage. Internal-combustion and hybrid powertrains persist where charging deserts remain, but their share will decline steadily as public DC-fast networks proliferate. The car sharing telematics market size linked to BEV fleets therefore outpaces that of hydrocarbons, pushing vendors to integrate charger-availability APIs, energy-tariff look-ups, and route-based range prediction. These software pivots define competitive gaps as electrification pushes deeper into the 2030 horizon.
Emerging silicon-carbide inverters and 800-V battery systems heighten thermal and fault-detection requirements, dictating new sensor arrays and higher-bandwidth CAN gateways. Telemetry vendors transitioning to zonal architectures reduce wire weight while adding redundancy, ensuring resilience for autonomous-ready fleets. Such evolutions anchor long-term cost leadership for platforms that master electric-specific data orchestration within the car sharing telematics market.
Geography Analysis
Europe, North America and APAC Car Sharing Telematics Market
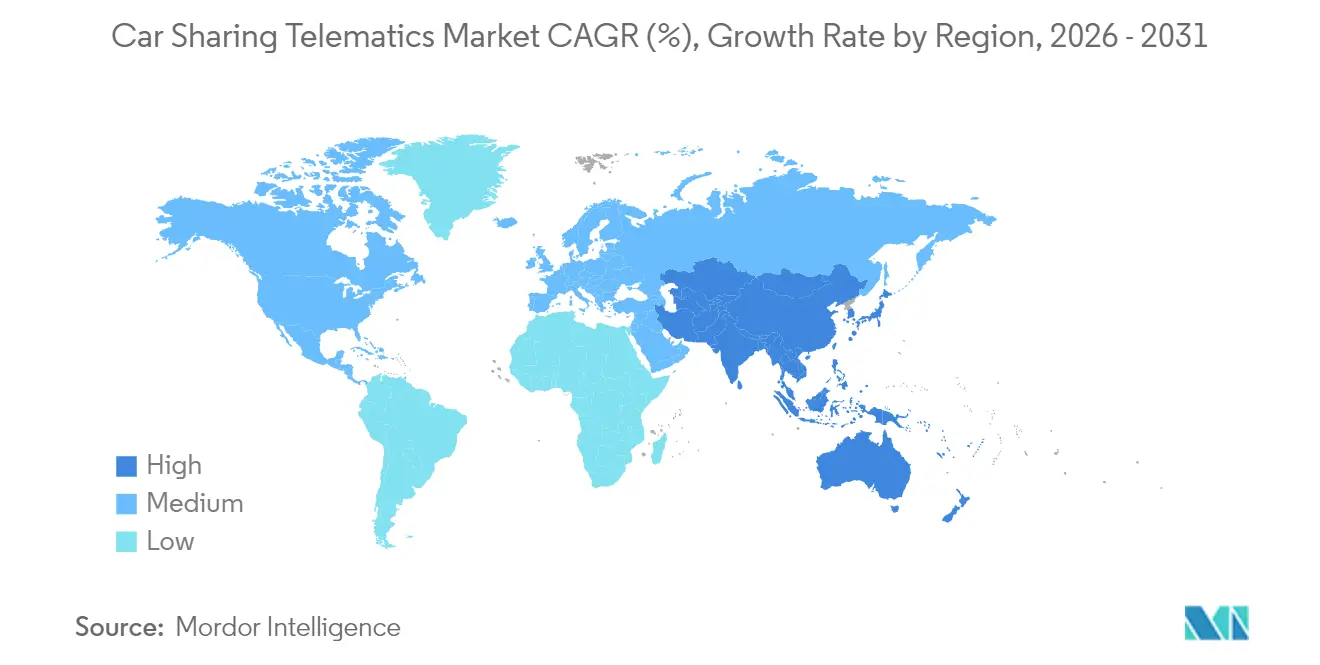
Europe retains 36.62% revenue leadership owing to mature regulations that mandate advanced safety and connectivity suites on all new vehicles. National incentive schemes bordering Germany, France, and the Nordics subsidize electrified car-sharing fleets, making BEV subscriptions financially compelling for operators. ShareNow’s expansion eastward demonstrates intra-continental knowledge transfer, while Renault’s Utrecht V2G pilot showcases grid-integrated mobility potential. Asia Pacific is scaling fastest at 14.33% CAGR, underwritten by rapid urban migration and sovereign smart-city budgets. Mainland China alone fields robotaxi pilots across more than 50 municipalities, each requiring ultra-low-latency connectivity baked into fleet telematics. The region counts 1.8 billion mobile subscribers, a connectivity bedrock for real-time fleet orchestration and over-the-air updates. Southeast Asian governments are likewise subsidizing telematics-based fleet-management rollouts, cultivating a fertile runway for the car sharing telematics market. North America exhibits mixed momentum: tech-centric metros adopt 5G-enabled tele-driving pilots, whereas suburban sprawl depresses vehicle-turnover metrics. Verizon Business’ Las Vegas partnership with Vay highlights the push toward remote-driven e-vehicles that cut repositioning labor while leveraging mmWave bandwidth. Rural and ex-urban districts, however, remain tethered to LTE or legacy 3G networks, tempering service-expansion economics. Canada and the United States increasingly prioritize cybersecurity alignment with federal standards such as ISO/SAE 21434, adding an additional compliance layer yet reinforcing consumer trust—crucial for sustained car sharing telematics market penetration.
Regulatory Landscape
Car sharing telematics deployments are increasingly shaped by connected-vehicle safety mandates and privacy governance. In the European Union, General Safety Regulation II requirements that took effect from July 2024 for new M1 and N1 vehicles (including event data recorders and other safety functions) reinforce factory-fit connectivity and set a higher bar for compliant data capture in shared fleets.
Data access, cybersecurity, and data protection rules are tightening in parallel. The EU Data Act became applicable from September 2025, formalizing user-mediated access to connected-product data and pressuring OEM and platform architectures to support permissioned third-party data sharing. In May 2026, the European Data Protection Board (EDPB) summarized updated guidance for connected vehicles and mobility data, emphasizing in-vehicle or local processing and user control under GDPR. On product security, the EU Cyber Resilience Act introduces conformity assessment obligations for connected products used in telematics (including aftermarket devices that interface with vehicle systems), which pushes vendors toward hardened secure-boot, vulnerability handling, and technical documentation processes. Outside Europe, privacy-law changes such as Oregon amendments effective January 2026 (covering precise geolocation and consent requirements) and 2026 US Department of Commerce BIS rules restricting certain connected-vehicle software linkages add region-specific compliance and supply-chain screening requirements for global telematics stacks.
Value Chain Analysis
The car sharing telematics value chain starts with upstream components and connectivity, including telematics control units, sensors and gateways (factory-fit or OBD-based), SIM/eSIM provisioning, and cloud infrastructure for ingestion and analytics. Midstream, platform providers and integrators (for example, INVERS, Vulog, and Ridecell) combine device management, secure access and immobilization, geofencing, billing hooks, and fleet optimization software. They often rely on standardized APIs to normalize signals across mixed-brand fleets and to connect with MaaS or operator back-office systems.
Downstream, car-sharing operators and corporate fleets consume these capabilities to run reservations, access control, damage and risk management, and charging orchestration for BEVs, along with customer support workflows. Insurers and data partners monetize derived insights such as driving scores and usage-based pricing. A notable structural shift is the move toward hardware-free, OEM-embedded data access delivered through data-as-a-service and neutral marketplaces, with Stellantis-backed Mobilisights opening embedded vehicle data to third parties through partnerships. In June 2026, CARUSO Dataplace partnered with Polestar to provide secure API access to vehicle telematics data for business customers, rebalancing value from installation-heavy aftermarket programs toward software integration, consent management, cybersecurity assurance, and cross-OEM data interoperability.
Competitive Landscape
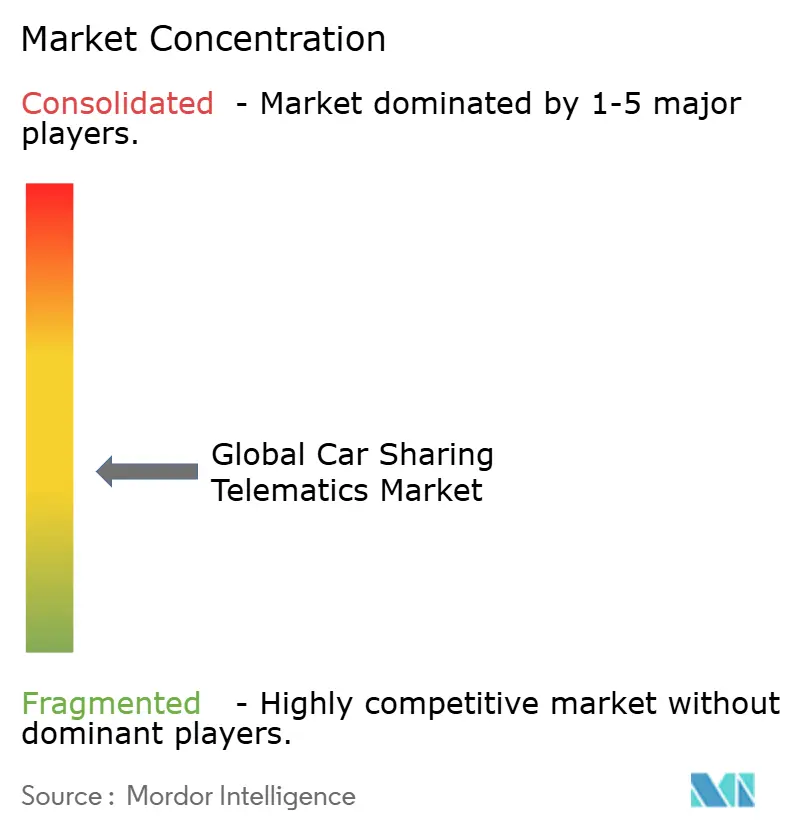
The sector is moderately fragmented: no single vendor controls more than one-fifth of global revenue, yet synergy-driven tie-ups are tightening the field. Platform specialists INVERS, Vulog, and Ridecell compete on configurable software stacks, while Continental, Bosch, and HARMAN battle for the underlying telematics control units. Geotab holds a defensible moat via direct integrations with 157 OEMs, covering nearly 15,000 vehicle variants and granting a data-scale advantage others struggle to match.
Intellectual-property filings underscore strategic priorities—Toyota registered 2,428 telematics and mobility patents in 2024 alone, reinforcing vertical-integration defenses. Start-ups wield API-first architectures to unbundle legacy stacks, but require deep cybersecurity credentials and global SIM provisioning to win enterprise deals. Hardware margins keep tightening due to semiconductor inflation, pivoting revenue toward analytics subscriptions and fleet-efficiency dashboards. These dynamics collectively steer the car sharing telematics market toward a platform-plus-ecosystem structure reminiscent of smartphone operating systems.
OEMs are intensifying in-house software pushes, absorbing telematics layers that aftermarket players once monopolized. Stellantis’ Mobilisights data marketplace feeds raw vehicle signals directly into partner dashboards without external dongles, exemplifying data-monetization moves that squeeze lower-tier suppliers Stellantis. Meanwhile, tier-ones forge EV-specific telemetry modules bundled with over-the-air battery-management firmware, securing annuity revenues long after initial hardware sales. Such maneuvers deepen moats and accelerate consolidation across the car sharing telematics market.
Car Sharing Telematics Industry Leaders
-
INVERS GmbH
-
Convadis AG
-
MoC Sharing
-
Ridecell, Inc
-
Vulog
- *Disclaimer: Major Players sorted in no particular order
Car Sharing Telematics Market Companies Covered in this Report
- INVERS GmbH
- Vulog
- Ridecell Inc.
- Convadis AG
- Continental Aftermarket and Services
- OCTO Group S.p.A
- Geotab Inc.
- Targa Telematics
- Fleetster
- OpenFleet
- Mobility Tech Green
- WeGo B.V.
- MoC Sharing
- Free2Move
- Miles Mobility
- Share Now
- Sixt share
- Getaround
- Zity
- Bolt Drive
Market Opportunities and Future Outlook
A primary opportunity sits at the intersection of data governance and data monetization. Frameworks such as the EU Data Act (applicable from September 2025) and GDPR-driven guidance make user-mediated data sharing a design requirement rather than a feature. Telematics providers that productize consent, purpose limitation, and local processing can reduce friction for car-sharing operators operating across jurisdictions, especially as the European Data Protection Board summary on connected vehicles and mobility data issued in May 2026 sharpens expectations for user control.
Another visible whitespace is the shift from device-centric deployments toward embedded, marketplace-driven access in mixed-brand fleets. That approach can cut time-to-deploy and improve data fidelity for BEV-specific diagnostics. Recent platform moves reinforce this pathway, including Mobilisights enabling broader embedded-data access through third-party integrations, and CARUSO Dataplace partnering with Polestar in June 2026 to expose vehicle data via secure APIs to business customers. At the connectivity layer, Europe corridor-level programs such as the 5G Strategic Deployment Agenda for Connected and Automated Mobility (CAM) support higher-reliability telematics use cases, including remote operations, V2X-enabled fleet optimization, and richer OTA workflows. These improvements tend to align with free-floating and corporate models where utilization targets are tight.
Recent Industry Developments in Car Sharing Telematics Market
- June 2026: CARUSO Dataplace partnered with Polestar to make vehicle telematics data available to business customers via secure APIs. The move strengthens the role of neutral data marketplaces in serving mixed-OEM fleets and reduces reliance on aftermarket hardware installations for data acquisition.
- September 2025: INVERS GmbH added a Driving Score capability to its Driving Analysis offering to automate evaluation of risky driving behavior. This expands telematics value beyond access and tracking into insurance-relevant analytics and operational risk controls for shared fleets.
- October 2024: Verizon Business partnered with Vay to deploy 5G connectivity for tele-operated shared EVs in Las Vegas. The deployment highlights how low-latency connectivity can enable new operating models such as remote repositioning, increasing the strategic importance of network-backed telematics stacks.
Car Sharing Telematics Market Report Scope and Research Methodology
Market Definition and Coverage
This market covers the revenue generated from telematics used to operate and manage car sharing fleets, including in-vehicle devices, connectivity, and supporting software that enables access, tracking, safety, and usage-based billing across shared vehicles.
Scope exclusions: We exclude general consumer telematics sold for privately owned cars when it is not deployed for a car sharing or shared fleet operating model.
Segments Covered in This Report
- By Channel
- Original Equipment Manufacturer (OEM)
- Aftermarket
- By Form
- Embedded
- Tethered
- Integrated
- By Car-Sharing Model
- Round-trip / Station-based
- Free-floating (One-way)
- Peer-to-Peer (P2P)
- Corporate / Fleet
- By Vehicle Propulsion
- Internal-Combustion Engine (ICE)
- Battery-Electric Vehicle (BEV)
- Hybrid Electric Vehicle (HEV/PHEV)
- By Geography
- North America
- United States
- Canada
- Mexico
- South America
- Brazil
- Argentina
- Rest of South America
- Europe
- Germany
- United Kingdom
- France
- Italy
- Spain
- Russia
- Rest of Europe
- Asia Pacific
- China
- India
- Japan
- South Korea
- ASEAN
- Rest of Asia Pacific
- Middle East and Africa
- Middle East
- Saudi Arabia
- UAE
- Turkey
- Rest of Middle East
- Africa
- South Africa
- Rest of Africa
- Middle East
- North America
Data Sources, Market Sizing, and Validation
Desk Research
Desk research was used to set the scope boundaries and build the first set of inputs around car sharing fleet scale, telematics adoption patterns, and regional operating realities. We referred to public sources such as the International Transport Forum (OECD) on shared mobility signals, the International Energy Agency for EV fleet and charging indicators, the European Commission for mobility and data related policy context, and the US Department of Transportation and national statistics offices for transport activity baselines.
We also used sources like company annual reports, investor presentations, reputable press coverage, and association websites to track product launches, partnership announcements, and the direction of pricing models in shared fleets. In parallel, we used paid subscriptions for company financials and intelligence, news and financials screening, and patent databases to support revenue range checks, and to validate how telematics capabilities are evolving for access control, tracking, and day-to-day fleet operations. The examples of desk research sources listed here are illustrative, and many other references were used for data collection, validation, and clarification.
Primary Interviews and Surveys
Primary work focused on interviews and short surveys with telematics solution providers, shared mobility operators, systems integrators, and connected services specialists with visibility into active deployments and renewals. These discussions were used to confirm adoption rates by region, keep the hardware versus service revenue logic consistent, and stress test assumptions on average selling price changes and contract lengths before the final model was locked.
Distribution of primary research fieldwork respondents
| Company type | Respondent position | Region |
|---|---|---|
| Top tier: 39% | CXOs: 16% | APAC: 41% |
| Mid tier: 45% | Functional/Unit leaders: 31% | EMEA: 36% |
| Smaller Players: 16% | Managers: 53% | Americas: 23% |
Market-Sizing & Forecasting
Sizing starts with a top-down build where the demand pool is reconstructed from the active shared fleet footprint by region, the penetration of connected access and tracking systems, and typical subscription attachment rates. We then translate these into revenue using region-specific price bands. To keep totals realistic, we corroborated the outputs with selective bottom-up checks such as sampled per-vehicle monthly fees, device replacement cycles, and a limited roll-up of supplier and operator revenue ranges discussed during interviews.
Key model inputs included shared fleet size trends (including the shift to EVs), the split between embedded, tethered, and integrated forms, subscription versus pay-per-use operating models, average contract duration and churn, and the mix of functions that tend to be monetized in car sharing (access control, billing support, tracking, diagnostics, and fleet utilization). Forecasts were produced using scenario analysis, with the forward path anchored on expected fleet growth, connectivity and data regulation direction in major regions, and ASP progression that reflects software value-add and downward hardware price pressure. Where bottom-up signals were incomplete for smaller geographies, we applied proxy ratios from comparable markets and then re-checked them with expert feedback so long-tail revenue was not overstated.
Data Validation & Update Cycle
Validation was handled through multiple checks, starting with a reconciliation between the modeled revenue and independent signals such as shared fleet counts, mobility usage indicators, and known pricing norms for connected fleet services. Outliers were reviewed by an analyst not involved in the first build, and the drivers were reworked when a variance could not be explained through timing, pricing, or scope alignment.
We refresh the report annually, and interim updates are triggered when major policy shifts, large operator rollouts, or notable pricing changes materially affect the expected demand pool. Before delivery, we do a final pass to confirm currency conversion timing, updated macro assumptions, and any late-breaking market events so clients receive the most current view.
Mordor Intelligence's Global Car Sharing Telematics Market Size Measured Against Other Published Estimates
Published market numbers for car sharing telematics can look far apart because groups often apply different year timing, currency conversion points, and what they treat as telematics revenue versus broader fleet operations software. Even when the labels sound the same, totals can shift depending on whether pricing is treated as a one-time device sale, a recurring subscription, or a blended amount tied to vehicle usage.
In this market, the biggest gap drivers usually come from refresh cadence and price logic, since subscription ARPU can move quickly with feature bundles and contract renewals, and currency timing can swing multi-region totals. By keeping exchange-rate timing consistent and re-validating ASP and attach-rate assumptions against recent operator contract feedback and fleet scale signals, Mordor Intelligence reduces drift that can happen when older price points or mixed scopes are carried forward.
Benchmark comparison
| Source | Market Size | Gaps in Research Methodology |
|---|---|---|
| Mordor Intelligence | USD 19.11 B (2026) | |
| Trade Journal A | USD 0.26 B (2023) | Uses an earlier base year and a narrower cut that appears closer to selected telematics functions and components, which limits recurring software and connectivity fees counted across operating models. |
| Industry Blog B | USD 4.25 B (2025) | Uses a broader shared mobility telematics umbrella and relies on simplified ASP escalation, which can understate or overstate the impact of renewal pricing, device refresh cycles, and regional mix. |
Overall, the spread is largely explained by base-year choice, exchange-rate timing, and whether recurring platform fees are fully included in annual revenue. When the scope stays tied to car sharing fleets and the pricing steps are made explicit, the final number is easier to trace back to fleet size, penetration, and ARPU inputs that can be revisited each year.
Key Questions Answered in the Report
What is the current value of the car sharing telematics market?
The market stands at USD 19.11 billion in 2026 and is projected to grow to USD 35.63 billion by 2031, reflecting a 13.29% CAGR.
Which region leads revenue generation?
Europe accounts for 36.62% of global revenue, driven by stringent safety mandates and mature shared-mobility ecosystems.
Which car-sharing business model is growing fastest?
Peer-to-peer platforms are expected to post a 18.74% CAGR through 2031, despite free-floating models holding the largest current share.
How does electrification influence telematics requirements?
Battery-electric fleets require advanced telemetry for battery health, charge scheduling, and grid interaction, elevating hardware complexity and data-analytics needs.
What regulatory developments are most impactful?
The EU General Safety Regulation II and Next-Generation eCall mandates require advanced connected-safety systems, accelerating telematics penetration globally.
What is the main cost barrier for smaller operators?
Rising semiconductor and 5G-module prices push telematics hardware costs toward USD 1,200 per vehicle, pressuring capital budgets for fleet upgrades.