Canola Seed For Sowing Market Size and Share
Market Overview
| Study Period | 2018 - 2031 |
|---|---|
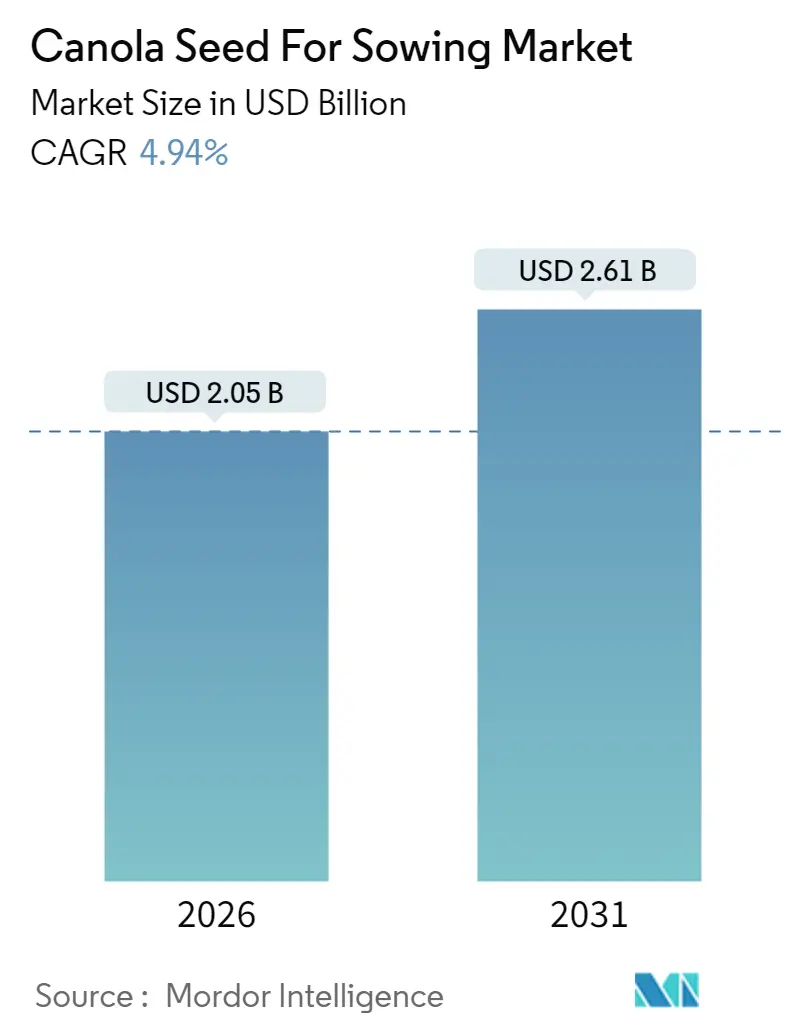
| Market Size (2026) | USD 2.05 Billion |
| Market Size (2031) | USD 2.61 Billion |
| Growth Rate (2026 - 2031) | 4.94% CAGR |
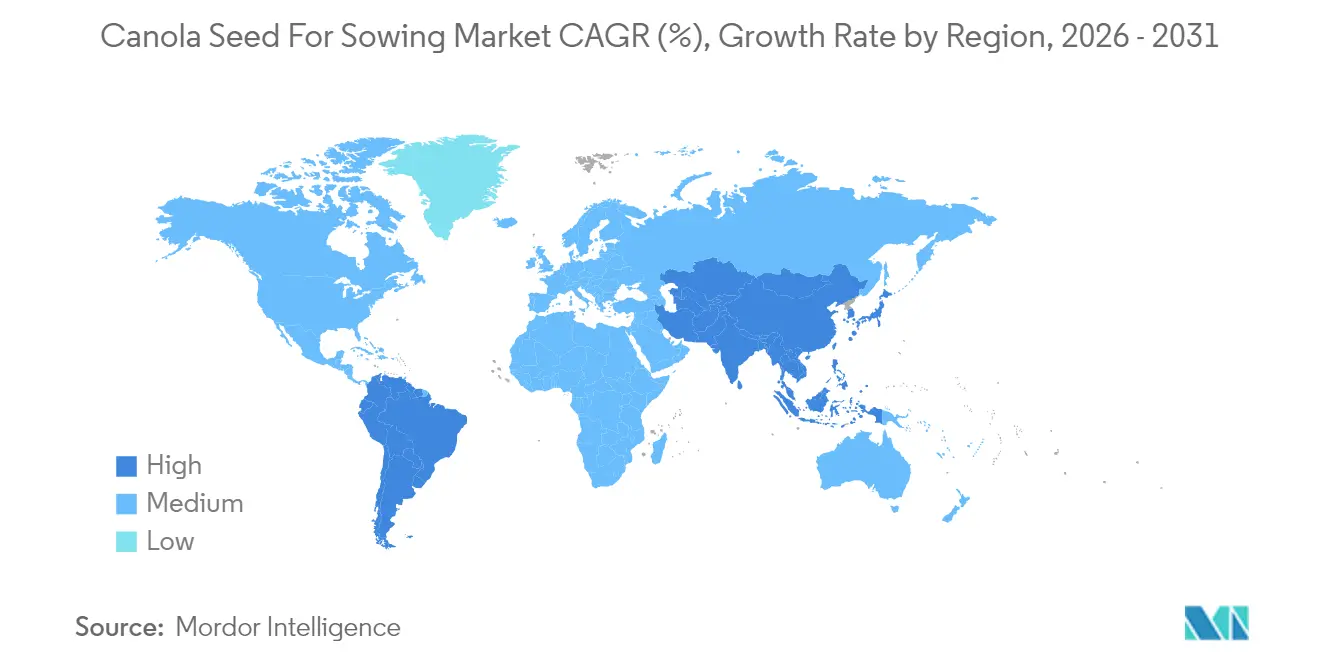
| Fastest Growing Market | South America |
| Largest Market | Asia Pacific |
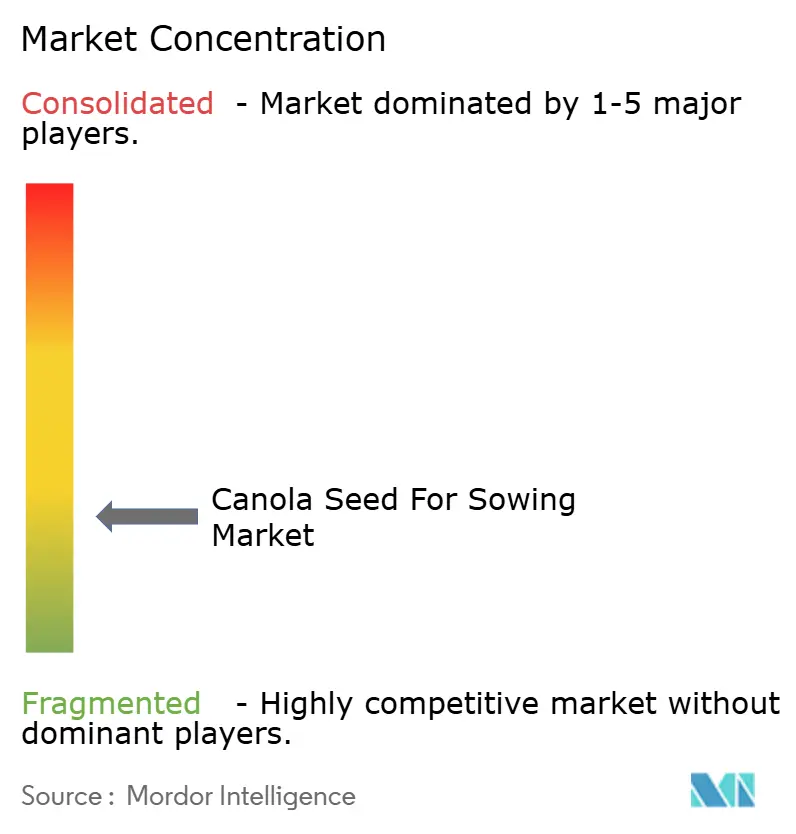
| Market Concentration | Low |
Major Players *Disclaimer: Major Players sorted in no particular order Image © Mordor Intelligence. Reuse requires attribution under CC BY 4.0. | |
Canola Seed For Sowing Market Analysis by Mordor Intelligence
The canola seed for sowing market was valued at USD 1.95 billion in 2025 and estimated to grow from USD 2.05 billion in 2026 to reach USD 2.61 billion by 2031, at a CAGR of 4.94% during the forecast period (2026-2031). Demand builds on growers’ preference for hybrids that yield 15-20% more than open-pollinated types, the rapid rollout of herbicide-tolerant and disease-resistant traits, and policy incentives that reward low-carbon oilseed production. Rising renewable diesel capacity, expanding processor off-take agreements, and aggressive hybrid breeding investments further anchor growth momentum. In parallel, regulatory clarity in Canada and Australia accelerates the entry of CRISPR-enabled varieties, while delayed approvals in the European Union and China restrain the speed of global trait launches.
Key Report Takeaways
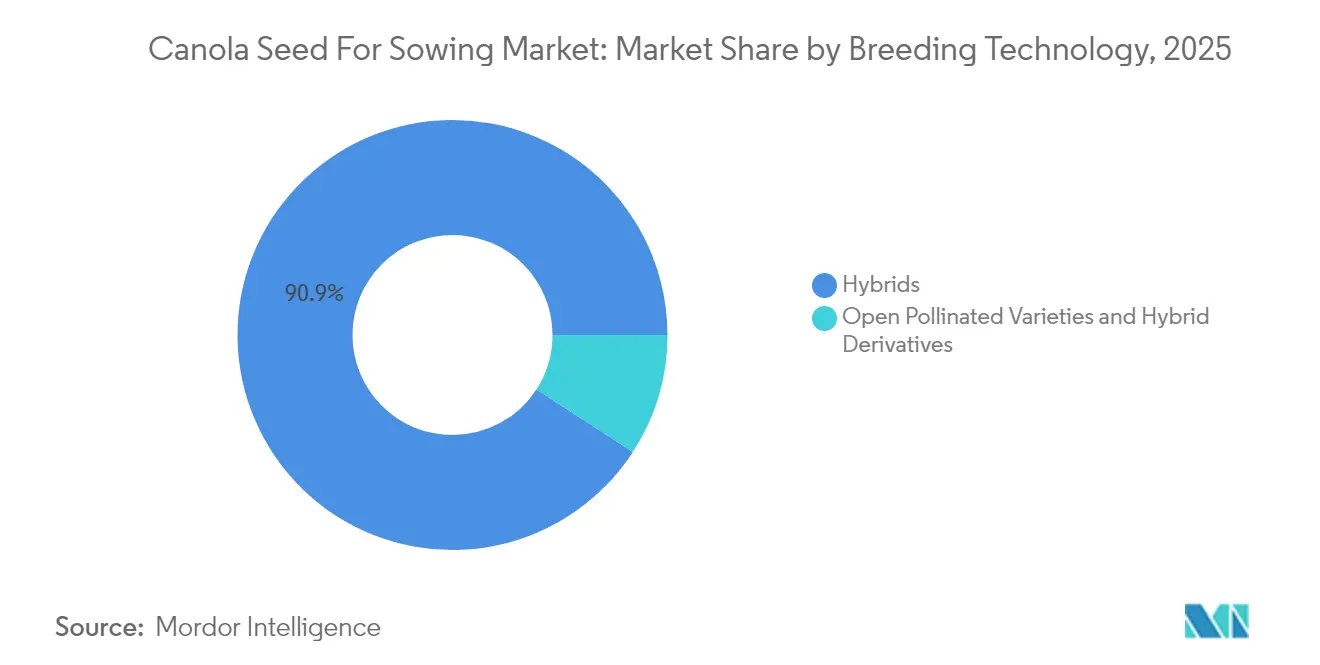
- By breeding technology, hybrids commanded 90.85% of the canola seed for sowing market share in 2025 and will advance at a 5.12% CAGR through 2031.
- By geography, the Asia-Pacific region held 29.15% of the canola seed for sowing market share in 2025, and South America is poised to expand at a 6.45% CAGR between 2026 and 2031.
Note: Market size and forecast figures in this report are generated using Mordor Intelligence’s proprietary estimation framework, updated with the latest available data and insights as of January 2026.
Global Canola Seed For Sowing Market Trends and Insights
Drivers Impact Analysis
| Driver | (~) % Impact on CAGR Forecast | Geographic Relevance | Impact Timeline |
|---|---|---|---|
| Rapid adoption of hybrid seed in high-input regions | +1.2% | North America and Europe | Medium term (2-4 years) |
| Wider commercial release of new herbicide-tolerant traits | +0.9% | Global, strongest in the Americas | Short term (≤ 2 years) |
| Yield-boosting gene-editing breakthroughs entering pipelines | +0.8% | North America and Australia, expanding to Asia | Long term (≥ 4 years) |
| Government carbon-credit programs rewarding low-carbon oilseeds | +0.6% | North America and the European Union | Medium term (2-4 years) |
| Soil-health premiums from regenerative farming contracts | +0.4% | North America, emerging in Europe | Long term (≥ 4 years) |
| Corporate off-take agreements from biodiesel refiners | +0.5% | Global, concentrated in the Americas and the European Union | Short term (≤ 2 years) |
| Source: Mordor Intelligence | |||
Rapid Adoption of Hybrid Seed in High-Input Regions
Hybrid canola adoption accelerates as growers recognize the economic advantage of 18% yield improvements over open-pollinated varieties, particularly in high-input farming systems where additional seed costs represent a marginal expense relative to total production investments. BASF's launched of InVigor Gold Brassica juncea hybrids with LibertyLink tolerance in 2024 exemplifies the industry's push toward species diversification to combat disease pressure while maintaining herbicide tolerance benefits. The University of Alberta's genetic diversity research partnership with Bayer, initiated in April 2024, focuses on expanding the genetic base of hybrid canola to sustain yield gains amid evolving pathogen landscapes. This trend gains momentum in regions where input costs remain manageable relative to commodity prices, creating a self-reinforcing cycle of technology adoption that drives premium seed demand.
Wider Commercial Release of New Herbicide-Tolerant Traits
Post-patent expiration of original LibertyLink technology opens opportunities for multi-gene tolerance stacks that provide growers with expanded herbicide options while seed companies capture value through trait licensing. Bayer's TruFlex trait system, combining glyphosate and dicamba tolerance, gained regulatory approval in multiple jurisdictions during 2024, enabling broader commercial deployment across diverse cropping systems. The competitive dynamics shift as multiple companies develop competing tolerance platforms, reducing dependence on single-trait systems while providing growers with rotation flexibility to manage herbicide resistance. This proliferation of tolerance options creates market fragmentation that benefits growers through competitive pricing while challenging seed companies to differentiate through trait performance and stewardship programs.
Yield-Boosting Gene-Editing Breakthroughs Entering Pipelines
CRISPR-Cas9 applications in canola breeding demonstrate measurable yield improvements through targeted modifications that enhance pod-shatter resistance, oil content, and disease tolerance without introducing foreign DNA sequences. Research published in 2024 shows successful disruption of the TT8 gene using CRISPR technology, resulting in yellow-seeded canola with improved meal quality and reduced fiber content. The technology's precision enables simultaneous modification of multiple traits within single breeding cycles, accelerating variety development timelines from 8-10 years to 5-6 years for commercial release. Regulatory acceptance varies significantly by jurisdiction, with Canada and Australia providing clearer pathways for gene-edited varieties compared to the European Union's more restrictive framework, creating geographic disparities in technology deployment.
Government Carbon-Credit Programs Rewarding Low-Carbon Oilseeds
Carbon credit mechanisms increasingly recognize canola's role in sustainable crop rotations and renewable fuel feedstock production, with programs offering USD 25-35 per metric ton premiums for verified low-carbon oilseed production in 2024 [1]Source: Government of Canada, “Federal Carbon Pricing System,” canada.ca. Canada's federal carbon pricing system and provincial programs provide direct incentives for canola cultivation in rotation with cereals, recognizing the crop's nitrogen fixation benefits and soil health improvements. The California Low Carbon Fuel Standard's 2024 amendments expand credit opportunities for canola-based biodiesel, creating market premiums that flow back to seed demand through processor contracting. These policy mechanisms create long-term demand visibility that encourages seed company investments in sustainable production technologies and grower adoption of climate-smart practices.
Restraints Impact Analysis
| Restraint | (~) % Impact on CAGR Forecast | Geographic Relevance | Impact Timeline |
|---|---|---|---|
| Accelerating blackleg and clubroot pathogen pressure | -0.8% | Global, severe in Canada and Australia | Short term (≤ 2 years) |
| Regulatory delays for gene-edited trait approvals | -0.6% | The European Union and China primarily | Medium term (2-4 years) |
| Farmer concern over seed-royalty cost escalation | -0.4% | Global, acute in price-sensitive regions | Short term (≤ 2 years) |
| Competitive acreage shift toward soybean in the Americas | -0.5% | South America and the southern United States | Medium term (2-4 years) |
| Source: Mordor Intelligence | |||
Accelerating Blackleg and Clubroot Pathogen Pressure
Evolving pathogen races of Leptosphaeria maculans (blackleg) and Plasmodiophora brassicae (clubroot) overcome existing resistance genes faster than breeding programs can deploy new sources, creating yield losses that erode hybrid seed value propositions. Research from the University of Alberta documents new clubroot pathotypes that defeat previously effective resistance genes, forcing growers to extend crop rotations or accept yield penalties that reduce canola profitability [2]Source: Plant Disease Journal, “Clubroot Pathotype Evolution Research,” apsnet.org. The pathogen evolution cycle accelerates in intensive canola production regions where short rotations and continuous cultivation create selection pressure for virulent strains. This biological arms race requires continuous investment in resistance gene discovery and deployment, increasing breeding costs while shortening the commercial lifespan of resistant varieties, ultimately constraining market growth in heavily affected regions.
Regulatory Delays for Gene-Edited Trait Approvals
Divergent regulatory frameworks for gene-edited crops create approval bottlenecks that delay the introduction of next-generation canola varieties, particularly in the European Union, where gene-edited crops face similar scrutiny to transgenic varieties. The European Food Safety Authority's case-by-case evaluation process extends approval timelines to 3-5 years compared to 12-18 months in Canada and Australia, creating market access disparities that limit global variety development. China's regulatory uncertainty regarding gene-edited crops compounds market access challenges for seed companies developing varieties for global deployment. These regulatory inconsistencies force companies to develop region-specific breeding strategies, increasing development costs while limiting the scale economies that drive innovation investments in the sector.
Segment Analysis
By Breeding Technology: Hybrid Dominance Reshapes Variety Landscape
Hybrids captured 90.85% of the canola seed for sowing market share in 2025 and will grow at a 5.12% CAGR through 2031, driven by consistent yield advantages of 15-20% over open-pollinated varieties and superior uniformity that facilitates mechanized harvest. Gene-editing technologies accelerate hybrid development timelines while expanding the genetic base available for commercial breeding programs, with CRISPR applications enabling precise modifications that enhance hybrid performance without regulatory complexities associated with transgenic approaches. Within the hybrid segment, transgenic hybrids dominate with herbicide-tolerant traits representing the largest subsegment, while non-transgenic hybrids gain traction in export markets with restrictive import policies.
Within the hybrids category, non-transgenic hybrids have emerged as the preferred choice globally, particularly in regions with restrictions on GM (Genetically modified) crop cultivation and a growing consumer preference for non-GMO (Genetically modified) food products. The segment's robust growth trajectory is supported by continuous innovation in breeding technologies, leading to the development of varieties with multiple beneficial traits such as elevated oil content, advanced herbicide tolerance, and broader adaptability to diverse growing conditions. The increasing adoption of hybrid seeds by commercial farmers, particularly in major producing regions like Canada, China, and Europe, further reinforces this segment's market leadership. The role of commercial seed production and seed multiplication processes is crucial in sustaining the supply chain for these high-demand hybrids.
Note: Segment shares of all individual segments available upon report purchase
Geography Analysis
Asia-Pacific's 29.15% of the canola seed for sowing market share in 2025 reflects China's position as the world's largest canola seed importer at 5.36 million metric tons in 2024, primarily sourced from Canada, Australia, and Ukraine to supply domestic crushing capacity that exceeds 40 million metric tons annually. Australia's record 6.2 million metric tons production in 2024 demonstrates the region's production capability, supported by favorable weather conditions and strong export demand from Asian markets seeking high-quality oilseed. India's mustard and rapeseed production, around 11-12 million metric tons in 2024, creates domestic seed demand, though regulatory challenges with genetically modified varieties limit technology adoption compared to other major producing regions. The region's growth potential faces constraints from China's regulatory uncertainty regarding gene-edited crops and India's complex approval processes for biotechnology traits, creating market access barriers for international seed companies with advanced trait portfolios.
South America's 6.45% CAGR through 2031 positions it as the fastest-growing region, driven by Argentina's established canola production base of 1.5-2 million hectares and Brazil's expanding winter canola adoption in southern states as a rotation crop with soybeans in 2024. Argentina's export-oriented production model benefits from strong demand in Asian markets, particularly China, while Brazil's domestic biodiesel mandate creates local demand for canola oil that supports processing investments. The region's competitive advantage stems from favorable growing conditions, established agricultural infrastructure, and government policies supporting crop diversification and sustainable agriculture practices. Economic volatility and currency fluctuations create challenges for seed companies operating in these markets, requiring flexible pricing strategies and local partnerships to maintain market presence.
North America and Europe maintain mature markets characterized by high hybrid adoption rates and sophisticated trait deployment, though regulatory divergence creates market access disparities for gene-edited varieties. Europe's regulatory restrictions on gene-edited crops limit access to next-generation breeding technologies, creating competitive disadvantages relative to regions with science-based approval systems. The regulatory influence of the European Food Safety Authority extends approval timelines for biotechnology traits, constraining innovation deployment and market growth potential compared to more permissive regulatory environments in North America and Australia.
Competitive Landscape
The canola seed for sowing market exhibits a fragmented structure with a mix of global agricultural conglomerates and regional specialists. Global giants like Bayer AG, Corteva Agriscience, BASF SE, Nufarm Limited, and Euralis Semences are leveraging their extensive research capabilities and worldwide distribution networks to maintain market leadership, particularly in North America and Europe. Regional players, especially in Asia-Pacific, maintain strong positions in their local markets through a deep understanding of farmer needs and established distribution channels. The market also sees participation from specialized seed companies focusing exclusively on oilseed crops, which compete through technical expertise and customized solutions.
The seed production industry is witnessing ongoing consolidation through strategic acquisitions and partnerships, particularly in key growing regions. Large agricultural companies are acquiring smaller, specialized seed businesses to expand their product portfolios and geographical reach. Joint ventures between international and local players are becoming more common, especially in emerging markets, combining global technical expertise with local market knowledge. This consolidation trend is particularly evident in developed markets where economies of scale in research and development are crucial for maintaining competitiveness.
Success in the canola seed for sowing market increasingly depends on companies' ability to develop innovative varieties addressing specific regional challenges while maintaining consistent quality. Market leaders are focusing on building comprehensive product portfolios that cater to diverse growing conditions and end-user requirements. Investment in advanced breeding technologies, particularly for developing climate-resilient varieties, is becoming crucial for maintaining market position. Companies are also strengthening their distribution networks and technical support services to build stronger relationships with farmers and ensure proper product placement.
Canola Seed For Sowing Industry Leaders
Bayer AG
Corteva Agriscience
BASF SE
Euralis Semences
Nufarm Limited
- *Disclaimer: Major Players sorted in no particular order
Recent Industry Developments
- October 2024: Bayer acquired HyTech's canola seed treating and packaging facility in Coaldale, Alberta, expanding its Canadian operations and enhancing seed treatment capabilities for InVigor hybrid varieties. The acquisition strengthens Bayer's supply chain integration in Western Canada's primary canola production region
- July 2023: Pacific Seeds, a subsidiary of Advanta Seeds, introduced two new canola hybrid varieties, Hyola Defender CT and Hayola Continuum CL, to the Australian market. These varieties offer high-yield performance, strong disease resistance, elevated oil content, and enhanced weed control flexibility.
- March 2023: Corteva Agriscience, Chevron U.S.A. Inc., and Bunge came together for a commercial collaboration to develop winter canola hybrids that produce plant-based oil with a lower carbon profile.
Global Canola Seed For Sowing Market Report Scope
Hybrids, Open Pollinated Varieties & Hybrid Derivatives are covered as segments by Breeding Technology. Africa, Asia-Pacific, Europe, Middle East, North America, South America are covered as segments by Region.| Hybrids | Non-Transgenic Hybrids | |
| Transgenic Hybrids | Herbicide Tolerant Hybrids | |
| Insect Resistant Hybrids | ||
| Open Pollinated Varieties & Hybrid Derivatives | ||
| Africa | By Breeding Technology | |
| By Country | Egypt | |
| Ethiopia | ||
| Ghana | ||
| Kenya | ||
| Nigeria | ||
| South Africa | ||
| Tanzania | ||
| Rest of Africa | ||
| Asia-Pacific | By Breeding Technology | |
| Australia | ||
| Bangladesh | ||
| China | ||
| India | ||
| Indonesia | ||
| Japan | ||
| Myanmar | ||
| Philippines | ||
| Thailand | ||
| Vietnam | ||
| Rest of Asia-Pacific | ||
| Europe | By Breeding Technology | |
| France | ||
| Germany | ||
| Italy | ||
| Netherlands | ||
| Poland | ||
| Romania | ||
| Russia | ||
| Spain | ||
| Turkey | ||
| Ukraine | ||
| United Kingdom | ||
| Rest of Europe | ||
| Middle East | By Breeding Technology | |
| Iran | ||
| North America | By Breeding Technology | |
| Canada | ||
| Mexico | ||
| United States | ||
| South America | By Breeding Technology | |
| Argentina | ||
| Brazil | ||
| Rest of South America | ||
| Breeding Technology | Hybrids | Non-Transgenic Hybrids | |
| Transgenic Hybrids | Herbicide Tolerant Hybrids | ||
| Insect Resistant Hybrids | |||
| Open Pollinated Varieties & Hybrid Derivatives | |||
| Geography | Africa | By Breeding Technology | |
| By Country | Egypt | ||
| Ethiopia | |||
| Ghana | |||
| Kenya | |||
| Nigeria | |||
| South Africa | |||
| Tanzania | |||
| Rest of Africa | |||
| Asia-Pacific | By Breeding Technology | ||
| Australia | |||
| Bangladesh | |||
| China | |||
| India | |||
| Indonesia | |||
| Japan | |||
| Myanmar | |||
| Philippines | |||
| Thailand | |||
| Vietnam | |||
| Rest of Asia-Pacific | |||
| Europe | By Breeding Technology | ||
| France | |||
| Germany | |||
| Italy | |||
| Netherlands | |||
| Poland | |||
| Romania | |||
| Russia | |||
| Spain | |||
| Turkey | |||
| Ukraine | |||
| United Kingdom | |||
| Rest of Europe | |||
| Middle East | By Breeding Technology | ||
| Iran | |||
| North America | By Breeding Technology | ||
| Canada | |||
| Mexico | |||
| United States | |||
| South America | By Breeding Technology | ||
| Argentina | |||
| Brazil | |||
| Rest of South America | |||
Market Definition
- Commercial Seed - For the purpose of this study, only commercial seeds have been included as part of the scope. Farm-saved Seeds, which are not commercially labeled are excluded from scope, even though a minor percentage of farm-saved seeds are exchanged commercially among farmers. The scope also excludes vegetatively reproduced crops and plant parts, which may be commercially sold in the market.
- Crop Acreage - While calculating the acreage under different crops, the Gross Cropped Area has been considered. Also known as Area Harvested, according to the Food & Agricultural Organization (FAO), this includes the total area cultivated under a particular crop across seasons.
- Seed Replacement Rate - Seed Replacement Rate is the percentage of area sown out of the total area of crop planted in the season by using certified/quality seeds other than the farm-saved seed.
- Protected Cultivation - The report defines protected cultivation as the process of growing crops in a controlled environment. This includes greenhouses, glasshouses, hydroponics, aeroponics, or any other cultivation system that protects the crop against any abiotic stress. However, cultivation in an open field using plastic mulch is excluded from this definition and is included under open field.
| Keyword | Definition |
|---|---|
| Row Crops | These are usually the field crops which include the different crop categories like grains & cereals, oilseeds, fiber crops like cotton, pulses, and forage crops. |
| Solanaceae | These are the family of flowering plants which includes tomato, chili, eggplants, and other crops. |
| Cucurbits | It represents a gourd family consisting of about 965 species in around 95 genera. The major crops considered for this study include Cucumber & Gherkin, Pumpkin and squash, and other crops. |
| Brassicas | It is a genus of plants in the cabbage and mustard family. It includes crops such as carrots, cabbage, cauliflower & broccoli. |
| Roots & Bulbs | The roots and bulbs segment includes onion, garlic, potato, and other crops. |
| Unclassified Vegetables | This segment in the report includes the crops which don’t belong to any of the above-mentioned categories. These include crops such as okra, asparagus, lettuce, peas, spinach, and others. |
| Hybrid Seed | It is the first generation of the seed produced by controlling cross-pollination and by combining two or more varieties, or species. |
| Transgenic Seed | It is a seed that is genetically modified to contain certain desirable input and/or output traits. |
| Non-Transgenic Seed | The seed produced through cross-pollination without any genetic modification. |
| Open-Pollinated Varieties & Hybrid Derivatives | Open-pollinated varieties produce seeds true to type as they cross-pollinate only with other plants of the same variety. |
| Other Solanaceae | The crops considered under other Solanaceae include bell peppers and other different peppers based on the locality of the respective countries. |
| Other Brassicaceae | The crops considered under other brassicas include radishes, turnips, Brussels sprouts, and kale. |
| Other Roots & Bulbs | The crops considered under other roots & bulbs include Sweet Potatoes and cassava. |
| Other Cucurbits | The crops considered under other cucurbits include gourds (bottle gourd, bitter gourd, ridge gourd, Snake gourd, and others). |
| Other Grains & Cereals | The crops considered under other grains & cereals include Barley, Buck Wheat, Canary Seed, Triticale, Oats, Millets, and Rye. |
| Other Fibre Crops | The crops considered under other fibers include Hemp, Jute, Agave fibers, Flax, Kenaf, Ramie, Abaca, Sisal, and Kapok. |
| Other Oilseeds | The crops considered under other oilseeds include Ground nut, Hempseed, Mustard seed, Castor seeds, safflower seeds, Sesame seeds, and Linseeds. |
| Other Forage Crops | The crops considered under other forages include Napier grass, Oat grass, White clover, Ryegrass, and Timothy. Other forage crops were considered based on the locality of the respective countries. |
| Pulses | Pigeon peas, Lentils, Broad and horse beans, Vetches, Chickpeas, Cowpeas, Lupins, and Bambara beans are the crops considered under pulses. |
| Other Unclassified Vegetables | The crops considered under other unclassified vegetables include Artichokes, Cassava Leaves, Leeks, Chicory, and String beans. |
Research Methodology
Mordor Intelligence follows a four-step methodology in all our reports.
- Step-1: IDENTIFY KEY VARIABLES: In order to build a robust forecasting methodology, the variables and factors identified in Step-1 are tested against available historical market numbers. Through an iterative process, the variables required for market forecast are set and the model is built on the basis of these variables.
- Step-2: Build a Market Model: Market-size estimations for the forecast years are in nominal terms. Inflation is not a part of the pricing, and the average selling price (ASP) is kept constant throughout the forecast period.
- Step-3: Validate and Finalize: In this important step, all market numbers, variables and analyst calls are validated through an extensive network of primary research experts from the market studied. The respondents are selected across levels and functions to generate a holistic picture of the market studied.
- Step-4: Research Outputs: Syndicated Reports, Custom Consulting Assignments, Databases, and Subscription Platforms


