Business Productivity Software Market Size and Share
Market Overview
| Study Period | 2020 - 2031 |
|---|---|
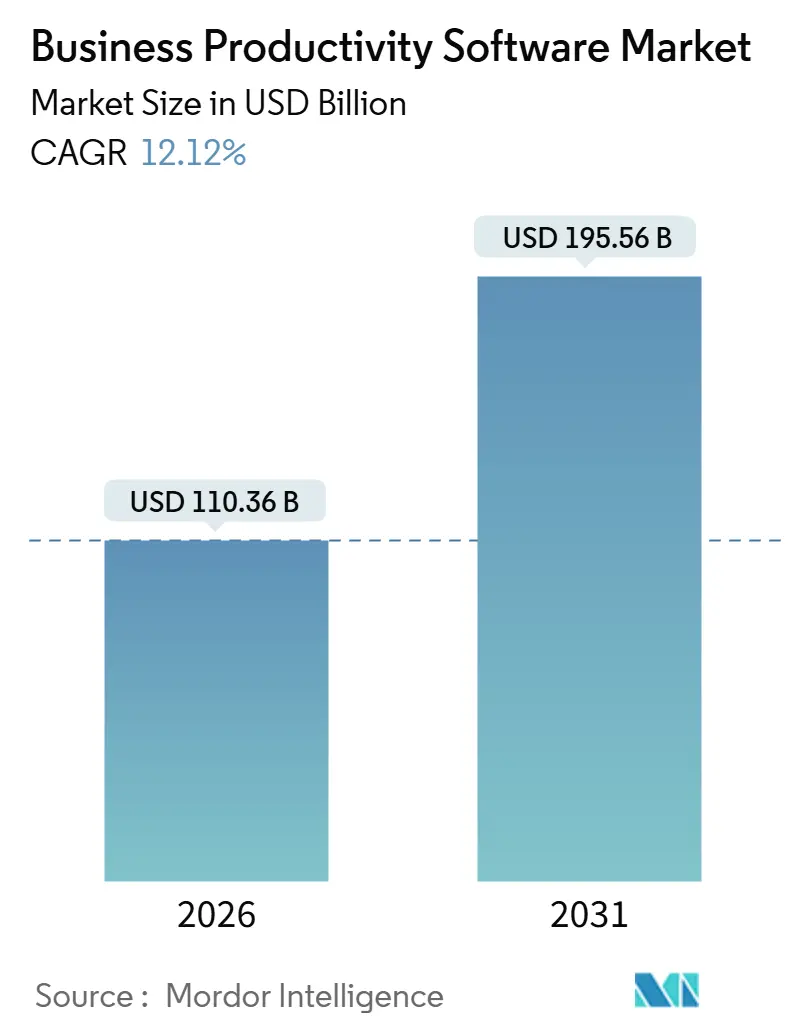
| Market Size (2026) | USD 110.36 Billion |
| Market Size (2031) | USD 195.56 Billion |
| Growth Rate (2026 - 2031) | 12.12% CAGR |
| Fastest Growing Market | Asia Pacific |
| Largest Market | North America |
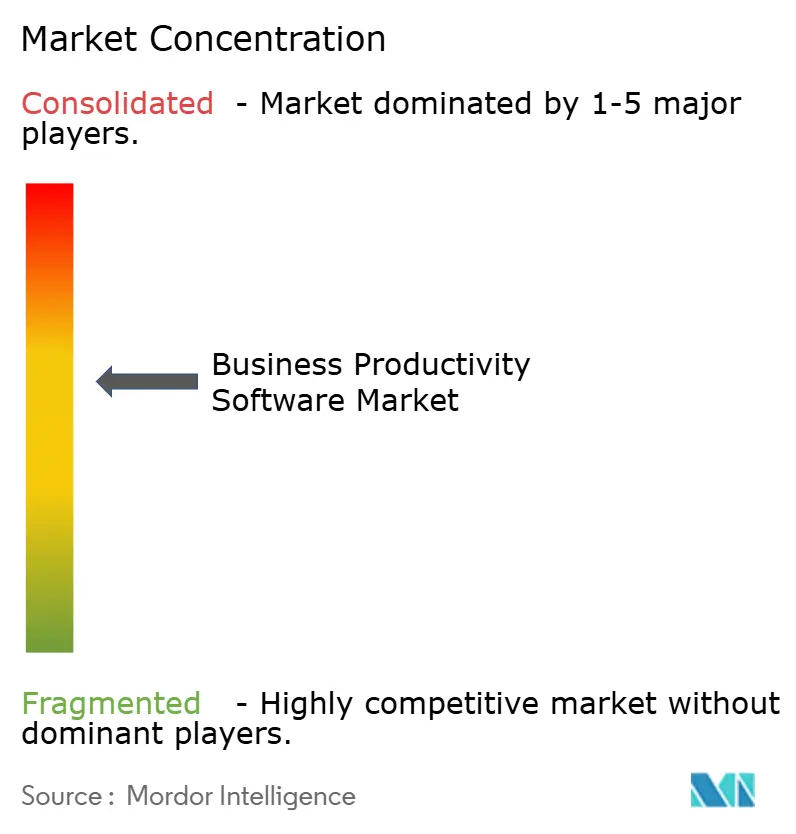
| Market Concentration | Medium |
Major Players *Disclaimer: Major Players sorted in no particular order Image © Mordor Intelligence. Reuse requires attribution under CC BY 4.0. | |
Business Productivity Software Market Analysis by Mordor Intelligence
The business productivity software market size stood at USD 110.36 billion in 2026 and is projected to reach USD 195.56 billion by 2031, reflecting a 12.12% CAGR over the forecast period. Demand is accelerating as generative-AI capabilities become default features, hybrid-work compliance rules push organizations to modern collaboration suites, and consumption-based licensing unlocks upgrade cycles among small and medium enterprises (SMEs). Vendors that operate at hyperscale are embedding large language models, shifting buyer expectations toward AI-native experiences that automate meeting summaries, document drafting, and cross-application insights. The transition from perpetual to usage-based pricing is lowering entry barriers for first-time adopters, while zero-trust security frameworks codified by governments turn managed SaaS into the lowest-risk deployment option. At the same time, vertical-specific platforms target regulated industries with pre-configured compliance workflows, intensifying competition for best-of-breed differentiation.
Key Report Takeaways
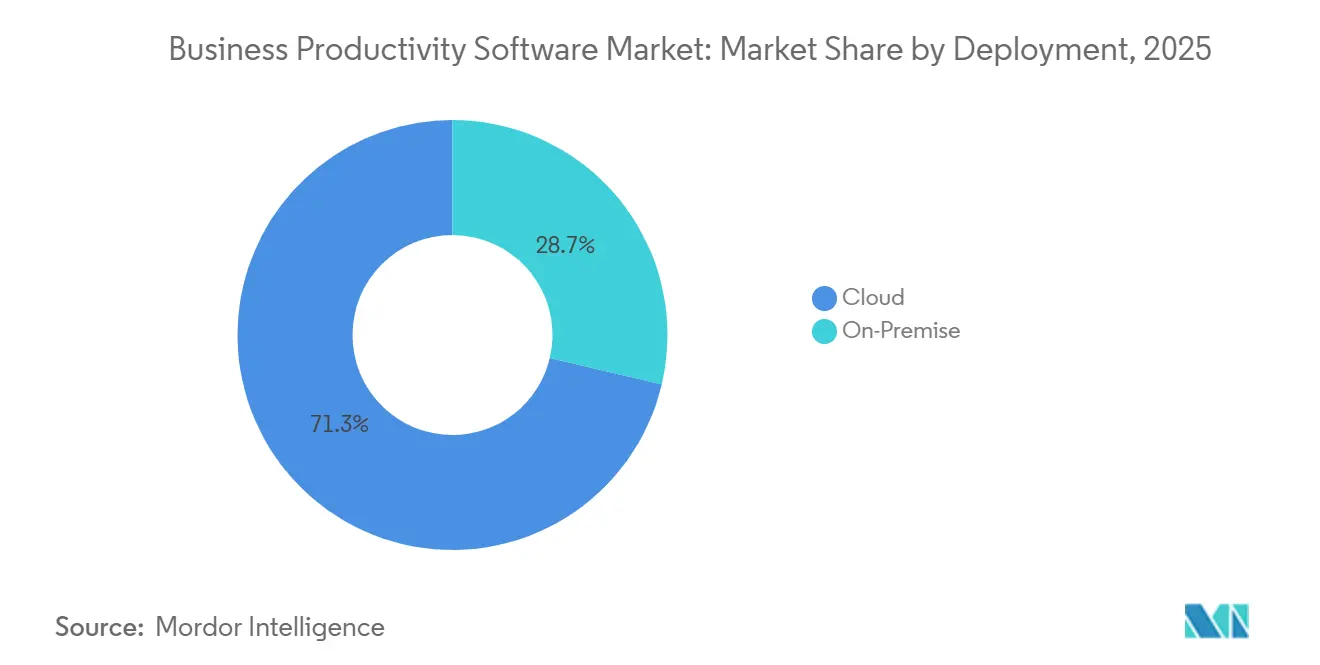
- By deployment, cloud architectures led with 71.31% of business productivity software market share in 2025 and are forecast to expand at a 13.12% CAGR through 2031.
- By organization size, large enterprises held 52.36% of the business productivity software market in 2025, while SMEs are projected to record a 14.23% CAGR through 2031.
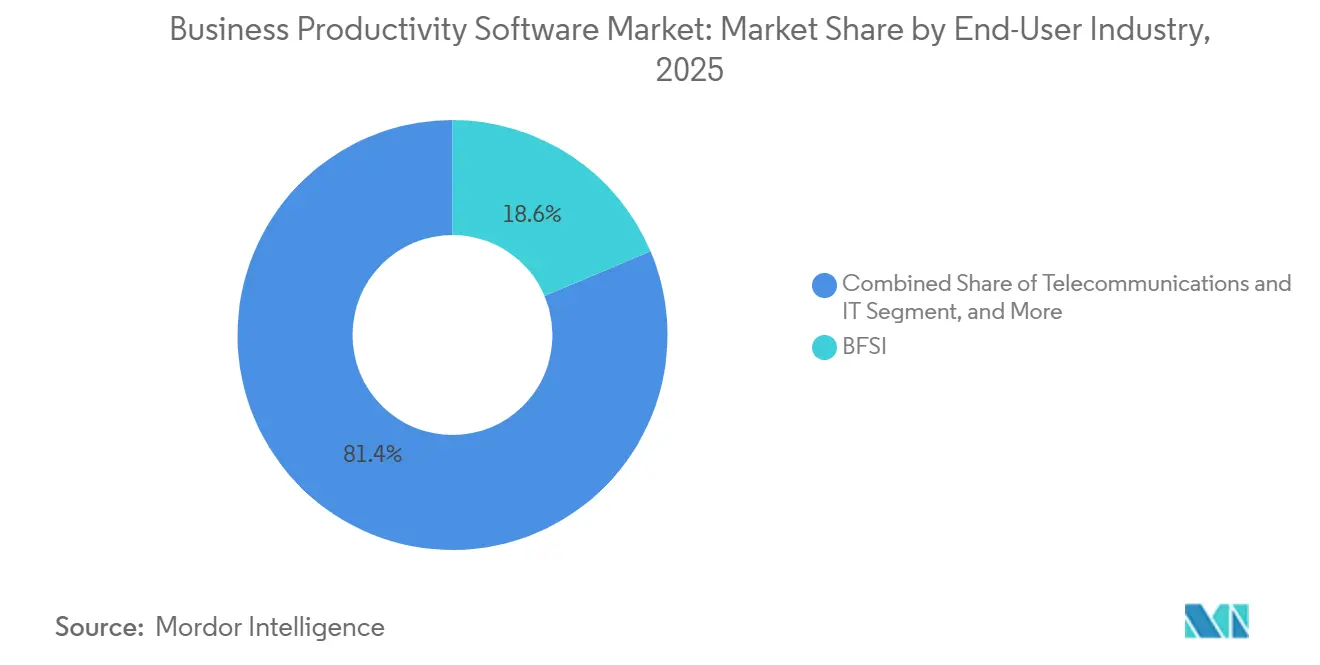
- By end-user industry, banking, financial services, and insurance commanded 18.63% revenue share in 2025; healthcare and life sciences are advancing at a 15.32% CAGR through 2031.
- By solution type, content collaboration and document management captured 22.41% of the business productivity software market size in 2025, whereas low-code and no-code platforms are poised to expand at a 16.72% CAGR to 2031.
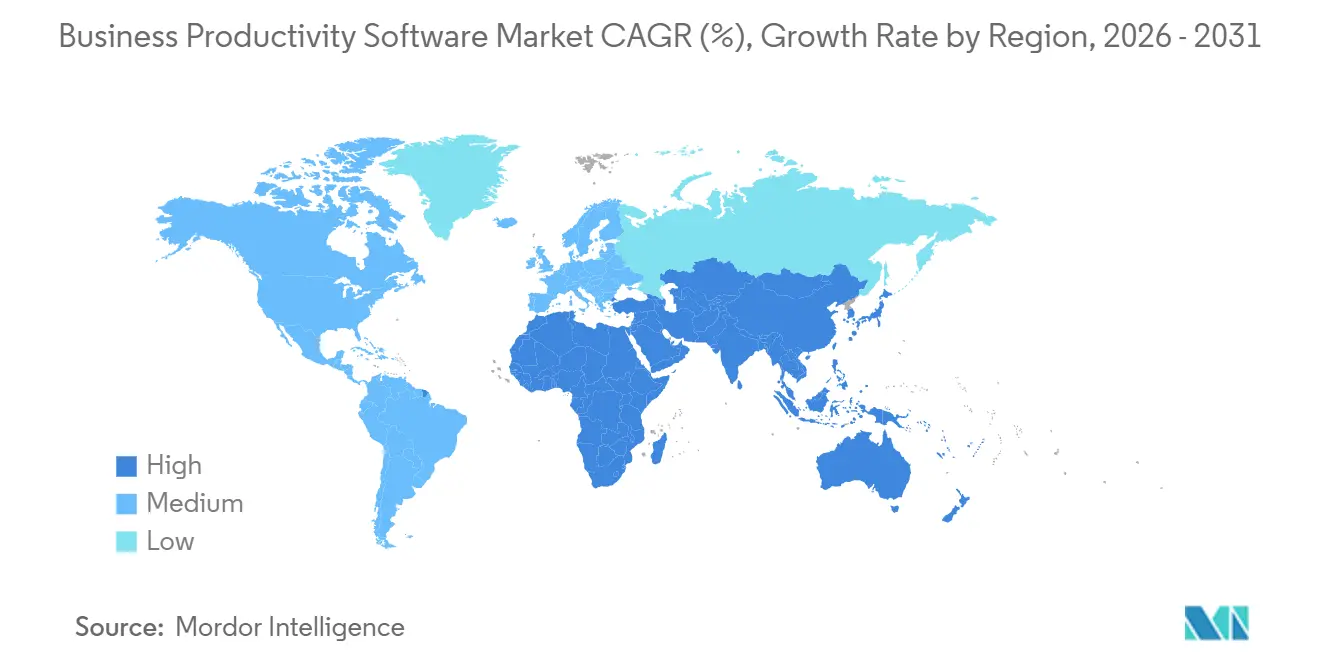
- By geography, North America accounted for 39.87% share of the business productivity software market in 2025 and Asia Pacific is projected to grow at a 14.83% CAGR through 2031.
Note: Market size and forecast figures in this report are generated using Mordor Intelligence’s proprietary estimation framework, updated with the latest available data and insights as of January 2026.
Global Business Productivity Software Market Trends and Insights
Drivers Impact Analysis*
| Driver | (~) % Impact on CAGR Forecast | Geographic Relevance | Impact Timeline |
|---|---|---|---|
| Cloud-First SaaS Adoption Across Line-Of-Business Apps | +2.8% | Global, with acceleration in North America and Europe | Medium term (2-4 years) |
| Proliferation Of Gen-AI Copilots Embedded In Productivity Suites | +2.5% | North America and Europe lead; Asia Pacific following rapidly | Short term (≤ 2 years) |
| Hybrid-Work Tooling Mandates In Global Compliance Standards | +1.8% | Global, with emphasis on United States federal agencies and European Union member states | Medium term (2-4 years) |
| Vertical-Specific Low-Code Work Platforms For Frontline Workers | +1.6% | Global, with strong uptake in manufacturing hubs (Germany, China, United States) | Long term (≥ 4 years) |
| Ecosystem Shift To Usage-Based Pricing Unlocking SMB Upgrade Cycles | +1.4% | Global, particularly impactful in Asia Pacific and South America SMB segments | Medium term (2-4 years) |
| Zero-Friction API-First Extensibility Ecosystems For Cross-Suite Workflows | +1.2% | North America and Europe enterprise segments | Long term (≥ 4 years) |
| Source: Mordor Intelligence | |||
Cloud-First SaaS Adoption Across Line-of-Business Apps
Organizations continue to retire on-premises infrastructure in favor of SaaS solutions that deliver continuous feature updates, elastic capacity, and integrated security. Microsoft disclosed USD 136 billion in commercial cloud revenue in 2024, underscoring the scale of enterprises' workload shifts.[1]Microsoft Corporation, “Investor Relations,” microsoft.com Financial institutions see SaaS as a pathway to meet digital operational resilience obligations without overhauling internal data center controls. Standardized cloud security frameworks such as ISO/IEC 27017 shorten vendor due diligence cycles, further accelerating procurement. As hyperscalers bundle compute-intensive AI services into subscription tiers, the total cost of ownership gap relative to on-premises deployments widens. Migration patterns increasingly favor lift-and-shift for collaboration workloads first, followed by phased retirement of legacy content management systems once data-classification hurdles are cleared.
Proliferation of Gen-AI Copilots Embedded in Productivity Suites
Generative-AI assistants have moved from pilot projects to core interfaces that streamline everyday tasks. Microsoft 365 Copilot reached general availability in late 2023, offering context-aware drafting, summarization, and analysis across Outlook, Teams, and Word. Google answered with Gemini for Workspace in early 2024, embedding multimodal models into Gmail and Docs. Early adopters report 25-30% time savings on routine correspondence, though usage is highest among knowledge workers in finance and legal professions. The European Union AI Act classifies in-workplace AI as high-risk, driving vendors to incorporate transparency and human-oversight features by design. As competition centers on model quality and latency, hyperscalers are investing in GPU capacity, giving cloud-native suites a performance edge that standalone point solutions struggle to match.
Hybrid-Work Tooling Mandates in Global Compliance Standards
Public-sector and regulated industries must now document secure remote-work practices, fueling demand for unified-communications platforms with audit-ready controls. The U.S. Office of Personnel Management issued telework guidelines in 2023 that require federal agencies to deploy approved collaboration tools with end-to-end encryption. The UK Information Commissioner’s Office followed with monitoring guidance in 2024, pushing employers toward transparent surveillance policies. Enterprises respond by consolidating onto suites that integrate data-loss prevention, insider-risk management, and zero-trust identity frameworks defined by NIST SP 800-207. Vendors that cannot offer native controls face longer sales cycles as buyers weigh third-party add-ons versus integrated platforms.
Vertical-Specific Low-Code Work Platforms for Frontline Workers
Manufacturers, retailers, and logistics providers are empowering citizen developers to digitize shop-floor processes through drag-and-drop automation. Mendix reported that 70% of new customers in 2024 were integrating the platform with operational-technology sensors for real-time analytics. Microsoft Power Platform and ServiceNow App Engine offer pre-built connectors for industrial protocols, lowering integration barriers. Compliance frameworks such as ISO 9001 are embedded into templates, ensuring quality and safety standards without custom coding. Because frontline environments require offline functionality and rugged devices, providers that optimize for low-bandwidth scenarios gain a competitive edge. This driver is expected to sustain momentum over the long term as Industry 4.0 roadmaps mature.
Restraints Impact Analysis*
| Restraint | (~) % Impact on CAGR Forecast | Geographic Relevance | Impact Timeline |
|---|---|---|---|
| Cyber-Sovereignty Laws Restricting Cross-Border Data Residency | -1.5% | China, Russia, India, European Union | Medium term (2-4 years) |
| Rising SaaS Sprawl Driving Consolidation Fatigue And Licence Rationalisation | -1.3% | Global, with acute pressure in North America and Europe enterprise segments | Short term (≤ 2 years) |
| Scarcity Of Integration Talent Delaying Complex Workflow Roll-Outs | -0.9% | Global, most pronounced in North America and Western Europe | Long term (≥ 4 years) |
| Generative-AI Model Opacity Triggering Enterprise Risk-Control Freezes | -0.8% | North America and Europe financial services and healthcare verticals | Short term (≤ 2 years) |
| Source: Mordor Intelligence | |||
Cyber-Sovereignty Laws Restricting Cross-Border Data Residency
Governments now mandate local storage of citizen data, forcing vendors to replicate infrastructure and fragmenting global architectures. China’s personal information protection law bars cross-border transfers without security assessments.[2]Cyberspace Administration of China, “Personal Information Protection Law,” cac.gov.cn Russia requires in-country hosting for personal data, compelling foreign providers to partner with domestic clouds. India’s draft digital personal data protection bill is poised to impose similar restrictions. These rules inflate costs, reduce economies of scale, and can delay rollout of new AI features until local compliance reviews finish.
Rising SaaS Sprawl Driving Consolidation Fatigue and License Rationalization
Enterprises average more than 130 SaaS tools, leaving unused seats and integration overhead. Flexera’s 2024 State of the Cloud Report found that 32% of SaaS spend is wasted. CIOs are consolidating onto broader suites, favoring vendors that deliver communication, collaboration, analytics, and security under one contract. Microsoft reports longer enterprise agreement terms as customers negotiate volume discounts for multi-product bundles. Point-solution providers without adjacent modules face churn as finance teams scrutinize ROI and cut redundant licenses.
*Our forecasts treat driver/restraint impacts as directional, not additive. The impact forecasts reflect baseline growth, mix effects, and variable interactions.
Segment Analysis
By Deployment: Cloud Architectures Dominate Enterprise Roadmaps
Cloud-based offerings accounted for 71.31% share of the business productivity software market in 2025, capturing the majority of new spending as enterprises prioritize agility and predictable operating costs. This dominance is expected to extend, with the category projected to log a 13.12% CAGR through 2031. Vendors capitalize by embedding compute-intensive AI copilots that rely on hyperscale GPU infrastructure unavailable in most private data centers. Compliance readiness also favors managed SaaS, as frameworks such as FedRAMP authorize approved clouds for United States federal workloads.
Hybrid models serve as a stepping stone, allowing organizations to keep latency-sensitive or classified workloads on-premises while shifting collaboration suites to the cloud.


By Organisation Size: SMEs Accelerate Adoption Through Consumption Pricing
Large enterprises represented 52.36% share of the business productivity software market in 2025 revenue, reflecting complex global rollouts and multiyear support contracts. Yet SMEs are forecast to grow at 14.23% through 2031, outpacing their larger counterparts. Usage-based billing aligns costs with actual utilization, enabling smaller firms to scale seats incrementally without heavy upfront licensing outlays. In high-growth regions such as India and Vietnam, many SMEs are adopting productivity suites as their first enterprise IT investment, bypassing legacy servers entirely.[3]Ministry of Electronics and Information Technology, Government of India, “Digital India Initiatives,” meity.gov.in
Mid-market organizations face distinct needs, often seeking vertical templates that cut configuration effort. Salesforce Industry Clouds pre-bundle regulatory workflows, shortening deployment from months to weeks. Price-sensitive buyers are also gravitating toward bundled suites from Zoho that integrate CRM, project management, and collaboration at lower per-user rates. As competition intensifies, vendors differentiate through AI-powered automation and embedded analytics rather than pure feature count.
By End-User Industry: Healthcare Surges on Interoperability Mandates
Banking, financial services, and insurance (BFSI) held 18.63% share in 2025, driven by stringent reporting and operational resilience mandates. The healthcare and life sciences segment is, however, the fastest-growing vertical, forecast at a 15.32% CAGR through 2031. U.S. regulations now require electronic health records to expose APIs, enabling productivity tools to attach secure messaging, telehealth scheduling, and care-team coordination workflows directly inside clinical systems.
Manufacturing, telecommunications, and retail each contribute meaningful revenue as they digitize supply chains and field operations. Government agencies worldwide adopt zero-trust architectures, fueling demand for suites that pass stringent security assessments. Education, utilities, and transportation round out adoption, tailoring deployment models to bandwidth and compliance constraints in the business productivity software market.

By Solution Type: Low-Code Platforms Lead Growth Trajectory
Content collaboration and document management accounted for 22.41% of the market in 2025, but market expansion is skewing toward low-code automation tools, which are growing at a 16.72% CAGR. Citizen developers use drag-and-drop interfaces to build approval workflows and data-collection apps, reducing backlog pressure on central IT teams. Communication suites, while essential, are increasingly bundled with productivity licenses, putting pressure on standalone pricing.
Business intelligence is now delivered inside collaboration canvases, letting users query datasets without toggling to separate dashboards. Digital asset management converges with creative collaboration, especially for marketing teams working across distributed locations. Embedded security and compliance engines, informed by GDPR and other mandates, act as differentiators as buyers demand built-in governance rather than bolt-on modules of the solutions offered by the vendors in the business productivity software market.
Geography Analysis
North America controlled 39.87% of 2025 revenue, underpinned by high software budgets and mature cloud ecosystems in the business productivity software market. Federal zero-trust mandates accelerated the adoption of identity-centric security models, prompting agencies to migrate to suites offering continuous authorization. Canada’s public sector standardized on Microsoft 365 GCC High for protected-class data, demonstrating how national regulations reinforce vendor lock-in. Hyperscaler competition keeps pricing competitive, but feature velocity favors incumbents that invest in proprietary AI accelerators.
Europe advances steadily as the digital operational resilience act multiplies cybersecurity and incident-response requirements for financial services. Germany, France, and the United Kingdom deploy certification schemes that streamline public procurement of secure clouds. Russia’s localization law fragments the region, opening share for domestic vendors able to host data in-country. Nordic and Eastern European markets adopt SaaS as part of broader digital-sovereignty agendas, often favoring European cloud operators that guarantee local processing.
Asia Pacific is the fastest-growing region at a 14.83% CAGR, propelled by sovereign-cloud initiatives in India, Singapore, and Japan that require national data residency. China enforces strict localization via the personal information protection law, prompting hyperscalers to pair with Alibaba Cloud and Tencent Cloud for joint offerings. Australia and New Zealand maintain robust adoption as regulators update information-security standards to include SaaS controls. Emerging markets in South America, the Middle East, and Africa post double-digit expansion from a small base, although currency volatility and connectivity gaps temper near-term upside.

Competitive Landscape
The business productivity software market is moderately concentrated, with Microsoft, Google, and Salesforce anchoring the top tier. Microsoft generated USD 136 billion in commercial cloud revenue in 2024 and continues to bundle Microsoft 365 Copilot into premium plans to deepen account penetration. Google counters through Gemini integrations that emphasize low-latency content generation. Salesforce differentiates with industry-specific clouds pre-built for regulated sectors.
Key competitive themes include vertical specialization (Veeva for life sciences), API-first extensibility (Atlassian, Monday.com), and frontline workforce enablement (ServiceNow). Mergers, such as ServiceNow’s earlier Element AI purchase, add proprietary models to accelerate embedded intelligence. Challenger tools like Notion and Airtable blend document, database, and application features in a single canvas, appealing to teams that want flexible data structures. Compliance investments - ISO 27001 audits, SOC 2 attestations, and regional data-residency zones - have become table stakes for winning enterprise deals.
White-space opportunity revolves around integrating operational-technology data with collaboration flows, a domain where industrial vendors such as Siemens partner with low-code platforms to bridge factory systems and cloud suites. Transparency demands from the Financial Stability Board are pushing all providers to publish AI governance roadmaps that clarify training-data provenance and explainability assurances. Vendors unable to meet these expectations risk margin compression as buyers negotiate steep discounts or migrate to more trusted platforms.
Business Productivity Software Industry Leaders
Microsoft Corporation
Google LLC
Oracle Corporation
Broadcom Inc. (Symantec Corporation)
SAP SE
- *Disclaimer: Major Players sorted in no particular order

Recent Industry Developments
- December 2025: Microsoft expanded Microsoft 365 Copilot to SMEs, reducing the seat requirement to 1 user and introducing USD 30 monthly billing, targeting the SME segment growing at 14.23% through 2031.
- November 2025: Google enhanced Gemini for Workspace with advanced data-loss prevention and Vertex AI integration, enabling custom large language models while addressing security concerns in finance and healthcare sectors.
- October 2025: Salesforce expanded Agentforce with autonomous agents for supply-chain optimization and procurement, integrating with SAP and Oracle ERP systems to address manufacturing and retail sector challenges.
- September 2025: Atlassian launched Rovo Enterprise, an upgraded AI knowledge agent indexing content from 150+ third-party applications, competing with Microsoft 365 Copilot and supporting best-of-breed enterprise architectures.


Research Methodology Framework and Report Scope
Market Definitions and Key Coverage
We define business productivity software as licensed or subscription applications that let employees create, share, organize, and automate daily knowledge work across desktop, web, and mobile experiences. The study covers content collaboration suites, unified communications hubs, project and task managers, BI dashboards, low-code/no-code automation builders, plus security and compliance add-ons that directly raise workforce output.
Scope exclusion: back-end infrastructure utilities, point-of-sale systems, and industry-specific ERP modules fall outside our boundary.
Segmentation Overview
- By Deployment
- On-Premise
- Cloud
- By Organisation Size
- Large Enterprises
- Small and Medium Enterprises
- By End-User Industry
- BFSI
- Telecommunications and IT
- Manufacturing
- Media, Entertainment and Publishing
- Transportation and Logistics
- Retail and E-commerce
- Healthcare and Life Sciences
- Government and Public Sector
- Other End-User Industries (Education, Utilities)
- By Solution Type
- Content Collaboration and Document Management
- Communication and Unified Communications
- Project, Work and Task Management
- Business Intelligence and Analytics
- Low-Code / No-Code Automation
- Digital Asset and Creative Tools
- Security and Compliance Add-ons
- By Geography
- North America
- United States
- Canada
- Mexico
- Europe
- Germany
- United Kingdom
- France
- Italy
- Spain
- Russia
- Rest of Europe
- Asia Pacific
- China
- Japan
- India
- South Korea
- ASEAN
- Australia and New Zealand
- Rest of Asia Pacific
- South America
- Brazil
- Argentina
- Rest of South America
- Middle East
- Saudi Arabia
- United Arab Emirates
- Turkey
- Rest of Middle East
- Africa
- South Africa
- Nigeria
- Rest of Africa
- North America
Detailed Research Methodology and Data Validation
Primary Research
We interview regional CIOs, channel partners, SaaS sales leads, and independent consultants across North America, Europe, and Asia-Pacific. Their firsthand input on price corridors, renewal terms, and generative AI attach rates lets us validate secondary insights, bridge data gaps, and calibrate assumptions for small and midsize buyers.
Desk Research
Our team starts by pulling open datasets such as US Bureau of Labor Statistics job totals, Eurostat ICT usage files, OECD cloud adoption indicators, and World Bank broadband series, which anchor user pools and connectivity. Public filings, trade association releases, and news retrieved through D&B Hoovers and Dow Jones Factiva inform vendor revenue splits, average selling prices, and installed seat counts. Patent abstracts and global tender portals signal emerging functionality and deal sizes.
These references are illustrative only; additional databases and documents support data collection, validation, and clarification.
Market-Sizing & Forecasting
A top-down demand pool build multiplies global knowledge worker counts by average annual spend per user, then adjusts for cloud penetration, licensed seat expansion, and regional GDP deflators. Selective bottom-up vendor roll-ups and channel checks cross-verify totals before finalizing. Multivariate regression, fed by SaaS churn curves, generative AI plug-in adoption, and currency trends, projects 2026-2030 outcomes. Any missing vendor datapoint is bridged with tested seat-to-revenue proxies prior to lock-in.
Data Validation & Update Cycle
Outputs face peer review, variance checks against independent IT spend indices, and anomaly flags that trigger fresh calls with sources. We refresh every year, issue interim tweaks for material events, and run a last-minute review so clients receive the most current view.
Why Our Business Productivity Software Baseline Earns Trust
Published estimates often diverge because each publisher chooses its own scope, variables, and refresh rhythm, and our disciplined approach clarifies those choices for users.
Key gap drivers involve some studies bundling broader software services, others neglecting fast-growing low-code modules, and several overlooking currency adjustments for multi-region revenue.
Benchmark comparison
| Market Size | Anonymized source | Primary gap driver |
|---|---|---|
| USD 98.25 billion (2025) | Mordor Intelligence | N/A |
| USD 650.49 billion (2025) | Global Consultancy A | Combines infrastructure and service contracts far beyond productivity tools |
| USD 81.20 billion (2025) | Industry Watcher B | Omits AI and low-code add-ons captured by us |
| USD 70.44 billion (2025) | Sector Newsletter C | Uses limited survey base and unverified price points |
The comparison shows that Mordor's clarified scope, multi-source validation, and annual refresh deliver a balanced, reproducible baseline decision makers can trust.


Key Questions Answered in the Report
What is the current global size of the business productivity software market and how fast will it expand?
The market generated USD 110.36 billion in 2026 and is forecast to reach USD 195.56 billion by 2031, advancing at a 12.12% CAGR.
Which deployment model is growing fastest within business productivity suites?
Cloud-based deployments lead with 71.31% share in 2025 and are projected to grow at a 13.12% CAGR through 2031, outpacing on-premise alternatives.
Why are small and medium enterprises accelerating adoption of productivity software?
Usage-based pricing removes large upfront costs, allowing SMEs to scale seats flexibly, which supports a forecast 14.23% CAGR for the segment through 2031.
How are generative-AI features influencing enterprise purchasing decisions?
Embedded copilots that draft content, summarize meetings, and surface insights are shifting buyer expectations toward AI-native suites, steering budgets to vendors with hyperscale GPU capacity.
Which region is expected to record the fastest expansion by 2031?
Asia Pacific is set to lead with a projected 14.83% CAGR, driven by sovereign-cloud mandates in India, Singapore, and Japan and rising SaaS adoption among regional SMEs.
What is the primary regulatory hurdle for multinational productivity-software vendors?
Cyber-sovereignty laws in China, Russia, India, and the European Union require in-country data storage, compelling providers to build local cloud regions and increasing deployment complexity.
Page last updated on:


