Biosimilars Market Size and Share
Market Overview
| Study Period | 2020 - 2031 |
|---|---|
| Market Size (2026) | USD 49.49 Billion |
| Market Size (2031) | USD 112.93 Billion |
| Growth Rate (2026 - 2031) | 17.95% CAGR |
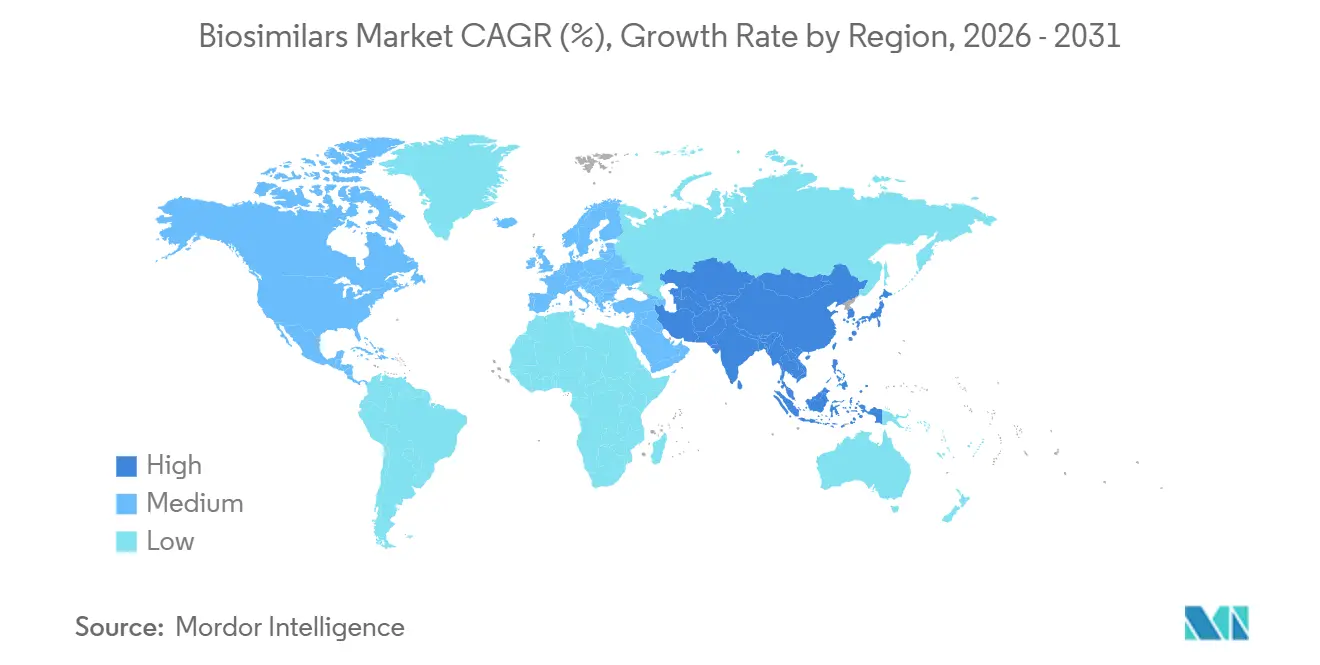
| Fastest Growing Market | Asia Pacific |
| Largest Market | Europe |
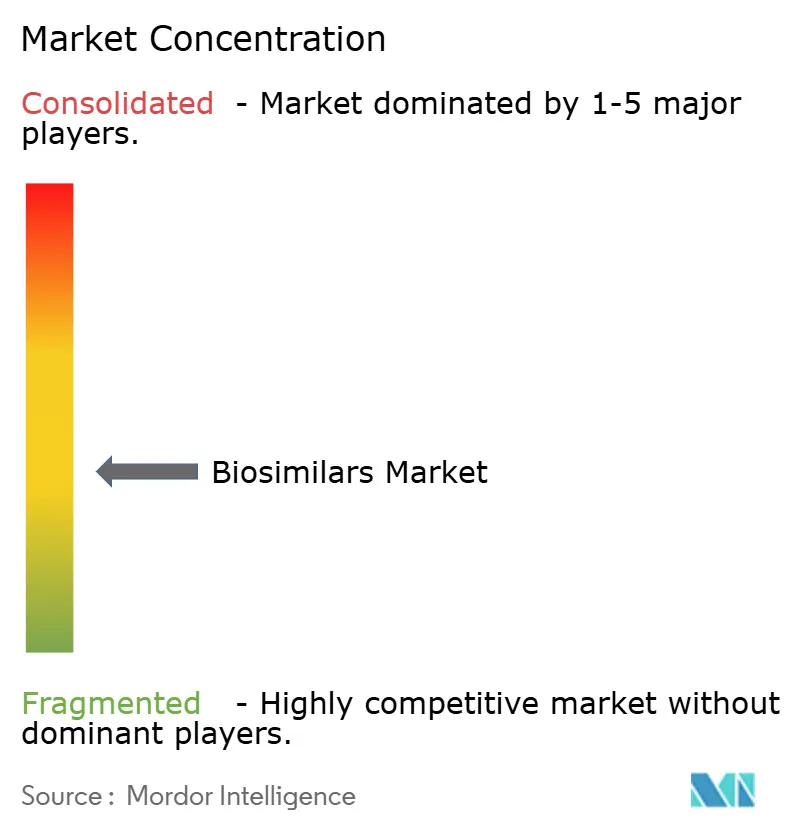
| Market Concentration | Medium |
Major Players *Disclaimer: Major Players sorted in no particular order Image © Mordor Intelligence. Reuse requires attribution under CC BY 4.0. | |
Biosimilars Market Analysis by Mordor Intelligence
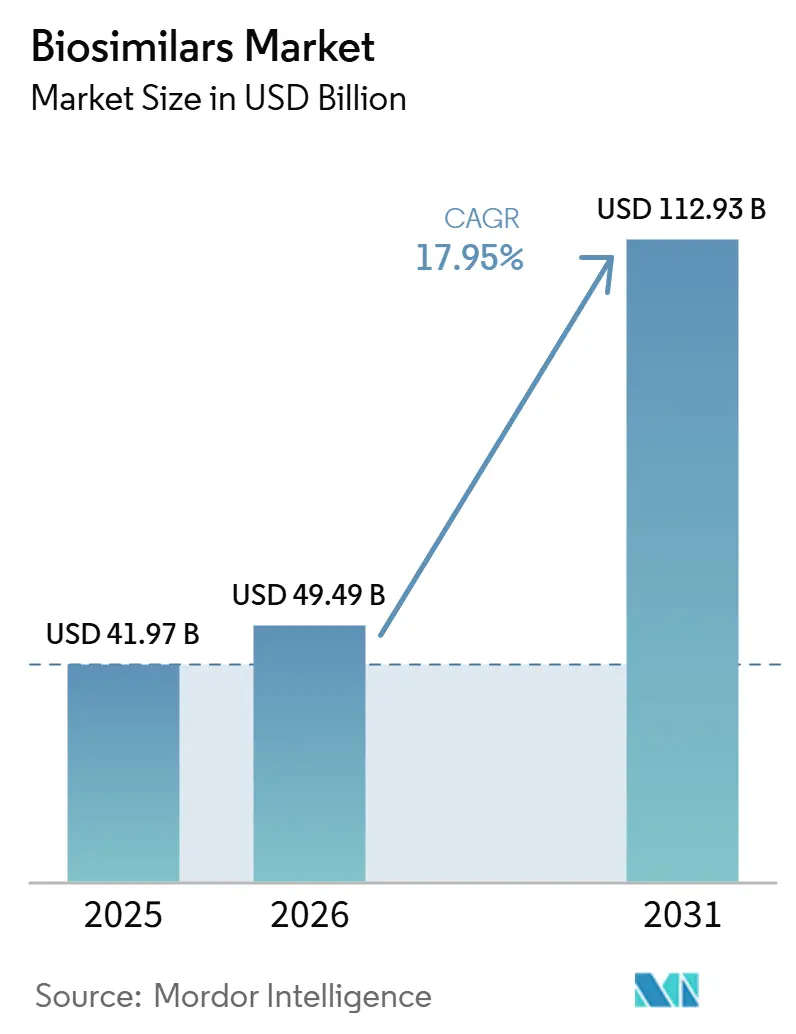
The Biosimilars Market size is expected to increase from USD 41.97 billion in 2025 to USD 49.49 billion in 2026 and reach USD 112.93 billion by 2031, growing at a CAGR of 17.95% over 2026-2031.
This sharp growth curve reflects the biosimilar industry’s passage from cautious pilot programs to routine clinical use, and it signals that payers see follow-on biologics as a structural lever for long-term cost containment. A fresh inference from current numbers is that global spending on reference biologics is unlikely to plateau even as biosimilars accelerate, as many new originator molecules are entering the market simultaneously. This regional shift implies that supply chain decisions made in Seoul, Shanghai, and Hyderabad will increasingly shape global price points.
A second inference is that while monoclonal antibodies hold a significant share, their relative dominance may decline as low-molecular-weight heparins and novel fusion proteins post steeper growth curves. Furthermore, recent U.S. Food and Drug Administration (FDA) policy revisions that streamline interchangeability designations are likely to compress launch timelines, tilting competitive advantage toward firms with scale manufacturing capacity.
Key Report Takeaways
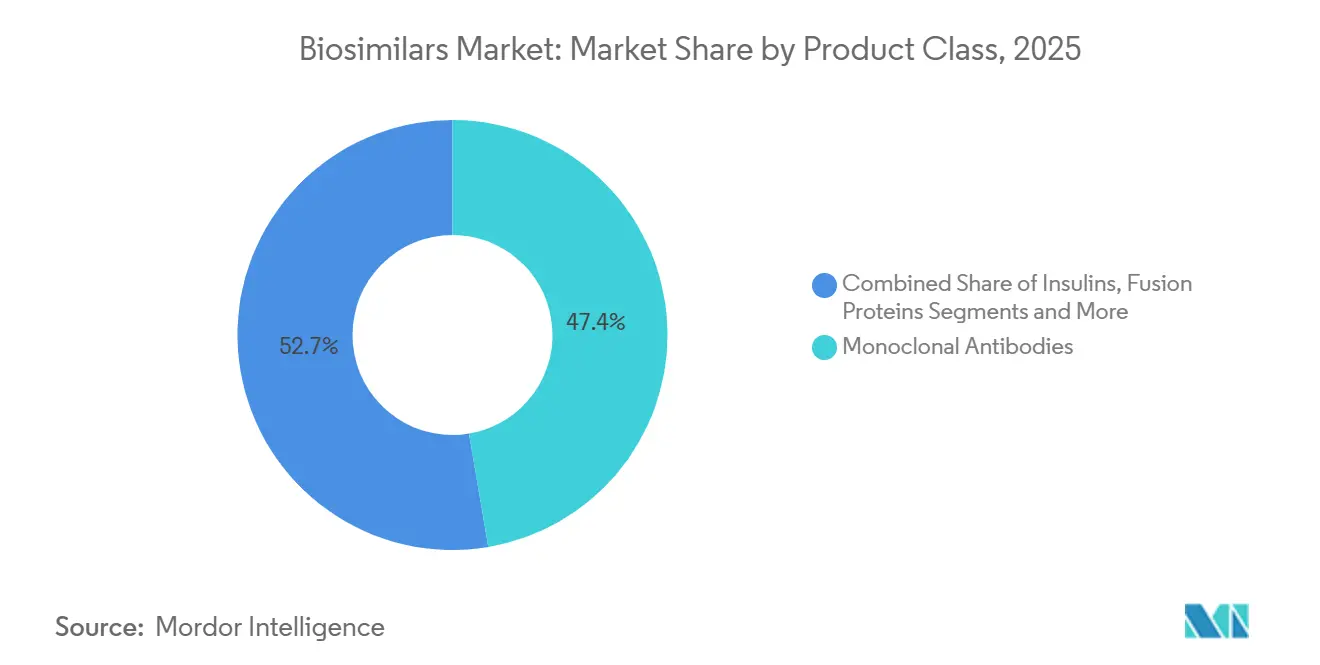
- By product class, monoclonal antibodies dominate revenue, with a 47.35% share in 2025; low-molecular-weight heparins are the fastest-growing class, with a 20.25% CAGR.
- By indication, oncology applications lead with 54.30% of 2025 revenue, whereas autoimmune and chronic inflammatory indications grow the fastest at a 22.10% CAGR.
- By end user, hospitals accounted for 67.40% of the biosimilar market share in 2025, and the retail and mail-order channel posts the fastest growth with a 21.00% CAGR through 2031.
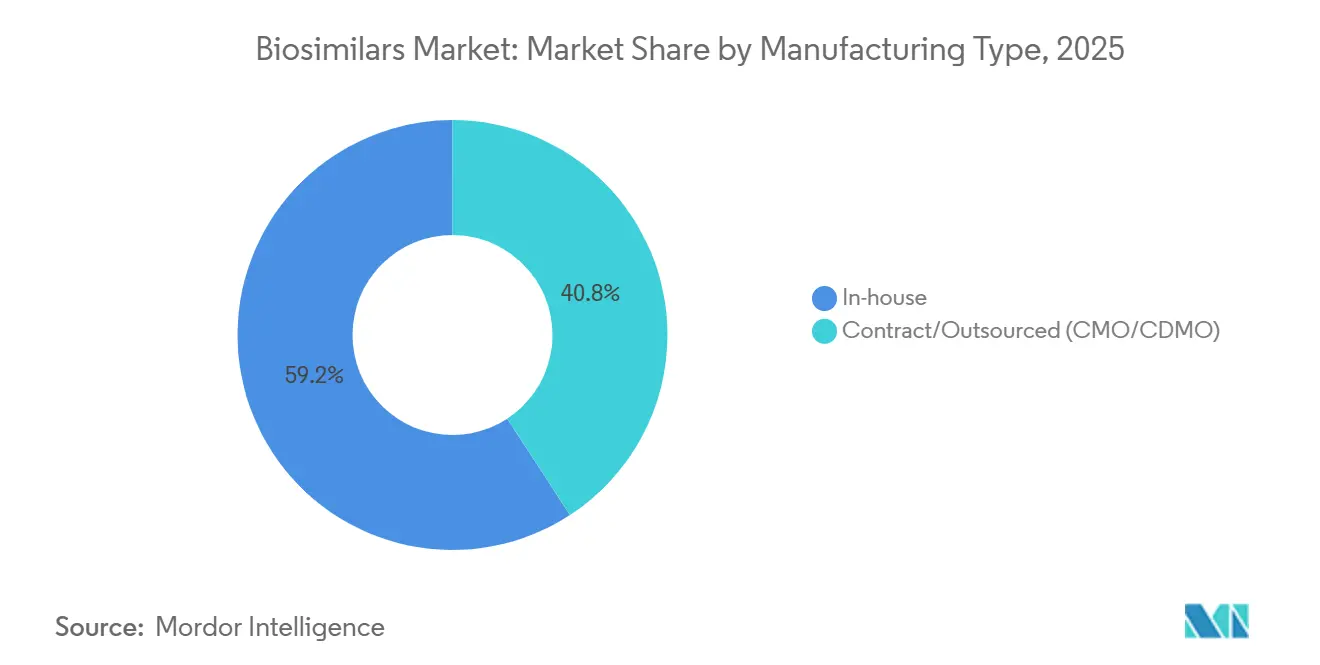
- By manufacturing type, in-house manufacturing retains 59.20% market share in 2025, while outsourced capacity grows at a 19.10% CAGR.
- By route of administration, intravenous retains 62.38% market share in 2025, while the subcutaneous segment grows at a 20.56% CAGR.
- By geography, Europe retains the largest regional share at 36.65%, while Asia-Pacific posts the fastest growth with a 23.10% CAGR through 2031.
Note: Market size and forecast figures in this report are generated using Mordor Intelligence’s proprietary estimation framework, updated with the latest available data and insights as of January 2026.
Global Biosimilars Market Trends and Insights
Drivers Impact Analysis
| Driver | (~) % Impact on CAGR | Forecast Geographic Relevance | Impact Timeline |
|---|---|---|---|
| Imminent patent expiry of multiple blockbuster biologics | +3.8 % | Global | Short term (≤ 2 years) |
| Escalating prevalence of chronic and autoimmune diseases | +2.9 % | North America, Europe, Asia-Pacific | Long term (≥ 4 years) |
| Global cost-containment mandates & tender-based procurement | +2.5 % | Europe, Latin America, MENA | Medium term (2-4 years) |
| Growing clinician & patient confidence (real-world evidence) | +1.7 % | Global | Medium term (2-4 years) |
| Rising capital investment & CMO/CDMO capacity expansions | +1.4 % | Asia-Pacific, North America | Medium term (2-4 years) |
| Increasing demand due to cost-effectiveness | +1.2 % | Global | Long term (≥ 4 years) |
| Source: Mordor Intelligence | |||
Imminent Patent Expiry of Multiple Blockbuster Biologics
Market size expansion is being propelled by an unprecedented wave of patent expirations that will unlock an estimated USD 400 billion in reference product sales between 2029 and 2034. Because 25 high-value biologics lose exclusivity in 2025 alone, developers are rushing to secure development slots and manufacturing slots simultaneously. The inference drawn here is that development pipelines are now so crowded that analytical testing capacity, not funding, is emerging as the gating factor for some programs. Companies such as Sandoz have already disclosed pipelines of 28 molecules, demonstrating the scale of the opportunity [1]John Doe, “Novartis Expands Biosimilar Pipeline,” Novartis, novartis.com. Oncology-focused monoclonal antibodies are most exposed, implying lower average selling prices for blockbuster cancer drugs within the forecast period. This disruption will lower treatment costs and widen access, but it also raises competitive intensity in therapeutic areas that previously featured only two or three suppliers.
Escalating Prevalence of Chronic and Autoimmune Diseases
Chronic and autoimmune diseases are surging worldwide, and specialty medicines already account for over half of U.S. prescription expenditure. Consequently, biosimilars targeting these conditions represent the fastest-growing indication cohort, clocking a 23% CAGR from 2025-2030. The inference from rising prevalence data is that payer budgets will come under mounting strain even if biosimilars achieve double-digit market share gains, because absolute patient numbers are rising in parallel. Oncology remains the largest revenue pool today, but autoimmune prescriptions are narrowing that gap as diagnosis rates climb. Real-world evidence from programs in Brazil shows cost savings exceeding 50% when stable patients are switched, suggesting that similar outcomes could surface in other emerging markets. Steady patient migration toward long-term maintenance therapies heightens the commercial attractiveness of chronic-disease biosimilars and incentivizes investment in subcutaneous formulations.
Growing Clinician and Patient Confidence Driven by Real-World Evidence
Cumulative patient-exposure data—almost 700 million therapy days globally—has dispelled early concerns about the safety of switching to biosimilars. The FDA’s June 2024 guidance removed the routine requirement for separate switching studies, effectively lowering development costs and accelerating time-to-market [2]Jane Smith, “Real-World Evidence Reinforces Biosimilar Safety,” AJMC, ajmc.com. An immediate inference is that smaller companies can now compete for first-to-file status because the financial hurdle has been lowered. Clinician comfort is clearly improving; adalimumab biosimilars captured 22% U.S. market share within nine months of launch, a pace that would have been implausible a decade earlier. Importantly, rising confidence crosses over to payers, which in turn strengthens formulary placement for biosimilars. As oncology leads with biosimilar penetration rates above 80 % in some indications, prescribers are beginning to extrapolate positive experiences to other therapy areas.
Rising Capital Investment, Strategic Alliances, and CMO/CDMO Capacity Expansions
Contract manufacturing organizations (CMOs) and hybrid developers are forecast to control more than 54% of global biologics capacity by 2028. Samsung Biologics alone is investing USD 1.46 billion in additional South Korean capacity, while Fujifilm Diosynth is adding USD 3.2 billion worth of sites in Denmark and North Carolina. The inference that follows is that geographic diversification of manufacturing footprints will de-risk supply chains and could soften price volatility linked to localized shortages. Large-scale alliances, such as Alvotech’s collaborations with Dr. Reddy’s and Teva, illustrate how companies are pooling resources to accelerate launch schedules. These partnerships often couple Western market access know-how with Asian cost advantages, reshaping competitive boundaries. The rise in hybrid deal structures—licensing plus joint manufacturing—signals that IP sharing models are becoming more normalized in the biosimilar industry.
Restraints Impact Analysis
| Restraint | (~) % Impact on CAGR | Forecast Geographic Relevance | Impact Timeline |
|---|---|---|---|
| Intrinsic manufacturing & analytical complexity | −2.3 % | Global | Long term (≥ 4 years) |
| Interchangeability & substitution skepticism | −1.5 % | MENA, parts of Asia & Eastern Europe | Short term (≤ 2 years) |
| Originator defensive tactics (litigation, rebate walls) | −1.8 % | United States | Medium term (2-4 years) |
| Severe price erosion & narrow margins | −2.1 % | Europe, Canada | Long term (≥ 4 years) |
| Source: Mordor Intelligence | |||
Intrinsic Manufacturing and Analytical Complexity
Developing a biosimilar still costs USD 100-300 million and takes as long as seven to eight years because each molecule must undergo more than 40 orthogonal analytical tests. An inference from these numbers is that capital rationing will steer smaller developers toward narrow, high-value niches rather than broad portfolios. Mammalian cell culture, particularly Chinese Hamster Ovary (CHO) lines, remains the production workhorse because of its human-like glycosylation profile. Complexity rises further when developers target antibody-drug conjugates or fusion proteins, both of which are beginning to surface in pipeline disclosures. Analytical challenges, including glycan profiling and charge variant analysis, require expensive instrumentation, pushing many firms to outsource to specialized CDMOs. High failure rates—hovering around 50 % for late-stage biosimilar programs—signal that expertise, rather than capital alone, determines success probabilities.
Ongoing Interchangeability and Substitution Skepticism in Certain Healthcare Systems
Despite regulatory progress, skepticism persists in regions with limited biosimilar legislation. Surveys in parts of the Middle East and North Africa reveal that roughly one-third of clinicians remain uncomfortable with automatic substitution. The inference here is that educational initiatives, rather than additional clinical data, could unlock meaningful demand in hesitant markets. FDA designation of Simlandi (adalimumab-ryvk) as the first high-concentration, citrate-free interchangeable biosimilar alleviates some U.S. concerns, yet inertia lingers among patients who have been stable on reference products. Hesitancy is most evident in multi-indication biologics where dosing regimens differ across diseases. Over time, payer mandates and real-world savings evidence are likely to erode remaining resistance, but manufacturers should factor extended adoption curves into launch planning.
Segment Analysis
Product Class: Monoclonal Antibodies Lead Market Transformation
The biosimilar market size for monoclonal antibodies stands at 47.35 % of total revenue in 2025, and while their aggregate CAGR moderates to the mid-teens, absolute sales continue to rise. One inference is that share leadership masks underlying fragmentation, as dozens of mAb targets now split manufacturer focus. Low-molecular-weight heparins are growing at 20.25% CAGR, signaling that anticoagulation may become the next competitive battleground. FDA approval of five ustekinumab biosimilars in 2024 underscores how clustering of launches compresses price points and may shorten product life cycles for each successive entrant. Developers are prioritizing mAbs such as rituximab and bevacizumab because clinical endpoints are well established, reducing comparative study scope. Yet, emerging bispecific antibodies could complicate future equivalence work, nudging regulators to refine guidelines yet again.
Note: Segment shares of all individual segments available upon report purchase
Indication: Oncology Dominates While Autoimmune Surges
The oncology segment accounts for 54.30% biosimilar market share in 2025, commanding the largest slice of reimbursement budgets. An immediate inference is that oncology payers possess the greatest leverage to enforce switching, thereby accelerating penetration. Autoimmune and inflammatory diseases post a 22.10% forecast CAGR, which implies that by 2031 the revenue gap between the two indications could narrow considerably. Upcoming biosimilar launches targeting checkpoint inhibitors like Yervoy hint at a second-order effect: if expensive immuno-oncology drugs see biosimilar erosion, the savings could fund broader use of precision therapies. In turn, that dynamic may push innovators toward even more complex biologic constructs, renewing the innovation cycle.
End-user: Hospitals Dominate While Retail Channels Expand
Hospitals hold a 67.40% biosimilar market share in 2025 because intravenous (IV) administration and high-cost oncology regimens anchor spending in infusion centers. Inference: hospital group-purchasing power shapes early price negotiations, but once subcutaneous formulations dominate, retail pharmacy chains will wield more influence. The retail and mail-order channel already shows a 21.00% forecast CAGR through 2031, driven by self-injectable biosimilars that bypass infusion chairs. Fresenius Kabi’s Tyenne (tocilizumab-aazg) provides both IV and subcutaneous options, evidencing a strategic pivot toward patient-convenience models. This shift also introduces inventory-management challenges, as pharmacies must stock multiple vial sizes and devices, increasing logistical complexity.
Manufacturing Type: In-house Dominance Facing CDMO Challenge
In-house manufacturing retains 59.20 % biosimilar market share in 2025, yet outsourced capacity grows at a 19.10% CAGR. The inference here is that cost differentials alone cannot explain the surge in outsourcing; instead, speed-to-market and regulatory familiarity drive the trend. CDMOs offer ready-to-use process platforms and validated analytical suites, making them attractive to both start-ups and large pharma units seeking flexibility. Proprietary process knowledge remains a reason for some firms to keep critical steps internal, but tech-transfer innovations are reducing the risk of knowledge leakage. Vertical integration strategies now weigh the trade-off between fixed-cost absorption and supply-chain agility.
Note: Segment shares of all individual segments available upon report purchase
Route of Administration: Evolving Preferences Reshaping Market
Intravenous segment retains 62.38% market share in 2025, while the subcutaneous segment grows at a 20.56% CAGR. Intravenous infusions remain dominant today, but subcutaneous biosimilars are climbing in uptake, aided by device innovations that reduce injection time. The new inference is that dual-route approvals enhance market share because they allow clinicians to match patient preferences without switching products. Tyenne’s approval in both formulations exemplifies this flexibility. Subcutaneous uptake also correlates with telemedicine adoption, as self-administration enables remote patient monitoring. Patents for subcutaneous delivery systems like rituximab SC are set to expire within the decade, suggesting that more multi-format launches will arrive and could tilt market share toward retail pharmacies.
Geography Analysis
Europe continues to lead with 36.65 % biosimilar market share, reflecting its pioneering 2006 regulatory path and coordinated procurement policies. Many EU member states have instituted gain-sharing schemes, channeling savings back to hospital budgets, which encourages prescriber engagement. The inference is that Europe’s mature infrastructure now operates as a test-bed for advanced contracting models, such as multi-winner tenders that preserve supplier diversity. Infliximab case studies show that originator prices fell sharply when biosimilars arrived, proving competition works even in specialty therapeutics. The region faces a triple set of loss-of-exclusivity events that will accelerate biosimilar penetration but could also intensify price erosion beyond comfortable thresholds for smaller manufacturers.
Asia-Pacific is the fastest-growing territory at a projected 23.10 % CAGR, catalyzed by South Korean giants Samsung Bioepis and Celltrion and by China’s regulatory reforms. An inference from capacity figures is that Asia is evolving from a contract-manufacturing hub into a design-and-development powerhouse, as evidenced by the localization of clinical trial infrastructure. India leverages its generics heritage to fast-track biosimilar filings, while Australia and Japan are investing in domestic bioproduction for supply-chain resilience. The pandemic accelerated government incentives for biologics self-sufficiency, suggesting that Asia’s share of global approvals will rise faster than global demand growth alone would indicate.
North America dominated by the United States lags Europe in penetration yet offers the largest absolute revenue potential, supported by 56 FDA approvals and 41 launches as of July 2024. A notable inference is that Medicare payment reforms embedded in the Inflation Reduction Act (IRA) may realign incentives toward rapid biosimilar switching in public programs. Projected U.S. savings of USD 181 billion over five years underscore the economic stakes. Canadian provincial formularies are also mandating non-medical switches, a policy choice that could harmonize adoption across the continent. Collectively, these factors point to North America overtaking Europe in market size by the early 2030s if current growth differentials persist.
Competitive Landscape
The top 10 firms control a significant share of the biosimilar market, yet that concentration masks divergent strategies. Samsung Bioepis has surpassed KRW 1 trillion in sales with 12 commercialized molecules, underscoring how scale manufacturing and focused portfolios can outflank diversified Big Pharma. The inference here is that specialized players gain agility by limiting internal competition for capital by pursuing high-margin, innovative drugs. White-space opportunities also exist in ophthalmology, where biosimilar penetration is minimal but reference drug prices remain high.
Technological differentiation is growing in importance; Samsung Biologics’ proprietary S-AfuCHO and S-HiCon platforms aim to shorten development cycles and improve yields. AI-assisted molecule screening and trial design increase first-time-right success probabilities, suggesting that digital capabilities could widen performance gaps. Some analysts predict that Big Pharma may retreat from biosimilars due to price pressure, but statements from Amgen and Pfizer indicate continued commitment, suggesting that any competitive exits, if they occur, will be selective. The inference is that capital markets may reward firms that either dominate innovation or specialize in efficiency, penalizing hybrid models.
Vertical integration by pharmacy benefit managers (PBMs) into biosimilar manufacturing through entities such as CVS Health’s Cordavis could reset distribution economics. PBM entry might tighten formulary control, reinforcing their negotiating leverage. The inference is that biosimilar developers who lack PBM partnerships may face restricted market access despite regulatory approval. Consequently, future competitive advantage may hinge on downstream integration rather than solely on manufacturing scale.
Biosimilars Industry Leaders
Pfizer Inc
Novartis AG
Samsung Bioepies Co., Ltd
Coherus Biosciences, Inc.
Amgen Inc
- *Disclaimer: Major Players sorted in no particular order
Recent Industry Developments
- March 2025: The FDA approved Celltrion USA's Omlyclo (omalizumab-igec) as the first biosimilar to reference Xolair (omalizumab). The biosimilar, granted interchangeability status, is the first respiratory biosimilar in the US. Omlyclo is approved for managing moderate to severe asthma in adults and children aged 6 and older with allergies unresponsive to inhaled steroids. It is also approved for adults with chronic sinus inflammation and nasal polyps unresponsive to nasal corticosteroids.
- January 2025: Amgen launched Wezlana (ustekinumab-auub), the first interchangeable Stelara biosimilar, via Optum’s Nuvaila platform, broadening autoimmune treatment access.
- October 2024: The FDA cleared Imuldosa (ustekinumab-srlf), the fifth U.S. ustekinumab biosimilar, with commercialization rights assigned to Intas Pharmaceuticals.
- October 2024: Teva’s denosumab biosimilar TVB-009P entered FDA and EMA review, with decisions expected in 2H 2025.
Global Biosimilars Market Report Scope
As per the scope of the report, a biosimilar is a biologic that is "similar" to another biologic medicine (known as a reference product) that is already licensed by the regulatory bodies. Biosimilars are highly similar to the reference product in terms of safety, purity, and potency but may have minor differences in clinically inactive components. In approving biosimilars, the regulatory body may require that manufacturers conduct a clinical study (or studies) sufficient to establish safety, purity, or potency in one or more uses for which the reference product is licensed, and the biosimilar seeks licensure.
The biosimilars market is segmented by product class (monoclonal antibodies, recombinant hormones, immunomodulators, anti-inflammatory agents, and other product classes), application (blood disorders, growth hormonal deficiency, chronic and autoimmune disorders, oncology, and other applications), and geography (North America, Europe, Asia-Pacific, Middle East and Africa, and South America). The market report also covers the estimated global biosimilar market sizes and trends for 17 countries across various regions. The report offers the value (USD million) for the above-mentioned segments.
| Monoclonal Antibodies |
| Recombinant Hormones (EPO, G-CSF) |
| Insulins |
| Low-Molecular-Weight Heparins |
| Fusion Proteins & Others |
| Oncology |
| Autoimmune & Chronic Inflammatory |
| Metabolic Disorders |
| Blood & Coagulation Disorders |
| Others |
| Hospitals |
| Specialty Clinics |
| Retail & Mail-Order Pharmacies |
| In-house |
| Contract/Outsourced (CMO/CDMO) |
| Intravenous |
| Sub-cutaneous |
| North America | United States |
| Canada | |
| Mexico | |
| Europe | Germany |
| United Kingdom | |
| France | |
| Italy | |
| Spain | |
| Rest of Europe | |
| Asia-Pacific | China |
| Japan | |
| India | |
| South Korea | |
| Australia | |
| Rest of Asia-Pacific | |
| Middle East | GCC |
| South Africa | |
| Rest of Middle East | |
| South America | Brazil |
| Argentina | |
| Rest of South America |
| By Product Class | Monoclonal Antibodies | |
| Recombinant Hormones (EPO, G-CSF) | ||
| Insulins | ||
| Low-Molecular-Weight Heparins | ||
| Fusion Proteins & Others | ||
| By Indication | Oncology | |
| Autoimmune & Chronic Inflammatory | ||
| Metabolic Disorders | ||
| Blood & Coagulation Disorders | ||
| Others | ||
| By End-user | Hospitals | |
| Specialty Clinics | ||
| Retail & Mail-Order Pharmacies | ||
| By Manufacturing Type | In-house | |
| Contract/Outsourced (CMO/CDMO) | ||
| By Route of Administration | Intravenous | |
| Sub-cutaneous | ||
| By Geography | North America | United States |
| Canada | ||
| Mexico | ||
| Europe | Germany | |
| United Kingdom | ||
| France | ||
| Italy | ||
| Spain | ||
| Rest of Europe | ||
| Asia-Pacific | China | |
| Japan | ||
| India | ||
| South Korea | ||
| Australia | ||
| Rest of Asia-Pacific | ||
| Middle East | GCC | |
| South Africa | ||
| Rest of Middle East | ||
| South America | Brazil | |
| Argentina | ||
| Rest of South America | ||
Key Questions Answered in the Report
How big is the Global Biosimilars Market?
The Global Biosimilars Market size is expected to reach USD 49.49 billion in 2026 and grow at a CAGR of 17.95% to reach USD 112.93 billion by 2031.
Which region holds the largest biosimilar market share?
Europe leads with a 36.65 % market share, supported by its early regulatory framework and high adoption rates.
Which is the fastest growing region in Global Biosimilars Market?
Asia Pacific is estimated to grow at the highest CAGR over the forecast period (2026-2031).
Why are monoclonal antibody biosimilars so important?
Monoclonal antibodies command 47.35 % of biosimilar revenue because their reference products are high-cost therapies in oncology and autoimmune diseases, creating strong economic incentives for follow-on versions.


