
Bio-Pharma Logistics Market Size and Share
Market Overview
| Study Period | 2020 - 2031 |
|---|---|
| Market Size (2026) | USD 152.04 Billion |
| Market Size (2031) | USD 234.58 Billion |
| Growth Rate (2026 - 2031) | 9.06 % |
| Fastest Growing Market | Asia-Pacific |
| Largest Market | North America |
| Market Concentration | Medium |
Major Players *Disclaimer: Major Players sorted in no particular order Image © Mordor Intelligence. Reuse requires attribution under CC BY 4.0. | |
Bio-Pharma Logistics Market Analysis by Mordor Intelligence
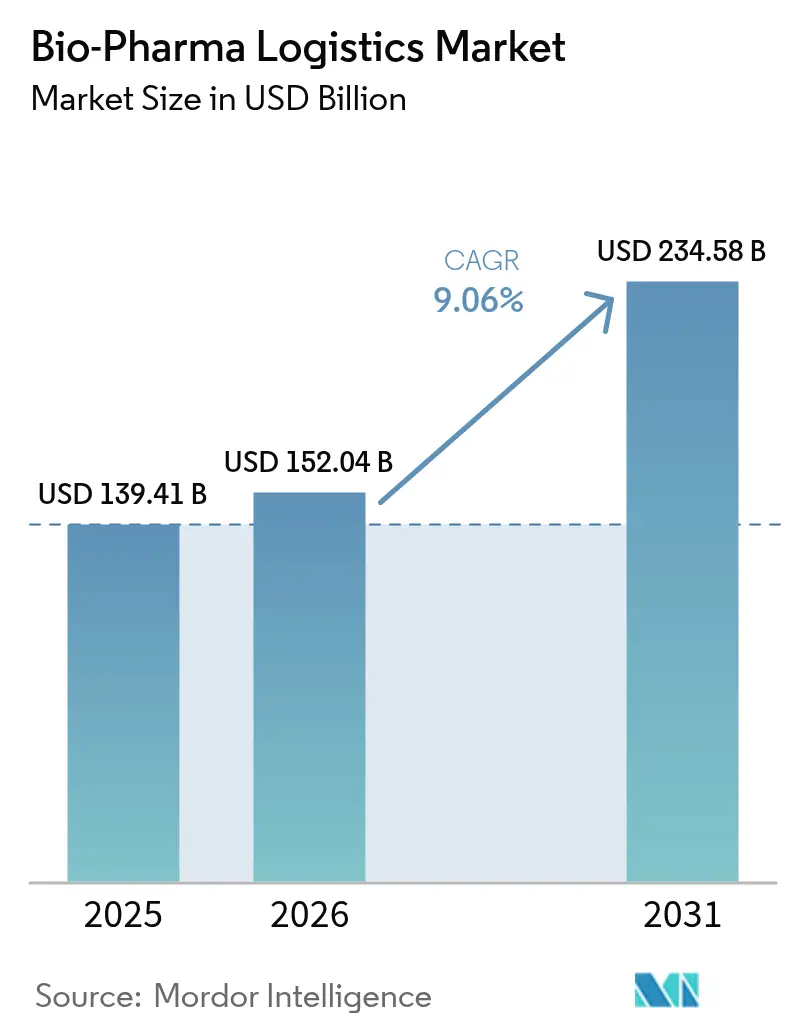
The Bio-Pharma Logistics Market size was valued at USD 139.41 billion in 2025 and estimated to grow from USD 152.04 billion in 2026 to reach USD 234.58 billion by 2031, at a CAGR of 9.06% during the forecast period (2026-2031). The growth reflects an industry pivot from conventional bulk drug distribution toward highly specialized, temperature-controlled networks engineered for advanced biologics, mRNA vaccines, and personalized cell & gene therapies. Scaling requirements for ultra-low-temperature shipping (down to −150 °C) are reshaping service portfolios, pushing providers to expand liquid-nitrogen capacity and real-time monitoring. Heightened regulatory scrutiny—exemplified by the European Medicines Agency’s decision to discontinue blanket GDP certificate extensions—also amplifies demand for certified third-party logistics partners. Parallel sustainability pressures spur investments in reusable packaging, route optimization, and electrified fleets as shippers aim to curb supply-chain emissions that account for more than 80% of industry carbon output.
Key Report Takeaways
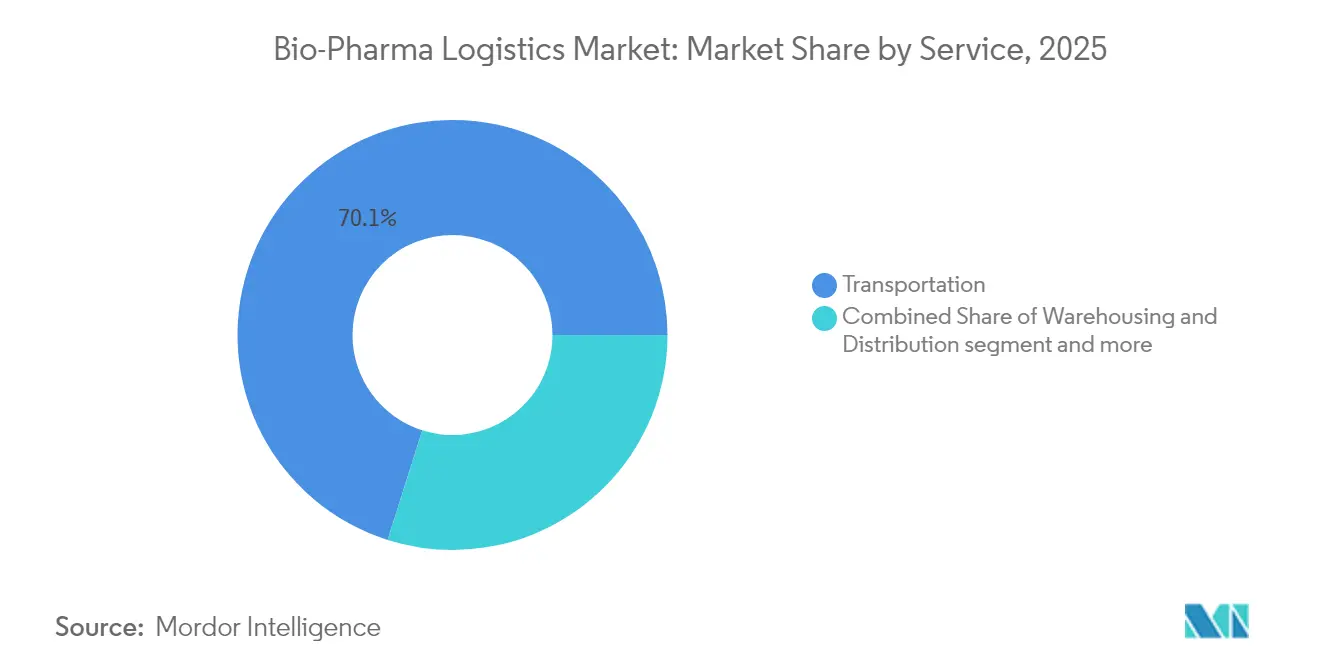
- By service, transportation held 70.12% of the biopharma logistics market share in 2025. The bio-pharma logistics market for value-added services is forecast to outpace the market with a 10.77% CAGR between 2026 and 2031.
- By temperature range, cold chain commanded 68.40% of the biopharma logistics market size in 2025. The bio-pharma logistics market for cold chain is advancing at a 10.49% CAGR between 2026 and 2031.
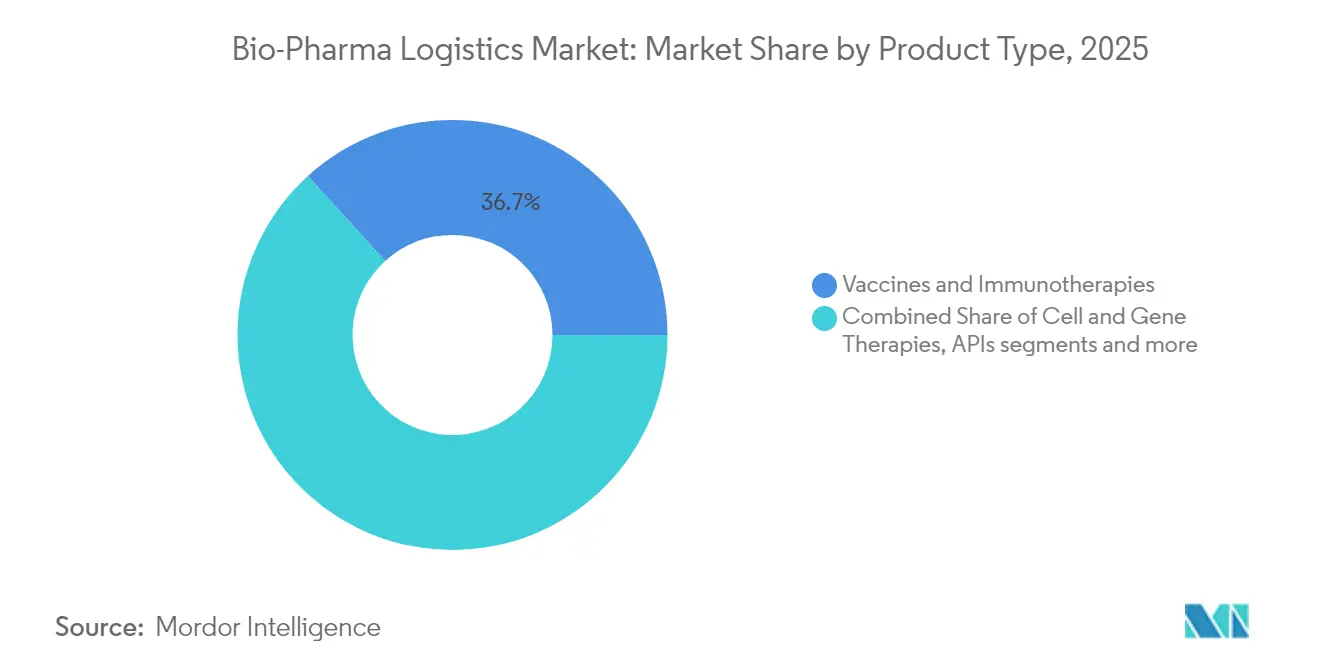
- By product type, vaccines and immunotherapies led with 36.74% of the biopharma logistics market revenue share in 2025. The bio-pharma logistics market for cell & gene therapies exhibits the fastest trajectory at 13.05% CAGR between 2026 and 2031.
- By end-user, bio-pharma manufacturers captured 58.10% of the bio-pharma logistics market share in 2025. The bio-pharma logistics market for CROs/CMOs records the highest projected CAGR at 12.02% between 2026 and 2031.
- By geography, North America retained leadership with 41.20% of the biopharma logistics market share in 2025. The bio-pharma logistics market for Asia-Pacific is set to expand at 11.06% CAGR between 2026 and 2031.
Note: Market size and forecast figures in this report are generated using Mordor Intelligence’s proprietary estimation framework, updated with the latest available data and insights as of 2026.
Global Bio-Pharma Logistics Market Trends and Insights
Drivers Impact Analysis*
| Driver | (~) % Impact on CAGR Forecast | Geographic Relevance | Impact Timeline |
|---|---|---|---|
| Surge in High-Value Biologicals & Specialty Pharma Share Elevating Cold-Chain Demand | +2.1% | Global, with a concentration in North America & Europe | Medium term (2-4 years) |
| Advanced Therapies Growth (mRNA, Cell & Gene) Necessitating Ultra-Low-Temperature Logistics | +1.8% | North America & Europe leading, Asia-Pacific emerging | Long term (≥ 4 years) |
| Globalization & Decentralization of Clinical Trials Accelerating Direct-to-Patient Shipments | +1.4% | Global, with early adoption in North America & Europe | Short term (≤ 2 years) |
| Stringent Worldwide GDP/GxP Compliance Mandating Outsourcing to Certified 3PLs | +1.6% | Global, with emerging markets catching up | Medium term (2-4 years) |
| E-commerce & D2C Distribution of Specialty Medicines Boosting Last-Mile Temperature-Controlled Delivery | +1.2% | Developed markets leading, expanding to Asia-Pacific | Short term (≤ 2 years) |
| Emerging-Market Biologics Manufacturing Expansion Increasing Cross-Border Cold-Chain Flows | +1.1% | Asia-Pacific core, spill-over to Middle East and Africa and Latin America | Long term (≥ 4 years) |
| Source: Mordor Intelligence | |||
Surge in High-Value Biologicals & Specialty Pharma Elevating Cold-Chain Demand
Cold-chain failures cost the sector USD 35 billion annually, underscoring the financial imperative for resilient temperature management. Logistics providers deploy AI-driven predictive analytics to foresee excursion risks, while security upgrades counter rising counterfeit threats. Frontier Scientific Solutions invested USD 1.5 billion in Foreign Trade Zone infrastructure around Wilmington and Shannon airports to cut transit times and safeguard high-value biologics [1]Frontier Scientific Solutions, “FTZ Investments Enhance Biologics Cold-Chain Corridor,” biopharminternational.com.
Advanced Therapies Growth (mRNA, Cell & Gene) Necessitating Ultra-Low-Temperature Logistics
mRNA and viral-vector products require storage as low as −150 °C. Cryoport and SK Pharmteco launched an integrated platform spanning manufacturing and distribution tailored to such therapies[2]Cryoport Systems, “Cryoport and SK pharmteco Announce Integrated Advanced-Therapies Supply-Chain Platform,” cryoport.com. Research into thermostable lipids that preserve mRNA at standard refrigeration may ease dependence on deep-freeze networks, yet current pipelines still rely heavily on cryogenic infrastructure. DHL’s acquisition of CRYOPDP, handling more than 600,000 ultra-cold consignments annually, illustrates consolidation around specialized capacity.
Globalization & Decentralization of Clinical Trials Accelerating Direct-to-Patient Shipments
Decentralized trials lift recruitment and retention, but shift logistics from depot-to-site to home delivery. Sponsors now demand flexible, demand-led inventory models plus tele-health coordination. FedEx expanded Life Science Centers across Asia and rolled out sensor-based tracking to manage residential temperature control [3]FedEx Expands Life Science Centres Across Asia with Sensor-Based Tracking,” BioSpectrum Asia, biospectrumasia.com.
Stringent Worldwide GDP/GxP Compliance Mandating Outsourcing to Certified 3PLs
The EMA’s 2025 return to strict GDP certification and India’s revised Schedule M enforce global best practices, prompting drug makers to outsource to networks like Kuehne+Nagel’s 270 GxP-certified sites. In the United States, the Drug Supply Chain Security Act’s serialization regime further elevates compliance complexity.
Restraints Impact Analysis*
| Restraint | (~) % Impact on CAGR Forecast | Geographic Relevance | Impact Timeline |
|---|---|---|---|
| Capacity Constraints in Temperature-Controlled Airfreight & LN₂/Dry-Ice Supply Driving Cost Volatility | -1.3% | Global, with acute pressure in North America & Europe | Short term (≤ 2 years) |
| Divergent Global Regulatory & Customs Requirements Causing Delays and Excursion Risk | -0.9% | Global, particularly affecting cross-border shipments | Medium term (2-4 years) |
| High Carbon Footprint of Cold-Chain Operations Prompting Costly Sustainability Investments | -0.7% | Global, with stricter requirements in Europe & North America | Medium term (2-4 years) |
| Scarcity of Skilled Workforce & GDP-Certified Infrastructure in Emerging Regions Limiting Reliability | -0.6% | Emerging markets in Asia-Pacific, Middle East and Africa, and Latin America | Long term (≥ 4 years) |
| Source: Mordor Intelligence | |||
Capacity Constraints in Temperature-Controlled Airfreight & LN₂/Dry-Ice Supply Driving Cost Volatility
Dry-ice shortages during the COVID-19 vaccine rollout revealed a fragile supply base. Air separation units wrestle with high energy prices, while airfreight belly-hold capacity competes with e-commerce. Vienna Airport’s Pharma Handling Center doubled cold-chain space, yet forward bookings still exceed slot availability, causing rate spikes and forcing mode shifts.
Divergent Global Regulatory & Customs Requirements Causing Delays and Excursion Risk
Only 14% of U.S. dispensers were DSCSA-ready before the FDA’s enforcement grace period, and error rates of 30% in EPCIS data risk shipment quarantines. China’s Anti-Espionage Law has delayed Western inspections, while the EU Medical Device Regulation backlog slows combination-product clearances, collectively prolonging border dwell times and heightening excursion risk.
*Our forecasts treat driver/restraint impacts as directional, not additive. The impact forecasts reflect baseline growth, mix effects, and variable interactions.
Segment Analysis
By Service: Value-Added Services Outpace Traditional Transportation
Transportation accounted for 70.12% of bio pharma logistics market revenue in 2025, anchored by road networks for last-mile and air corridors for time-critical biologics. Nonetheless, value-added services are forecast to grow 10.77% annually to 2031 as clients demand labeling, kitting, and qualified-person release alongside core transport. Providers leverage AI in warehouses to anticipate capacity peaks and prevent temperature deviations. Catalent’s FastChain platform illustrates the shift toward demand-led fulfilment, pairing real-time inventory with regional depots. The bio pharma logistics market size for value-added services is projected to widen steadily, reflecting regulatory complexity and patient-centric packaging needs. Transportation will retain scale but face pricing pressure as supply tightens in temperature-controlled trucking and airfreight.
Within transport, road logistics remains dominant for sub-zero deliveries across continental networks, while air plays a critical role in ultra-cold gene-therapy consignments despite ongoing capacity constraints. Sea freight gains modest share as sustainability targets drive modal shifts for stable biologics. Warehousing growth tracks with clients’ off-site storage preferences, particularly in Europe where new GMP-compliant cold rooms unlock cross-border distribution.


By Temperature Range: Cold Chain Dominance Amid Ultra-Cold Growth
Cold chain services captured 68.40% of the bio pharma logistics market in 2025 and will expand fastest at 10.49% CAGR. Refrigerated (2-8 °C) lanes underpin vaccines and insulin flows, yet ultra-cold (−20 °C to −150 °C) emerges as the star sub-segment for mRNA and cell & gene therapies. The bio pharma logistics market size tied to ultra-cold shipments is forecast to nearly double by 2031. Providers invest in vacuum-insulated panels, phase-change materials, and nitrogen-based dry shippers with IoT beacons for live temperature feeds.
Ambient (15-25 °C) networks continue to serve traditional oral solids but grow slower as formularies tilt toward biologics. Frozen (0 °C to −20 °C) remains niche for specific APIs and long-term stockpiles. Sustainability imperatives accelerate a pivot to reusable shippers and electrified reefers, creating hybrid models pairing green power with dense thermal mass. Blockchain pilots track chain-of-custody events to assure compliance.
By Product Type: Cell & Gene Therapies Lead Innovation-Driven Growth
Vaccines and immunotherapies led 2025 revenue with a 36.74% share, buoyed by ongoing public-health programs. Yet, cell & gene therapies headline growth at 13.05% CAGR through 2031, pushing demand for bespoke, monitored containers. Cold-chain qualified packaging for viral vectors incorporates vibration-damping and slow-release dry ice. The bio-pharma logistics market share for vaccines will moderate as prophylactic programs stabilize, while APIs and bulk biologics maintain steady volume into large-scale plants.
Advanced analytical testing, such as ion-pair reversed-phase chromatography for mRNA impurity profiling, lengthens pre-release lead times, making secure interim storage vital. Finished-dose biologics benefit from efficiencies in fill-finish plants but still depend on end-to-end cold visibility.
By End-User: CROs and CMOs Drive Outsourcing Acceleration
Bio-pharma manufacturers held 58.10% revenue share in 2025; however, CROs/CMOs grow fastest at 12.02% CAGR as firms outsource complexity. That shift multiplies shipment lanes because each CMO services multiple sponsors. Hospitals and trial sites require direct-to-patient options and flexible resupply. The bio pharma logistics market size allocated to CRO/CMO workstreams will therefore rise disproportionately, attracting specialist carriers with clinical-trial licensure and remote-visit expertise.
Manufacturers still command bulk volume, leveraging long-term contracts with integrators to secure capacity. Specialty pharmacies and emerging direct-therapist delivery models form a diversifying tail, each demanding granular tracking for chain-of-identity.
Geography Analysis
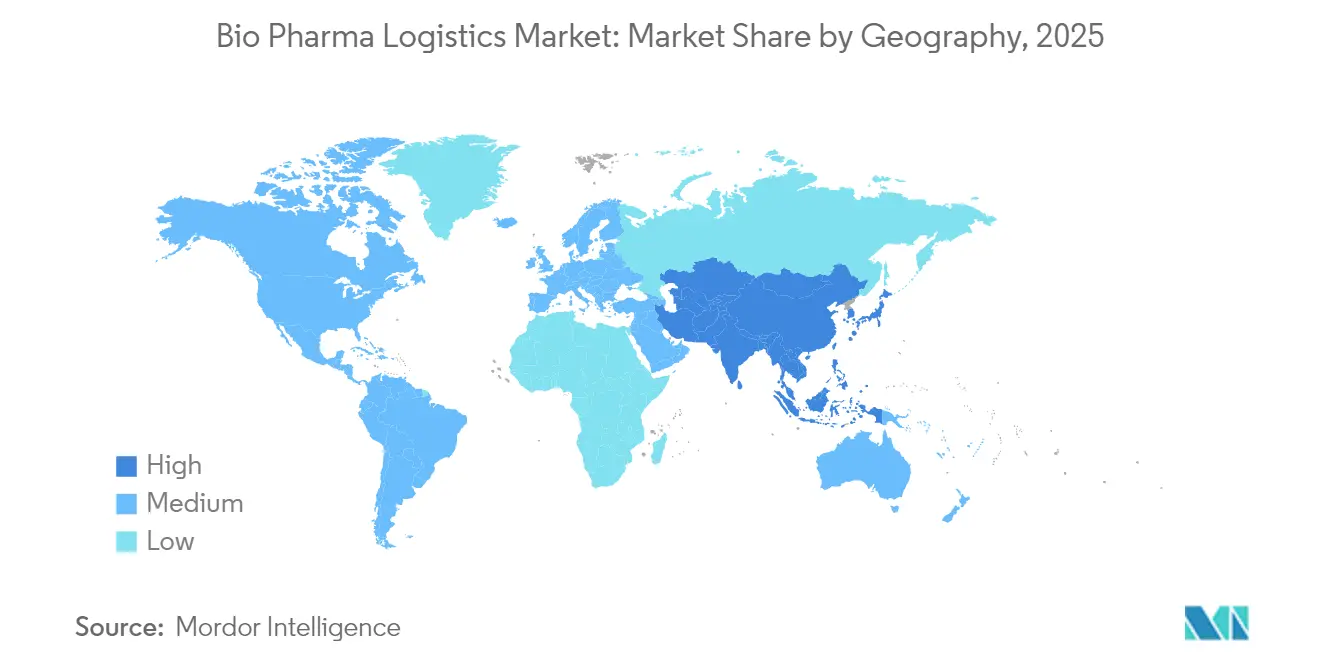
North America retained 41.20% share of the bio pharma logistics market in 2025 on the back of entrenched pharmaceutical manufacturing, dense GDP-certified networks, and the early adoption of IoT-enabled monitoring. Major capex programs, such as UPS’s USD 1.6 billion acquisition of Andlauer Healthcare Group, deepen regional infrastructure and reinforce standards leadership.
Asia-Pacific is projected to grow at 11.06% CAGR and will account for the majority of the incremental market value through 2031. Chinese innovators are relocating vector production to Singapore and Thailand to diversify risk, while India expands injectables output under revised GMP rules. Singapore’s new multi-tenant pharma hub embodies the region’s push for high-grade cold storage and cross-border rapid clearance. As a result, the bio-pharma logistics market size related to intra-Asia trade lanes is set to accelerate.
Europe remains a powerhouse, leveraging tight regulatory compliance and extensive road-rail cold corridors. DHL’s 30,000 m² climate-neutral expansion near Frankfurt supports sub-zero warehousing down to −70 °C, reinforcing the continent’s capability to manage cell & gene therapy pipelines. Ongoing consolidation raises service quality, though capacity constraints persist at key cargo gateways like Schiphol and Brussels.
South America and the Middle East & Africa exhibit emerging opportunity profiles. Government vaccine campaigns and growing chronic-disease treatment uptake catalyze the need for certified cold rooms and road-to-air interfaces. However, patchy power grids and limited GDP oversight pose service-quality challenges, slowing the pace of infrastructure upgrades.

Regulatory Landscape
Bio-pharma logistics operations are managed under GDP and broader GxP requirements covering how medicinal products are stored, handled, transported, and documented across multi-party networks. In the EU, GDP guidance for medicinal products (2013/C 343/01) and for active substances (2015/C 95/01), implemented through EudraLex Volume 4 and enforced by national competent authorities, tightens the bar for audit-ready temperature control, supplier qualification, and lane validation. This aligns with the report context that the EMA ended blanket GDP certificate extensions in 2025, which increases reliance on certified third-party logistics partners.
Global alignment is reinforced by WHO Good Distribution Practices (TRS 957 Annex 5 and TRS 1025 Annex 7), which are used as reference frameworks in markets building or updating GDP systems. For veterinary supply chains, Commission Implementing Regulations (EU) 2025/2091 and (EU) 2025/2154 entered into full application on 16 July 2026, adding another compliance layer for operators serving multi-species portfolios and shared infrastructures. Regulators and auditors have also broadened attention to last-mile and direct-to-patient/direct-to-hospital models, raising expectations around courier qualification, temperature mapping, and data integrity in distributed delivery networks.
Value Chain Analysis
The value chain starts with biopharma manufacturers, CROs/CMOs, and clinical-trial sponsors that set product stability profiles and release needs, including labeling, kitting, and qualified-person release. They then select compliant packaging (passive PCM shippers, dry-ice solutions, or cryogenic shippers for ultra-cold lanes) and monitoring devices. Upstream suppliers include packaging and sensor/IoT module providers, dry-ice and liquid-nitrogen supply partners, and validation service firms that qualify pack-outs, routes, and handling SOPs. This work is followed by freight forwarders, airlines, ground handlers, and integrators running GDP-aligned control towers, then multi-temperature warehousing and distribution nodes placed near airports, seaports, and dense patient populations.
Execution depends on certified infrastructure and standardization across handoffs, with IATA CEIV Pharma often used as a procurement anchor for auditing airlines, handlers, and forwarders against GDP alongside IATA temperature-control practices. The chain is increasingly organized around regional, automated, multi-temperature campuses to reduce transfer time and excursion risk. This is illustrated by DHL Supply Chain taking over management of Sanofi's vaccine distribution center in Val-de-Reuil, France (February 2026) and McKesson selecting Moore, Oklahoma for a 330,000-square-foot highly automated regional pharmaceutical distribution facility with expanded cold-chain capacity and full standby power (June 2026). Cross-docking at air gateways and compliant last-mile partners remain common bottlenecks, especially for time-critical biologics and decentralized clinical-trial shipments, where multiple small consignments increase scan, data, and temperature-control requirements.
Competitive Landscape
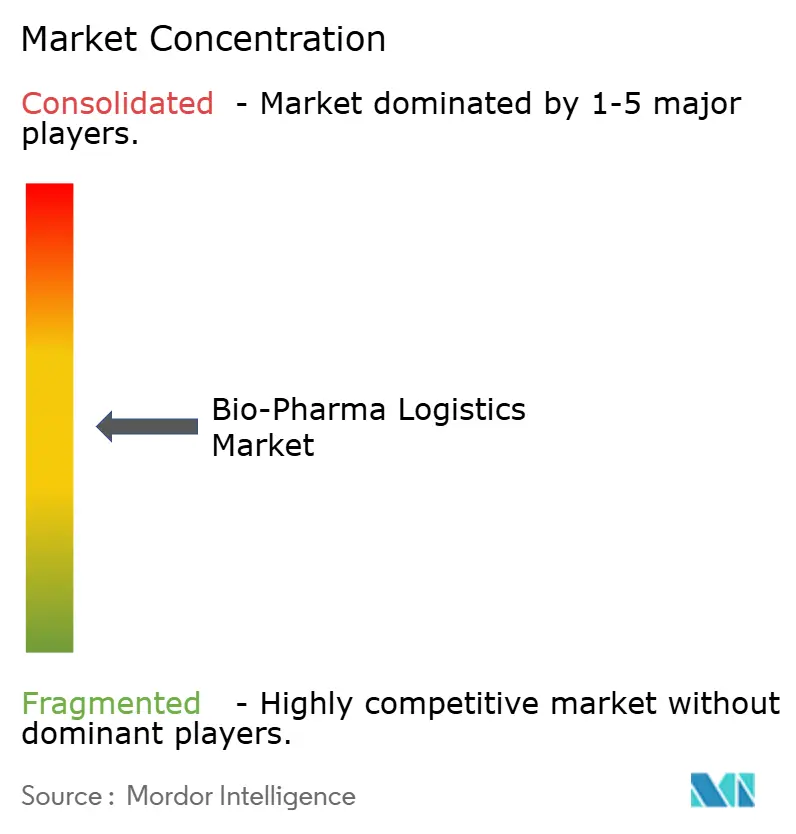
The bio-pharma logistics market is moderately consolidated, with the top five integrators controlling an estimated majority of global certified capacity. DHL, UPS, FedEx, Kuehne+Nagel, and DB Schenker leverage capital strength to scale multi-temperature campuses and AI-enabled control towers. DHL earmarked EUR 2 billion (USD 2.29 billion) for health logistics through 2030, including new deep-freeze chambers to reinforce cell-therapy lanes. UPS followed with targeted European and Canadian acquisitions, adding six-zone warehouses and passive packaging know-how.
Specialists such as Cryoport Systems and World Courier differentiate via end-to-end solutions for personalized medicines. Cryoport’s strategic alliance with SK pharmteco merges vector manufacturing and cryogenic transport services to capture value along the advanced-therapy chain. Meanwhile, regional players invest in vertical integration; Asia’s YCH Group and Kerry Logistics deploy virtual temperature dashboards to compete against global integrators in local last-mile execution.
Technology adoption forms the new battleground. Providers integrate blockchain-verified electronic documentation to streamline customs releases and employ predictive analytics to forecast dry-ice replenishment cycles. Sustainability initiatives—including electric-truck fleets and reusable phase-change shippers—serve both cost and brand equity goals as clients seek carbon-neutral supply chains.
White-space remains in underserved emerging markets where GDP facilities are scarce. Firms offering socially accepted temperature-controlled drone delivery and solar-powered cold rooms stand to capture growth, provided they secure local regulatory approvals.
Bio-Pharma Logistics Industry Leaders
Deutsche Post DHL Group
Kuehne + Nagel
UPS (Marken)
FedEx
DSV
- *Disclaimer: Major Players sorted in no particular order

Market Opportunities and Future Outlook
One opportunity is expanding and upgrading multi-temperature storage and transfer infrastructure at major pharma nodes, particularly for biologics, vaccines, and advanced therapies where tighter control is needed at handoff points. Capacity additions in 2026 point to active whitespace filling, including Movianto expanding its Aalst, Belgium site to increase temperature-controlled pallet storage and Langham Logistics opening a large cold-chain facility in Plainfield, Indiana, with significant 2-8 C capacity. These investments support shippers that want to reduce dwell times and excursion risk, while managing higher SKU complexity and smaller shipment sizes tied to specialty medicines and clinical-trial distribution.
Another opportunity is integrated, data-driven cold-chain execution that ties together packaging, monitoring, and orchestration across modes and partners. UPS announced a USD 48 million investment in 27 temperature-controlled cross-dock facilities across the Americas, Europe, and Asia (June 2026), and DHL expanded an airfreight cold-chain network with a dedicated Brussels-Cincinnati Boeing 777 freighter lane (February 2026), reflecting continued build-out of time-critical lanes for high-value products. Services that operationalize compliance also support growth in value-added offerings, including labeling, kitting, and qualified-person release, alongside control-tower models. This demand is reinforced as direct-to-patient and decentralized trial logistics increase the number of touchpoints requiring auditable temperature and chain-of-custody data.
Recent Industry Developments
- July 2026: FedEx launched a dedicated FedEx Life Sciences organization focused on pharmaceuticals, medical devices, and clinical trials. The move consolidates healthcare-specific capabilities under a specialized structure designed to manage higher service complexity, including temperature control and time-critical handling across global networks.
- June 2026: UPS announced a USD 48 million investment in 27 temperature-controlled cross-dock facilities across the United States and select international markets. Expanding cross-dock coverage at major transfer points reduces exposure during air-to-ground handoffs and strengthens capacity for biologics and specialty-pharma flows.
- May 2025: DHL Group expanded its Life Sciences and Healthcare campus in Florstadt, Germany, adding a fourth logistics center and increasing total capacity to about 140,000 pallets. The expansion strengthens multi-temperature warehousing depth in a key European hub used for regulated distribution and value-added services.


Research Methodology Framework and Report Scope
Market Definition and Coverage
For this study, the market is defined as third-party logistics services used to move, store, and distribute biopharma products under required handling conditions (including temperature-controlled needs), from manufacturing release through clinical and commercial delivery, across global trade lanes.
Scope exclusions: We exclude small-molecule pharmaceuticals, diagnostic reagents, medical devices, and captive in-house logistics that are not sold as third-party services.
Segmentation Overview
- By Service
- Transportation
- Road
- Rail
- Sea/Ocean
- Air
- Warehousing & Distribution
- Value-Added Services (Labelling, Kitting, QP Release)
- Transportation
- By Temperature Range
- Cold Chain
- Ambient (15-25 °C)
- Refrigerated (2–8 °C)
- Frozen (0 °C to -20 °C)
- Ultra-Cold / Cryogenic (-20 °C to -150 °C)
- Non Cold Chain
- Cold Chain
- By Product Type
- Vaccines & Immunotherapies
- Cell & Gene Therapies
- APIs & Bulk Biologics
- Finished Dose Biologics
- Others
- By End-user
- Bio-Pharma Manufacturers
- CROs (Contract Research Organizations) & CMOs (Contract Manufacturing Organizations)
- Hospitals & Clinical-Trial Sites
- Other End Users
- By Geography
- North America
- United States
- Canada
- Mexico
- South America
- Brazil
- Peru
- Chile
- Argentina
- Rest of South America
- Asia-Pacific
- India
- China
- Japan
- Australia
- South Korea
- South East Asia (Singapore, Malaysia, Thailand, Indonesia, Vietnam, and Philippines)
- Rest of Asia-Pacific
- Europe
- United Kingdom
- Germany
- France
- Spain
- Italy
- BENELUX (Belgium, Netherlands, and Luxembourg)
- NORDICS (Denmark, Finland, Iceland, Norway, and Sweden)
- Rest of Europe
- Middle East And Africa
- United Arab Emirates
- Saudi Arabia
- South Africa
- Nigeria
- Rest of Middle East And Africa
- North America
Data Sources, Market Sizing, and Validation
Desk Research
Desk research started by mapping what counts as biopharma shipments and where logistics spending is actually recorded, so the market does not get mixed with broader healthcare freight. We used public sources such as World Health Organization publications, World Trade Organization trade indicators, UN Comtrade category-level shipment data, and U.S. FDA and EMA guidance that influences how companies structure handling and compliance, plus OECD macro series to align the demand context.
We then cross-checked demand signals and operating realities using sources such as annual reports and investor presentations from listed logistics providers, airport and air cargo statistics, and credible press coverage of cold chain capacity expansions and lane disruptions. Where helpful, we referenced paid subscriptions for company financials and intelligence, patent databases for packaging and monitoring innovations, and shipment-level import and export databases to sanity-check trade intensity. The sources listed here are illustrative only, and many other public and paid references were also used to collect data, validate assumptions, and clarify open questions.
Primary Interviews and Surveys
Primary work focused on interviews and surveys with logistics operators, cold chain packaging and monitoring specialists, and biopharma supply chain leaders who manage lane choice, service levels, and compliance expectations. We covered APAC, EMEA, and the Americas so assumptions on temperature-controlled share, air versus ocean balance, and premium handling fees could be aligned to how shipments move in each region.
Distribution of primary research fieldwork respondents
| Company type | Respondent position | Region |
|---|---|---|
| Top tier: 35% | CXOs: 14% | APAC: 48% |
| Mid tier: 48% | Functional/Unit leaders: 27% | EMEA: 29% |
| Smaller Players: 17% | Managers: 59% | Americas: 23% |
Market-Sizing & Forecasting
Sizing begins with a top-down build where biopharma output and trade flows are reconstructed into a serviceable logistics spend pool, then adjusted for cold chain intensity by lane and product handling needs. What makes the model work in practice is that a few inputs are tracked consistently, such as the share of biologics within pharma pipelines, temperature-controlled shipment mix, air freight reliance for time-sensitive therapies, lane complexity (cross-border versus domestic), and the pass-through of packaging, monitoring, and compliance services into logistics bills.
Those totals are then corroborated through selective bottom-up checks, mainly by sampling provider revenues, applying service mix splits, and validating implied average logistics spend per shipment class. When revenue disclosures are incomplete, gaps are handled using peer benchmarking and capacity-linked proxies (for example, warehousing footprint and cold-room utilization signals), followed by re-checks with interview inputs. Forecasts rely on scenario analysis, where assumptions on biologics growth, cold chain penetration, pricing pressure, and network expansions are stress-tested before the final trajectory is locked.
Data Validation & Update Cycle
Validation is done through repeated triangulation between the model and independent market signals, such as air cargo trends, biopharma manufacturing expansions, and observable cold chain infrastructure additions. Outliers are flagged early, and the underlying drivers are reviewed again so one-off events do not distort the time series.
Before sign-off, a second analyst reviews the calculation chain, and clarification calls are triggered when a key assumption changes or a major variance appears versus external indicators. Reports are refreshed annually, with interim updates when material events occur, and a final pre-delivery check is completed so the latest information is reflected.
Mordor Intelligence's Global Biopharma Logistics Market Size Compared Against Other Published Estimates
Published market values for biopharma logistics do not always match because each publisher draws the market boundary in a different place, and they may also use different years, currency timing, and service inclusions. The biggest differences we observed typically relate to what is treated as logistics services versus adjacent activities, and how cold chain premiums are applied over time.
The main gap comes from whether packaging, monitoring, and other add-on services are fully bundled into logistics. Mordor Intelligence counts these only when they are part of a paid logistics contract for biopharma shipments, rather than a separate product sale or internal activity. Differences can also show up when one estimate uses a single global uplift for cold chain pricing, while another adjusts by lane mix, air share, and therapy sensitivity, which tends to change the current-year value.
Benchmark comparison
| Source | Market Size | Gaps in Research Methodology |
|---|---|---|
| Mordor Intelligence | USD 152.04 B (2026) | |
| Industry Publisher A | USD 135.88 B (2024) | Uses a 2024 base year and a broader service checklist that explicitly lists packaging and monitoring, which can inflate logistics revenue where these are accounted outside transport and warehousing contracts. |
| Research Portal B | USD 143.19 B (2024) | Reports in USD million with limited stated exclusions, and the split is framed at a high level (cold chain versus non-cold chain), which can miss lane-level mix effects that shift the implied pricing and spend. |
The spread across the three figures is largely explained by year choice and what gets bundled into logistics service revenue, especially for cold chain related add-ons. By keeping the inputs tied to shipment handling needs and checking implied spend against provider disclosures and trade intensity signals, the resulting value is easier to trace and repeat when the market is updated.


Key Questions Answered in the Report
What is the current size of the bio pharma logistics market?
The bio pharma logistics market reached USD 152.04 billion in 2026 and is on track to hit USD 234.58 billion by 2031.
Which segment in the bio pharma logistics market is growing the fastest?
Value-added services—such as labeling, kitting, and qualified-person release—are expanding at 10.77% CAGR, outpacing traditional transportation.
Why is ultra-cold logistics crucial for future growth?
Advanced mRNA and cell & gene therapies require temperatures down to −150 °C, driving investment in cryogenic infrastructure and specialized packaging.
Which region will contribute the most incremental growth through 2031?
Asia-Pacific holds the highest forecast CAGR at 11.06%, supported by rising biomanufacturing and clinical-trial activity.
How are sustainability goals influencing the industry?
Shippers and carriers are adopting reusable packaging, electrified fleets, and route-optimization algorithms to cut emissions that comprise over 80% of pharma supply-chain carbon output.
Page last updated on:


 Your data is secure and never sold or shared.


