
| Study Period | 2017 - 2030 |
| Base Year For Estimation | 2024 |
| Forecast Data Period | 2025 - 2030 |
| Market Size (2025) | USD 1.93 Billion |
| Market Size (2030) | USD 3.48 Billion |
| CAGR (2025 - 2030) | 12.44 % |
| Market Concentration | Low |
Major Players*Disclaimer: Major Players sorted in no particular order |


Bioinsecticides Market Analysis
The Bioinsecticides Market size is estimated at 1.93 billion USD in 2025, and is expected to reach 3.48 billion USD by 2030, growing at a CAGR of 12.44% during the forecast period (2025-2030).
The bioinsecticides industry is experiencing a significant transformation driven by the global shift toward sustainable agricultural practices. As of 2021, there were 72.3 million hectares of organic agricultural land worldwide, demonstrating the increasing adoption of eco-friendly farming methods. Major agricultural nations are implementing stringent regulations to promote sustainable farming practices and reduce chemical pesticide usage. The integration of bioinsecticides into modern farming systems represents a fundamental shift in agricultural practices, with farmers increasingly recognizing the long-term benefits of biological pest control solutions. This transition is further supported by advancing research and development in microbial insecticides and botanical-based insecticides, particularly those utilizing Bacillus thuringiensis and Beauveria bassiana strains.
Regulatory frameworks worldwide are increasingly favoring biological pest control solutions over chemical alternatives. The European Union has set an ambitious target of achieving 25% organic farming coverage across its agricultural land by 2030, while simultaneously mandating a 50% reduction in chemical pesticide usage. In a significant regulatory move, Saudi Arabia has banned 201 chemical pesticides, exemplifying the growing global trend toward stricter regulation of synthetic pesticides. These regulatory changes are compelling agricultural stakeholders to adopt bioinsecticide solutions, creating a more favorable market environment for biological pest control products.
Technological advancements in bioinsecticide formulation and application methods are revolutionizing the industry. The development of new strains of beneficial microorganisms and improved delivery systems has enhanced the efficacy of bioinsecticides in controlling target pests. Research institutions and companies are focusing on developing more stable formulations that can withstand various environmental conditions while maintaining their effectiveness. The integration of bioinsecticides with precision agriculture technologies is enabling more targeted and efficient application methods, reducing waste and improving overall pest management outcomes.
The market is witnessing a paradigm shift in pest management strategies, with bioinsecticides becoming an integral component of Integrated Pest Management (IPM) programs. China, the world's largest pesticide user, has announced plans to reduce pesticide use by 10% in horticultural crops and 5% in rice, wheat, and corn cultivation by 2025, signaling a major shift in agricultural practices in the Asia-Pacific region. The European organic market has demonstrated substantial growth, reaching EUR 52 billion, indicating strong consumer demand for organically grown produce. This shift is driving agricultural producers to adopt more sustainable pest control solutions, with bioinsecticides playing a crucial role in meeting these changing market demands. The rise of agricultural biologicals and natural pest control methods is further bolstering this transition, as they offer effective biological crop protection and organic pest control alternatives.
Global Bioinsecticides Market Trends
Organic production is at an all-time high in North America and Europe, due to the increasing awareness and Government initiatives.
- Organic agriculture has emerged as a significant contributor to sustainable food systems, with 187 countries practicing it globally. As of 2021, there was 72.3 million ha of organic agricultural land worldwide, with an average increase of 2.9% across all regions from 2018 to 2021. Organic arable land accounted for 14.4 million ha, representing 19.9% of the total organic agricultural land.
- The strongest markets for organic farming are North America and Europe, accounting for 41.0% of the global organic arable land. In 2022, Europe had 6.5 million ha of organic arable land, equivalent to 44.1% of the overall organic arable agricultural area. The most significant crops grown organically in North America and Europe are apples, strawberries, cereals, and olives.
- Developing countries in Asia-Pacific are also joining the organic agriculture movement and becoming self-sufficient in producing and providing fresh organic produce to meet their domestic demand. The trend of organic farming is gaining momentum in Asia-Pacific, with the region recording an 18.8% increase in organic arable land from 2017 to 2022. The major initiatives by governments in the region also play a vital role in the growing trend of organic farming. For example, Japan's Basic Plan for Food, Agriculture, and Rural Areas aims to triple the number of organic farmers and lands by 2030.
- The growth of organic agriculture is driven by the rising awareness of the benefits of organic farming, such as promoting soil health, reducing environmental impacts, and producing healthier food.

Understand The Key Trends Shaping This Market
Download PDF
Per capita spending of organic food majorly observed in United States and Germany, attributed to the consumer demand for healthier and sustainable food
- The organic food market experienced significant growth in the past few years, with global sales reaching USD 120.6 billion in 2020, up from USD 70.8 billion in 2012. The trend toward organic food is being driven by several factors, such as increasing consumer demand for healthier, more sustainable food options and a growing awareness of the environmental impact of conventional agriculture. The global organic food market is expected to continue its growth trend over the coming years.
- According to a survey conducted by the Organic Trade Association in 2021, sales of organic fruits and vegetables increased by around 4.5% in the same year, accounting for 15% of the overall organic sales. North America dominates the market in terms of average spending on organic products, with per capita spending in the United States reaching USD 186.7 in 2021, the highest among all North American countries. Europe is also expected to experience significant growth in the organic food market, with Germany accounting for the highest per capita spending of USD 75.6 in 2021.
- While the organic food market is still dominated by developed countries with high consumer disposable incomes, it is also expected to grow in developing nations. For example, the increasing number of working-class people in the Asia-Pacific region may contribute to the market's expansion due to the growing availability and affordability of organic food products.

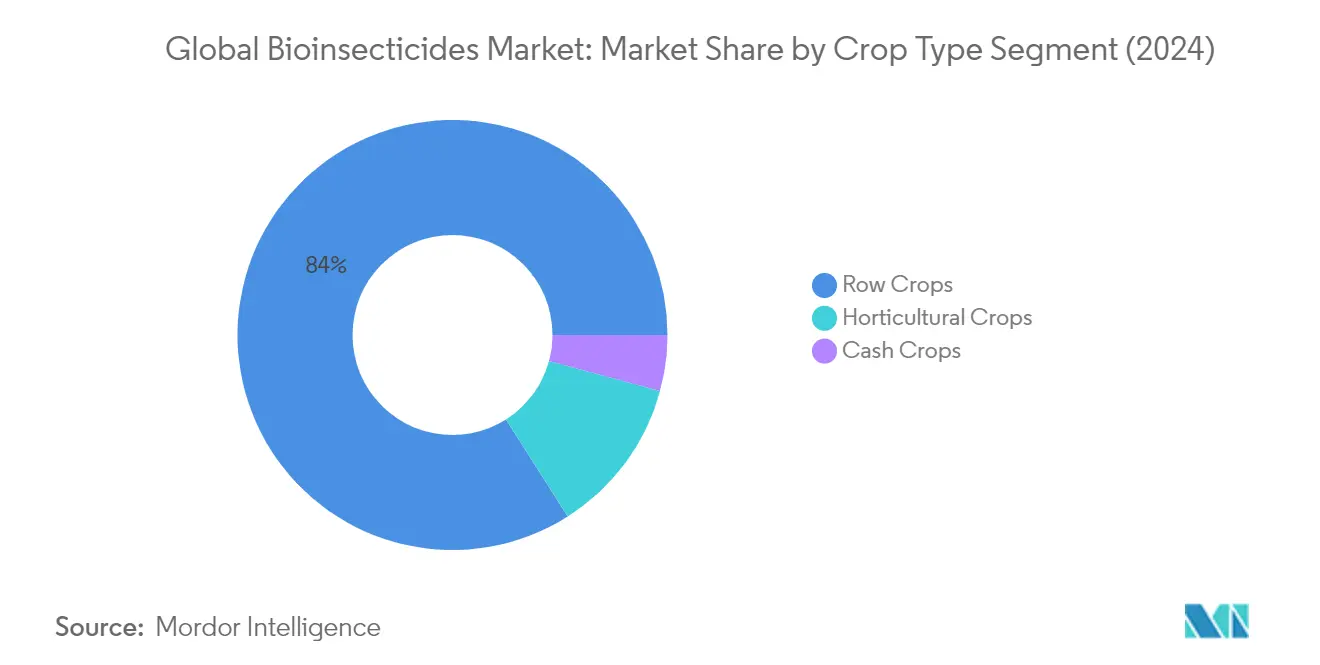
Segment Analysis: Crop Type
Row Crops Segment in Global Bioinsecticides Market
Row crops continue to dominate the global bioinsecticides market, accounting for approximately 84% of the total market value in 2024. This significant market share is primarily attributed to the extensive cultivation area of major crops, including barley, corn, wheat, rapeseed, rye, sunflower, soybean, and rice globally. The segment's dominance is particularly pronounced in North America and Europe, which together account for about 41% of the global organic arable land. The increasing pest pressure due to growing crop field sizes and decreasing seminatural areas has made bioinsecticides an essential sustainable method for pest control in row crops. The effectiveness of products like Bt insecticides, specifically Bacillus thuringiensis (Bt), in controlling various pests, particularly in crops like corn and soybeans, has further strengthened the segment's market position.
Row Crops Segment in Global Bioinsecticides Market
The row crops segment is projected to maintain its growth momentum, with an estimated growth rate of approximately 12% between 2024 and 2029. This robust growth is driven by several factors, including the increasing adoption of integrated pest management practices, growing awareness about sustainable agriculture, and the rising demand for organic row crops. The segment's growth is further supported by government initiatives promoting organic farming practices and the reduction of chemical pesticide usage. The effectiveness of biological insecticides in controlling major crop pests while maintaining ecological balance has made them an increasingly preferred choice among farmers. Additionally, the rising global demand for organically grown staple crops and the implementation of stricter regulations on chemical pesticide usage are expected to further accelerate the segment's growth.
Remaining Segments in Crop Type
The horticultural crops and cash crops segments represent important niches in the bioinsecticides market, each serving distinct agricultural needs. The horticultural crops segment, which includes fruits, vegetables, and ornamental plants, has shown significant potential due to the increasing demand for chemical-free produce and the higher value addition in these crops. The cash crops segment, encompassing crops like coffee, tea, cocoa, and cotton, has also demonstrated steady growth, particularly in regions where organic certification commands premium prices. Both segments benefit from the growing trend toward sustainable agriculture and the increasing awareness of environmental and health concerns associated with chemical pesticides. The use of microbial insecticides, including bacterial insecticides, is gaining traction in these segments, offering effective pest control solutions that align with organic farming practices.
Bioinsecticides Market Geography Segment Analysis
Bioinsecticides Market in Africa
The African bioinsecticides market demonstrates significant potential for growth through sustainable and eco-friendly pest management practices. The region's agricultural sector is experiencing a transformation, with countries like Egypt, Nigeria, and South Africa leading the adoption of biological pest control solutions. These nations are implementing various initiatives to promote organic farming practices and reduce chemical pesticide usage, with Egypt's Ministry of Agriculture and Land Reclamation proposing strategies to significantly cut chemical pesticide use. The increasing trend toward organic cultivation across the continent is driving the demand for biological insecticides as farmers recognize their effectiveness in pest control while maintaining environmental sustainability.
Bioinsecticides Market in Nigeria
Nigeria emerges as the dominant force in Africa's bioinsecticides market, commanding approximately 35% market share in 2024. The country has established itself as a significant player in the organic agriculture industry with an array of major organic crops, including rice, maize, yams, cassava, cocoa, and coffee. The Nigerian government actively promotes organic farming through various initiatives, including the National Organic Agriculture Programme and organizations like the Olusegun Obasanjo Centre for Organic Agriculture Research and Development. Row crops dominate the biological insecticides consumption in Nigeria, reflecting the country's extensive cultivation of these crop types and the growing awareness among farmers about sustainable pest management practices.
Growth Dynamics in Nigeria
Nigeria continues to demonstrate remarkable growth potential in the bioinsecticides market, with a projected CAGR of approximately 11% from 2024 to 2029. The country's expansion in the bioinsecticides sector is driven by increasing organic farming practices and the implementation of sustainable agricultural methods. The trend toward organic farming is rising steadily, supported by government initiatives and growing awareness among farmers about the benefits of biological pest control. The country's organic crop area has shown consistent expansion, particularly in row crops, which represent a significant portion of the total organic agricultural land. This growth is further supported by various government programs aimed at promoting sustainable agriculture and reducing dependency on chemical pesticides.
Get Analysis on Important Geographic Markets
Download PDF
Bioinsecticides Industry Overview
Top Companies in Bioinsecticides Market
The biopesticides market features established players like Corteva Agriscience, Coromandel International, and Valent Biosciences leading the industry through continuous innovation and strategic expansion. Companies are actively investing in research and development to enhance their product portfolios, particularly focusing on developing new microbial strains and improving formulation technologies. Strategic moves in the sector predominantly revolve around acquisitions of biologicals-based companies and expansion of manufacturing facilities to meet growing demand. Operational agility is demonstrated through the establishment of specialized research centers and technical support teams that assist customers with product application and solutions. Companies are also strengthening their distribution networks globally while simultaneously developing region-specific product portfolios to cater to local agricultural needs and requirements.
Fragmented Market with Regional Growth Opportunities
The global biopesticides industry exhibits a highly fragmented structure with a mix of multinational corporations and regional specialists competing across different geographical segments. The top players collectively hold a relatively small market share, indicating significant opportunities for new entrants and medium-sized companies to establish their presence. Large agricultural conglomerates are leveraging their extensive distribution networks and research capabilities to maintain their competitive position, while regional players are capitalizing on their local market knowledge and specialized product offerings to serve specific crop segments.
Merger and acquisition activities in the sector are primarily driven by large companies seeking to expand their biological product portfolios and geographical presence. Companies are particularly interested in acquiring firms with strong research capabilities and innovative technologies in microbial-based solutions. The market is witnessing increased collaboration between research institutions and commercial entities to develop new bioinsecticide formulations and applications, creating a dynamic competitive environment that encourages innovation and technological advancement.
Innovation and Sustainability Drive Future Success
Success in the biological crop protection market increasingly depends on companies' ability to develop effective, broad-spectrum products while maintaining competitive pricing. Market leaders are focusing on building comprehensive product portfolios that address multiple crop protection needs and are compatible with integrated pest management programs. Companies are also investing in sustainable production methods and organic certification to align with growing environmental concerns and regulatory requirements. The development of user-friendly formulations and improved shelf stability is becoming crucial for market success, as these factors significantly influence farmer adoption rates.
For new entrants and smaller players, success lies in identifying and serving niche market segments while building strong technical support capabilities. Companies need to establish robust distribution networks and develop close relationships with farmers through training programs and demonstration activities. The ability to navigate complex regulatory requirements across different regions while maintaining product quality and effectiveness will be crucial for long-term success. Future market leaders will likely be those who can successfully balance product innovation with sustainable practices while maintaining cost competitiveness and ensuring consistent product availability.
Bioinsecticides Market Leaders
-
Coromandel International Ltd
-
Corteva Agriscience
-
IPL Biologicals Limited
-
Seipasa SA
-
Valent Biosciences LLC
- *Disclaimer: Major Players sorted in no particular order

Need More Details on Market Players and Competiters?
Download PDF
Bioinsecticides Market News
- September 2022: Corteva Agriscience signed an agreement to acquire a biologicals-based company Symborg as a part of its strategy to expand its biologicals portfolio. This move would help Corteva Agriscience achieve its goal of becoming a global leader in the agricultural biological market.
- June 2022: Valent BioSciences LLC confirmed that it approved a big expansion of its biorational manufacturing facility in Osage, Iowa, to meet the rising demand for its biorational products and introduce new products that will necessitate more capacity.
- May 2022: The company invested a sum of EUR 4 million in upgrading its facilities with new technologies and equipment to suit the manufacture of a new line of products in the market. This advanced technology will be more sustainable using materials and efficient energy consumption.
Free With This Report
Along with the report, We also offer a comprehensive and exhaustive data pack on Areas under organic cultivation, one of the key trends that affect the market size of agricultural biologicals. This data pack also includes areas under cultivation by crop types, such as Row Crops (Cereals, Pulses, and Oilseeds), Horticultural Crops (Fruits and Vegetables), and Cash Crops in North America, Europe, Asia-Pacific, South America and Africa.


Bioinsecticides Market Report - Table of Contents
1. EXECUTIVE SUMMARY & KEY FINDINGS
2. REPORT OFFERS
3. INTRODUCTION
- 3.1 Study Assumptions & Market Definition
- 3.2 Scope of the Study
- 3.3 Research Methodology
4. KEY INDUSTRY TRENDS
- 4.1 Area Under Organic Cultivation
- 4.2 Per Capita Spending On Organic Products
-
4.3 Regulatory Framework
- 4.3.1 Argentina
- 4.3.2 Australia
- 4.3.3 Brazil
- 4.3.4 Canada
- 4.3.5 China
- 4.3.6 Egypt
- 4.3.7 France
- 4.3.8 Germany
- 4.3.9 India
- 4.3.10 Indonesia
- 4.3.11 Italy
- 4.3.12 Japan
- 4.3.13 Mexico
- 4.3.14 Netherlands
- 4.3.15 Nigeria
- 4.3.16 Philippines
- 4.3.17 Russia
- 4.3.18 South Africa
- 4.3.19 Spain
- 4.3.20 Thailand
- 4.3.21 Turkey
- 4.3.22 United Kingdom
- 4.3.23 United States
- 4.3.24 Vietnam
- 4.4 Value Chain & Distribution Channel Analysis
5. MARKET SEGMENTATION (includes market size in Value in USD and Volume, Forecasts up to 2030 and analysis of growth prospects)
-
5.1 Crop Type
- 5.1.1 Cash Crops
- 5.1.2 Horticultural Crops
- 5.1.3 Row Crops
-
5.2 Region
- 5.2.1 Africa
- 5.2.1.1 By Country
- 5.2.1.1.1 Egypt
- 5.2.1.1.2 Nigeria
- 5.2.1.1.3 South Africa
- 5.2.1.1.4 Rest of Africa
- 5.2.2 Asia-Pacific
- 5.2.2.1 By Country
- 5.2.2.1.1 Australia
- 5.2.2.1.2 China
- 5.2.2.1.3 India
- 5.2.2.1.4 Indonesia
- 5.2.2.1.5 Japan
- 5.2.2.1.6 Philippines
- 5.2.2.1.7 Thailand
- 5.2.2.1.8 Vietnam
- 5.2.2.1.9 Rest of Asia-Pacific
- 5.2.3 Europe
- 5.2.3.1 By Country
- 5.2.3.1.1 France
- 5.2.3.1.2 Germany
- 5.2.3.1.3 Italy
- 5.2.3.1.4 Netherlands
- 5.2.3.1.5 Russia
- 5.2.3.1.6 Spain
- 5.2.3.1.7 Turkey
- 5.2.3.1.8 United Kingdom
- 5.2.3.1.9 Rest of Europe
- 5.2.4 Middle East
- 5.2.4.1 By Country
- 5.2.4.1.1 Iran
- 5.2.4.1.2 Saudi Arabia
- 5.2.4.1.3 Rest of Middle East
- 5.2.5 North America
- 5.2.5.1 By Country
- 5.2.5.1.1 Canada
- 5.2.5.1.2 Mexico
- 5.2.5.1.3 United States
- 5.2.5.1.4 Rest of North America
- 5.2.6 South America
- 5.2.6.1 By Country
- 5.2.6.1.1 Argentina
- 5.2.6.1.2 Brazil
- 5.2.6.1.3 Rest of South America
6. COMPETITIVE LANDSCAPE
- 6.1 Key Strategic Moves
- 6.2 Market Share Analysis
- 6.3 Company Landscape
-
6.4 Company Profiles (includes Global Level Overview, Market Level Overview, Core Business Segments, Financials, Headcount, Key Information, Market Rank, Market Share, Products and Services, and Analysis of Recent Developments).
- 6.4.1 Andermatt Group AG
- 6.4.2 Certis U.S.A. LLC
- 6.4.3 Coromandel International Ltd
- 6.4.4 Corteva Agriscience
- 6.4.5 IPL Biologicals Limited
- 6.4.6 Jaipur Bio Fertilizers
- 6.4.7 Lallemand Inc.
- 6.4.8 Seipasa SA
- 6.4.9 T.Stanes and Company Limited
- 6.4.10 Valent Biosciences LLC
7. KEY STRATEGIC QUESTIONS FOR AGRICULTURAL BIOLOGICALS CEOS
8. APPENDIX
-
8.1 Global Overview
- 8.1.1 Overview
- 8.1.2 Porter’s Five Forces Framework
- 8.1.3 Global Value Chain Analysis
- 8.1.4 Market Dynamics (DROs)
- 8.2 Sources & References
- 8.3 List of Tables & Figures
- 8.4 Primary Insights
- 8.5 Data Pack
- 8.6 Glossary of Terms
You Can Purchase Parts Of This Report. Check Out Prices For Specific Sections
Get Price Break-up Now
List of Tables & Figures
- Figure 1:
- AREA UNDER ORGANIC CULTIVATION IN HECTARES, GLOBAL, 2017 - 2022
- Figure 2:
- PER CAPITA SPENDING ON ORGANIC PRODUCTS IN USD, GLOBAL, 2017 - 2022
- Figure 3:
- GLOBAL BIOINSECTICIDES MARKET, VOLUME, METRIC TON, 2017 - 2029
- Figure 4:
- GLOBAL BIOINSECTICIDES MARKET, VALUE, USD, 2017 - 2029
- Figure 5:
- BIOINSECTICIDES CONSUMPTION IN METRIC TON, GLOBAL, 2017 - 2029
- Figure 6:
- BIOINSECTICIDES CONSUMPTION IN USD, GLOBAL, 2017 - 2029
- Figure 7:
- BIOINSECTICIDES CONSUMPTION VOLUME BY CROP TYPE IN %, GLOBAL, 2017 VS 2023 VS 2029
- Figure 8:
- BIOINSECTICIDES CONSUMPTION VALUE BY CROP TYPE IN %, GLOBAL, 2017 VS 2023 VS 2029
- Figure 9:
- BIOINSECTICIDES CONSUMPTION BY CASH CROPS IN METRIC TON, GLOBAL, 2017 - 2029
- Figure 10:
- BIOINSECTICIDES CONSUMPTION BY CASH CROPS IN USD, GLOBAL, 2017 - 2029
- Figure 11:
- BIOINSECTICIDES CONSUMPTION VALUE BY REGION IN %, GLOBAL, 2021 VS 2028
- Figure 12:
- BIOINSECTICIDES CONSUMPTION BY HORTICULTURAL CROPS IN METRIC TON, GLOBAL, 2017 - 2029
- Figure 13:
- BIOINSECTICIDES CONSUMPTION BY HORTICULTURAL CROPS IN USD, GLOBAL, 2017 - 2029
- Figure 14:
- BIOINSECTICIDES CONSUMPTION VALUE BY REGION IN %, GLOBAL, 2021 VS 2028
- Figure 15:
- BIOINSECTICIDES CONSUMPTION BY ROW CROPS IN METRIC TON, GLOBAL, 2017 - 2029
- Figure 16:
- BIOINSECTICIDES CONSUMPTION BY ROW CROPS IN USD, GLOBAL, 2017 - 2029
- Figure 17:
- BIOINSECTICIDES CONSUMPTION VALUE BY REGION IN %, GLOBAL, 2021 VS 2028
- Figure 18:
- BIOINSECTICIDES CONSUMPTION IN METRIC TON, GLOBAL, 2017 - 2029
- Figure 19:
- BIOINSECTICIDES CONSUMPTION IN USD, GLOBAL, 2017 - 2029
- Figure 20:
- BIOINSECTICIDES CONSUMPTION VOLUME BY REGION IN %, GLOBAL, 2017 VS 2023 VS 2029
- Figure 21:
- BIOINSECTICIDES CONSUMPTION VALUE BY REGION IN %, GLOBAL, 2017 VS 2023 VS 2029
- Figure 22:
- BIOINSECTICIDES CONSUMPTION IN METRIC TON, AFRICA, 2017 - 2029
- Figure 23:
- BIOINSECTICIDES CONSUMPTION IN USD, AFRICA, 2017 - 2029
- Figure 24:
- BIOINSECTICIDES CONSUMPTION VOLUME BY COUNTRY IN %, AFRICA, 2017 VS 2023 VS 2029
- Figure 25:
- BIOINSECTICIDES CONSUMPTION VALUE BY COUNTRY IN %, AFRICA, 2017 VS 2023 VS 2029
- Figure 26:
- BIOINSECTICIDES CONSUMPTION IN METRIC TON, EGYPT, 2017 - 2029
- Figure 27:
- BIOINSECTICIDES CONSUMPTION IN USD, EGYPT, 2017 - 2029
- Figure 28:
- BIOINSECTICIDES CONSUMPTION VALUE BY CROP TYPE IN %, EGYPT, 2021 VS 2028
- Figure 29:
- BIOINSECTICIDES CONSUMPTION IN METRIC TON, NIGERIA, 2017 - 2029
- Figure 30:
- BIOINSECTICIDES CONSUMPTION IN USD, NIGERIA, 2017 - 2029
- Figure 31:
- BIOINSECTICIDES CONSUMPTION VALUE BY CROP TYPE IN %, NIGERIA, 2021 VS 2028
- Figure 32:
- BIOINSECTICIDES CONSUMPTION IN METRIC TON, SOUTH AFRICA, 2017 - 2029
- Figure 33:
- BIOINSECTICIDES CONSUMPTION IN USD, SOUTH AFRICA, 2017 - 2029
- Figure 34:
- BIOINSECTICIDES CONSUMPTION VALUE BY CROP TYPE IN %, SOUTH AFRICA, 2021 VS 2028
- Figure 35:
- BIOINSECTICIDES CONSUMPTION IN METRIC TON, REST OF AFRICA, 2017 - 2029
- Figure 36:
- BIOINSECTICIDES CONSUMPTION IN USD, REST OF AFRICA, 2017 - 2029
- Figure 37:
- BIOINSECTICIDES CONSUMPTION VALUE BY CROP TYPE IN %, REST OF AFRICA, 2021 VS 2028
- Figure 38:
- BIOINSECTICIDES CONSUMPTION IN METRIC TON, ASIA-PACIFIC, 2017 - 2029
- Figure 39:
- BIOINSECTICIDES CONSUMPTION IN USD, ASIA-PACIFIC, 2017 - 2029
- Figure 40:
- BIOINSECTICIDES CONSUMPTION VOLUME BY COUNTRY IN %, ASIA-PACIFIC, 2017 VS 2023 VS 2029
- Figure 41:
- BIOINSECTICIDES CONSUMPTION VALUE BY COUNTRY IN %, ASIA-PACIFIC, 2017 VS 2023 VS 2029
- Figure 42:
- BIOINSECTICIDES CONSUMPTION IN METRIC TON, AUSTRALIA, 2017 - 2029
- Figure 43:
- BIOINSECTICIDES CONSUMPTION IN USD, AUSTRALIA, 2017 - 2029
- Figure 44:
- BIOINSECTICIDES CONSUMPTION VALUE BY CROP TYPE IN %, AUSTRALIA, 2021 VS 2028
- Figure 45:
- BIOINSECTICIDES CONSUMPTION IN METRIC TON, CHINA, 2017 - 2029
- Figure 46:
- BIOINSECTICIDES CONSUMPTION IN USD, CHINA, 2017 - 2029
- Figure 47:
- BIOINSECTICIDES CONSUMPTION VALUE BY CROP TYPE IN %, CHINA, 2021 VS 2028
- Figure 48:
- BIOINSECTICIDES CONSUMPTION IN METRIC TON, INDIA, 2017 - 2029
- Figure 49:
- BIOINSECTICIDES CONSUMPTION IN USD, INDIA, 2017 - 2029
- Figure 50:
- BIOINSECTICIDES CONSUMPTION VALUE BY CROP TYPE IN %, INDIA, 2021 VS 2028
- Figure 51:
- BIOINSECTICIDES CONSUMPTION IN METRIC TON, INDONESIA, 2017 - 2029
- Figure 52:
- BIOINSECTICIDES CONSUMPTION IN USD, INDONESIA, 2017 - 2029
- Figure 53:
- BIOINSECTICIDES CONSUMPTION VALUE BY CROP TYPE IN %, INDONESIA, 2021 VS 2028
- Figure 54:
- BIOINSECTICIDES CONSUMPTION IN METRIC TON, JAPAN, 2017 - 2029
- Figure 55:
- BIOINSECTICIDES CONSUMPTION IN USD, JAPAN, 2017 - 2029
- Figure 56:
- BIOINSECTICIDES CONSUMPTION VALUE BY CROP TYPE IN %, JAPAN, 2021 VS 2028
- Figure 57:
- BIOINSECTICIDES CONSUMPTION IN METRIC TON, PHILIPPINES, 2017 - 2029
- Figure 58:
- BIOINSECTICIDES CONSUMPTION IN USD, PHILIPPINES, 2017 - 2029
- Figure 59:
- BIOINSECTICIDES CONSUMPTION VALUE BY CROP TYPE IN %, PHILIPPINES, 2021 VS 2028
- Figure 60:
- BIOINSECTICIDES CONSUMPTION IN METRIC TON, THAILAND, 2017 - 2029
- Figure 61:
- BIOINSECTICIDES CONSUMPTION IN USD, THAILAND, 2017 - 2029
- Figure 62:
- BIOINSECTICIDES CONSUMPTION VALUE BY CROP TYPE IN %, THAILAND, 2021 VS 2028
- Figure 63:
- BIOINSECTICIDES CONSUMPTION IN METRIC TON, VIETNAM, 2017 - 2029
- Figure 64:
- BIOINSECTICIDES CONSUMPTION IN USD, VIETNAM, 2017 - 2029
- Figure 65:
- BIOINSECTICIDES CONSUMPTION VALUE BY CROP TYPE IN %, VIETNAM, 2021 VS 2028
- Figure 66:
- BIOINSECTICIDES CONSUMPTION IN METRIC TON, REST OF ASIA-PACIFIC, 2017 - 2029
- Figure 67:
- BIOINSECTICIDES CONSUMPTION IN USD, REST OF ASIA-PACIFIC, 2017 - 2029
- Figure 68:
- BIOINSECTICIDES CONSUMPTION VALUE BY CROP TYPE IN %, REST OF ASIA-PACIFIC, 2021 VS 2028
- Figure 69:
- BIOINSECTICIDES CONSUMPTION IN METRIC TON, EUROPE, 2017 - 2029
- Figure 70:
- BIOINSECTICIDES CONSUMPTION IN USD, EUROPE, 2017 - 2029
- Figure 71:
- BIOINSECTICIDES CONSUMPTION VOLUME BY COUNTRY IN %, EUROPE, 2017 VS 2023 VS 2029
- Figure 72:
- BIOINSECTICIDES CONSUMPTION VALUE BY COUNTRY IN %, EUROPE, 2017 VS 2023 VS 2029
- Figure 73:
- BIOINSECTICIDES CONSUMPTION IN METRIC TON, FRANCE, 2017 - 2029
- Figure 74:
- BIOINSECTICIDES CONSUMPTION IN USD, FRANCE, 2017 - 2029
- Figure 75:
- BIOINSECTICIDES CONSUMPTION VALUE BY CROP TYPE IN %, FRANCE, 2021 VS 2028
- Figure 76:
- BIOINSECTICIDES CONSUMPTION IN METRIC TON, GERMANY, 2017 - 2029
- Figure 77:
- BIOINSECTICIDES CONSUMPTION IN USD, GERMANY, 2017 - 2029
- Figure 78:
- BIOINSECTICIDES CONSUMPTION VALUE BY CROP TYPE IN %, GERMANY, 2021 VS 2028
- Figure 79:
- BIOINSECTICIDES CONSUMPTION IN METRIC TON, ITALY, 2017 - 2029
- Figure 80:
- BIOINSECTICIDES CONSUMPTION IN USD, ITALY, 2017 - 2029
- Figure 81:
- BIOINSECTICIDES CONSUMPTION VALUE BY CROP TYPE IN %, ITALY, 2021 VS 2028
- Figure 82:
- BIOINSECTICIDES CONSUMPTION IN METRIC TON, NETHERLANDS, 2017 - 2029
- Figure 83:
- BIOINSECTICIDES CONSUMPTION IN USD, NETHERLANDS, 2017 - 2029
- Figure 84:
- BIOINSECTICIDES CONSUMPTION VALUE BY CROP TYPE IN %, NETHERLANDS, 2021 VS 2028
- Figure 85:
- BIOINSECTICIDES CONSUMPTION IN METRIC TON, RUSSIA, 2017 - 2029
- Figure 86:
- BIOINSECTICIDES CONSUMPTION IN USD, RUSSIA, 2017 - 2029
- Figure 87:
- BIOINSECTICIDES CONSUMPTION VALUE BY CROP TYPE IN %, RUSSIA, 2021 VS 2028
- Figure 88:
- BIOINSECTICIDES CONSUMPTION IN METRIC TON, SPAIN, 2017 - 2029
- Figure 89:
- BIOINSECTICIDES CONSUMPTION IN USD, SPAIN, 2017 - 2029
- Figure 90:
- BIOINSECTICIDES CONSUMPTION VALUE BY CROP TYPE IN %, SPAIN, 2021 VS 2028
- Figure 91:
- BIOINSECTICIDES CONSUMPTION IN METRIC TON, TURKEY, 2017 - 2029
- Figure 92:
- BIOINSECTICIDES CONSUMPTION IN USD, TURKEY, 2017 - 2029
- Figure 93:
- BIOINSECTICIDES CONSUMPTION VALUE BY CROP TYPE IN %, TURKEY, 2021 VS 2028
- Figure 94:
- BIOINSECTICIDES CONSUMPTION IN METRIC TON, UNITED KINGDOM, 2017 - 2029
- Figure 95:
- BIOINSECTICIDES CONSUMPTION IN USD, UNITED KINGDOM, 2017 - 2029
- Figure 96:
- BIOINSECTICIDES CONSUMPTION VALUE BY CROP TYPE IN %, UNITED KINGDOM, 2021 VS 2028
- Figure 97:
- BIOINSECTICIDES CONSUMPTION IN METRIC TON, REST OF EUROPE, 2017 - 2029
- Figure 98:
- BIOINSECTICIDES CONSUMPTION IN USD, REST OF EUROPE, 2017 - 2029
- Figure 99:
- BIOINSECTICIDES CONSUMPTION VALUE BY CROP TYPE IN %, REST OF EUROPE, 2021 VS 2028
- Figure 100:
- BIOINSECTICIDES CONSUMPTION IN METRIC TON, MIDDLE EAST, 2017 - 2029
- Figure 101:
- BIOINSECTICIDES CONSUMPTION IN USD, MIDDLE EAST, 2017 - 2029
- Figure 102:
- BIOINSECTICIDES CONSUMPTION VOLUME BY COUNTRY IN %, MIDDLE EAST, 2017 VS 2023 VS 2029
- Figure 103:
- BIOINSECTICIDES CONSUMPTION VALUE BY COUNTRY IN %, MIDDLE EAST, 2017 VS 2023 VS 2029
- Figure 104:
- BIOINSECTICIDES CONSUMPTION IN METRIC TON, IRAN, 2017 - 2029
- Figure 105:
- BIOINSECTICIDES CONSUMPTION IN USD, IRAN, 2017 - 2029
- Figure 106:
- BIOINSECTICIDES CONSUMPTION VALUE BY CROP TYPE IN %, IRAN, 2021 VS 2028
- Figure 107:
- BIOINSECTICIDES CONSUMPTION IN METRIC TON, SAUDI ARABIA, 2017 - 2029
- Figure 108:
- BIOINSECTICIDES CONSUMPTION IN USD, SAUDI ARABIA, 2017 - 2029
- Figure 109:
- BIOINSECTICIDES CONSUMPTION VALUE BY CROP TYPE IN %, SAUDI ARABIA, 2021 VS 2028
- Figure 110:
- BIOINSECTICIDES CONSUMPTION IN METRIC TON, REST OF MIDDLE EAST, 2017 - 2029
- Figure 111:
- BIOINSECTICIDES CONSUMPTION IN USD, REST OF MIDDLE EAST, 2017 - 2029
- Figure 112:
- BIOINSECTICIDES CONSUMPTION VALUE BY CROP TYPE IN %, REST OF MIDDLE EAST, 2021 VS 2028
- Figure 113:
- BIOINSECTICIDES CONSUMPTION IN METRIC TON, NORTH AMERICA, 2017 - 2029
- Figure 114:
- BIOINSECTICIDES CONSUMPTION IN USD, NORTH AMERICA, 2017 - 2029
- Figure 115:
- BIOINSECTICIDES CONSUMPTION VOLUME BY COUNTRY IN %, NORTH AMERICA, 2017 VS 2023 VS 2029
- Figure 116:
- BIOINSECTICIDES CONSUMPTION VALUE BY COUNTRY IN %, NORTH AMERICA, 2017 VS 2023 VS 2029
- Figure 117:
- BIOINSECTICIDES CONSUMPTION IN METRIC TON, CANADA, 2017 - 2029
- Figure 118:
- BIOINSECTICIDES CONSUMPTION IN USD, CANADA, 2017 - 2029
- Figure 119:
- BIOINSECTICIDES CONSUMPTION VALUE BY CROP TYPE IN %, CANADA, 2021 VS 2028
- Figure 120:
- BIOINSECTICIDES CONSUMPTION IN METRIC TON, MEXICO, 2017 - 2029
- Figure 121:
- BIOINSECTICIDES CONSUMPTION IN USD, MEXICO, 2017 - 2029
- Figure 122:
- BIOINSECTICIDES CONSUMPTION VALUE BY CROP TYPE IN %, MEXICO, 2021 VS 2028
- Figure 123:
- BIOINSECTICIDES CONSUMPTION IN METRIC TON, UNITED STATES, 2017 - 2029
- Figure 124:
- BIOINSECTICIDES CONSUMPTION IN USD, UNITED STATES, 2017 - 2029
- Figure 125:
- BIOINSECTICIDES CONSUMPTION VALUE BY CROP TYPE IN %, UNITED STATES, 2021 VS 2028
- Figure 126:
- BIOINSECTICIDES CONSUMPTION IN METRIC TON, REST OF NORTH AMERICA, 2017 - 2029
- Figure 127:
- BIOINSECTICIDES CONSUMPTION IN USD, REST OF NORTH AMERICA, 2017 - 2029
- Figure 128:
- BIOINSECTICIDES CONSUMPTION VALUE BY CROP TYPE IN %, REST OF NORTH AMERICA, 2021 VS 2028
- Figure 129:
- BIOINSECTICIDES CONSUMPTION IN METRIC TON, SOUTH AMERICA, 2017 - 2029
- Figure 130:
- BIOINSECTICIDES CONSUMPTION IN USD, SOUTH AMERICA, 2017 - 2029
- Figure 131:
- BIOINSECTICIDES CONSUMPTION VOLUME BY COUNTRY IN %, SOUTH AMERICA, 2017 VS 2023 VS 2029
- Figure 132:
- BIOINSECTICIDES CONSUMPTION VALUE BY COUNTRY IN %, SOUTH AMERICA, 2017 VS 2023 VS 2029
- Figure 133:
- BIOINSECTICIDES CONSUMPTION IN METRIC TON, ARGENTINA, 2017 - 2029
- Figure 134:
- BIOINSECTICIDES CONSUMPTION IN USD, ARGENTINA, 2017 - 2029
- Figure 135:
- BIOINSECTICIDES CONSUMPTION VALUE BY CROP TYPE IN %, ARGENTINA, 2021 VS 2028
- Figure 136:
- BIOINSECTICIDES CONSUMPTION IN METRIC TON, BRAZIL, 2017 - 2029
- Figure 137:
- BIOINSECTICIDES CONSUMPTION IN USD, BRAZIL, 2017 - 2029
- Figure 138:
- BIOINSECTICIDES CONSUMPTION VALUE BY CROP TYPE IN %, BRAZIL, 2021 VS 2028
- Figure 139:
- BIOINSECTICIDES CONSUMPTION IN METRIC TON, REST OF SOUTH AMERICA, 2017 - 2029
- Figure 140:
- BIOINSECTICIDES CONSUMPTION IN USD, REST OF SOUTH AMERICA, 2017 - 2029
- Figure 141:
- BIOINSECTICIDES CONSUMPTION VALUE BY CROP TYPE IN %, REST OF SOUTH AMERICA, 2021 VS 2028
- Figure 142:
- GLOBAL BIOINSECTICIDES MARKET, MOST ACTIVE COMPANIES, BY NUMBER OF STRATEGIC MOVES, 2017-2022
- Figure 143:
- GLOBAL BIOINSECTICIDES MARKET, MOST ADOPTED STRATEGIES, 2017-2022
- Figure 144:
- GLOBAL BIOINSECTICIDES MARKET SHARE(%), BY MAJOR PLAYERS
Bioinsecticides Industry Segmentation
Cash Crops, Horticultural Crops, Row Crops are covered as segments by Crop Type. Africa, Asia-Pacific, Europe, Middle East, North America, South America are covered as segments by Region.| Crop Type | Cash Crops | |||
| Horticultural Crops | ||||
| Row Crops | ||||
| Region | Africa | By Country | Egypt | |
| Nigeria | ||||
| South Africa | ||||
| Rest of Africa | ||||
| Asia-Pacific | By Country | Australia | ||
| China | ||||
| India | ||||
| Indonesia | ||||
| Japan | ||||
| Philippines | ||||
| Thailand | ||||
| Vietnam | ||||
| Rest of Asia-Pacific | ||||
| Europe | By Country | France | ||
| Germany | ||||
| Italy | ||||
| Netherlands | ||||
| Russia | ||||
| Spain | ||||
| Turkey | ||||
| United Kingdom | ||||
| Rest of Europe | ||||
| Middle East | By Country | Iran | ||
| Saudi Arabia | ||||
| Rest of Middle East | ||||
| North America | By Country | Canada | ||
| Mexico | ||||
| United States | ||||
| Rest of North America | ||||
| South America | By Country | Argentina | ||
| Brazil | ||||
| Rest of South America | ||||
Need A Different Region or Segment?
Customize Now
Market Definition
- AVERAGE DOSAGE RATE - The average application rate is the average volume of bioinscticides applied per hectare of farmland in the respective region/country.
- CROP TYPE - Crop type includes Row crops (Cereals, Pulses, Oilseeds), Horticultural Crops (Fruits and vegetables) and Cash Crops (Plantation Crops, Fibre Crops and Other Industrial Crops)
- FUNCTION - The Crop Protection function of agirucultural biological include products that prevent or control various biotic and abiotic stress.
- TYPE - Bioinsecticides prevent or control various insect pests from causing crop damage and yield loss.
| Keyword | Definition |
|---|---|
| Cash Crops | Cash crops are non-consumable crops sold as a whole or part of the crop to manufacture end-products to make a profit. |
| Integrated Pest Management (IPM) | IPM is an environment-friendly and sustainable approach to control pests in various crops. It involves a combination of methods, including biological controls, cultural practices, and selective use of pesticides. |
| Bacterial biocontrol agents | Bacteria used to control pests and diseases in crops. They work by producing toxins harmful to the target pests or competing with them for nutrients and space in the growing environment. Some examples of commonly used bacterial biocontrol agents include Bacillus thuringiensis (Bt), Pseudomonas fluorescens, and Streptomyces spp. |
| Plant Protection Product (PPP) | A plant protection product is a formulation applied to crops to protect from pests, such as weeds, diseases, or insects. They contain one or more active substances with other co-formulants such as solvents, carriers, inert material, wetting agents or adjuvants formulated to give optimum product efficacy. |
| Pathogen | A pathogen is an organism causing disease to its host, with the severity of the disease symptoms. |
| Parasitoids | Parasitoids are insects that lay their eggs on or within the host insect, with their larvae feeding on the host insect. In agriculture, parasitoids can be used as a form of biological pest control, as they help to control pest damage to crops and decrease the need for chemical pesticides. |
| Entomopathogenic Nematodes (EPN) | Entomopathogenic nematodes are parasitic roundworms that infect and kill pests by releasing bacteria from their gut. Entomopathogenic nematodes are a form of biocontrol agents used in agriculture. |
| Vesicular-arbuscular mycorrhiza (VAM) | VAM fungi are mycorrhizal species of fungus. They live in the roots of different higher-order plants. They develop a symbiotic relationship with the plants in the roots of these plants. |
| Fungal biocontrol agents | Fungal biocontrol agents are the beneficial fungi that control plant pests and diseases. They are an alternative to chemical pesticides. They infect and kill the pests or compete with pathogenic fungi for nutrients and space. |
| Biofertilizers | Biofertilizers contain beneficial microorganisms that enhance soil fertility and promote plant growth. |
| Biopesticides | Biopesticides are natural/bio-based compounds used to manage agricultural pests using specific biological effects. |
| Predators | Predators in agriculture are the organisms that feed on pests and help control pest damage to the crops. Some common predator species used in agriculture include ladybugs, lacewings, and predatory mites. |
| Biocontrol agents | Biocontrol agents are living organisms used to control pests and diseases in agriculture. They are alternatives to chemical pesticides and are known for their lesser impact on the environment and human health. |
| Organic Fertilizers | Organic fertilizer is composed of animal or vegetable matter used alone or in combination with one or more non-synthetically derived elements or compounds used for soil fertility and plant growth. |
| Protein hydrolysates (PHs) | Protein hydrolysate-based biostimulants contain free amino acids, oligopeptides, and polypeptides produced by enzymatic or chemical hydrolysis of proteins, primarily from vegetal or animal sources. |
| Biostimulants/Plant Growth Regulators (PGR) | Biostimulants/Plant Growth Regulators (PGR) are substances derived from natural resources to enhance plant growth and health by stimulating plant processes (metabolism). |
| Soil Amendments | Soil Amendments are substances applied to soil that improve soil health, such as soil fertility and soil structure. |
| Seaweed Extract | Seaweed extracts are rich in micro and macronutrients, proteins, polysaccharides, polyphenols, phytohormones, and osmolytes. These substances boost seed germination and crop establishment, total plant growth and productivity. |
| Compounds related to biocontrol and/or promoting growth (CRBPG) | Compounds related to biocontrol or promoting growth (CRBPG) are the ability of a bacteria to produce compounds for phytopathogen biocontrol and plant growth promotion. |
| Symbiotic Nitrogen-Fixing Bacteria | Symbiotic nitrogen-fixing bacteria such as Rhizobium obtain food and shelter from the host, and in return, they help by providing fixed nitrogen to the plants. |
| Nitrogen Fixation | Nitrogen fixation is a chemical process in soil which converts molecular nitrogen into ammonia or related nitrogenous compounds. |
| ARS (Agricultural Research Service) | ARS is the U.S. Department of Agriculture's chief scientific in-house research agency. It aims to find solutions to agricultural problems faced by the farmers in the country. |
| Phytosanitary Regulations | Phytosanitary regulations imposed by the respective government bodies check or prohibit the importation and marketing of certain insects, plant species, or products of these plants to prevent the introduction or spread of new plant pests or pathogens. |
| Ectomycorrhizae (ECM) | Ectomycorrhiza (ECM) is a symbiotic interaction of fungi with the feeder roots of higher plants in which both the plant and the fungi benefit through the association for survival. |
Need More Details on Market Definition?
Ask a Question
Research Methodology
Mordor Intelligence follows a four-step methodology in all our reports.
- Step-1: Identify Key Variables: In order to build a robust forecasting methodology, the variables and factors identified in Step-1 are tested against available historical market numbers. Through an iterative process, the variables required for market forecast are set and the model is built on the basis of these variables.
- Step-2: Build a Market Model: Market-size estimations for the forecast years are in nominal terms. Inflation is not a part of the pricing, and the average selling price (ASP) is kept constant throughout the forecast period.
- Step-3: Validate and Finalize: In this important step, all market numbers, variables and analyst calls are validated through an extensive network of primary research experts from the market studied. The respondents are selected across levels and functions to generate a holistic picture of the market studied.
- Step-4: Research Outputs: Syndicated Reports, Custom Consulting Assignments, Databases & Subscription Platforms.

Get More Details On Research Methodology
Download PDF


