
Bioinformatics Market Size and Share
Market Overview
| Study Period | 2020 - 2031 |
|---|---|
| Market Size (2026) | USD 19.80 Billion |
| Market Size (2031) | USD 35.04 Billion |
| Growth Rate (2026 - 2031) | 12.10 % |
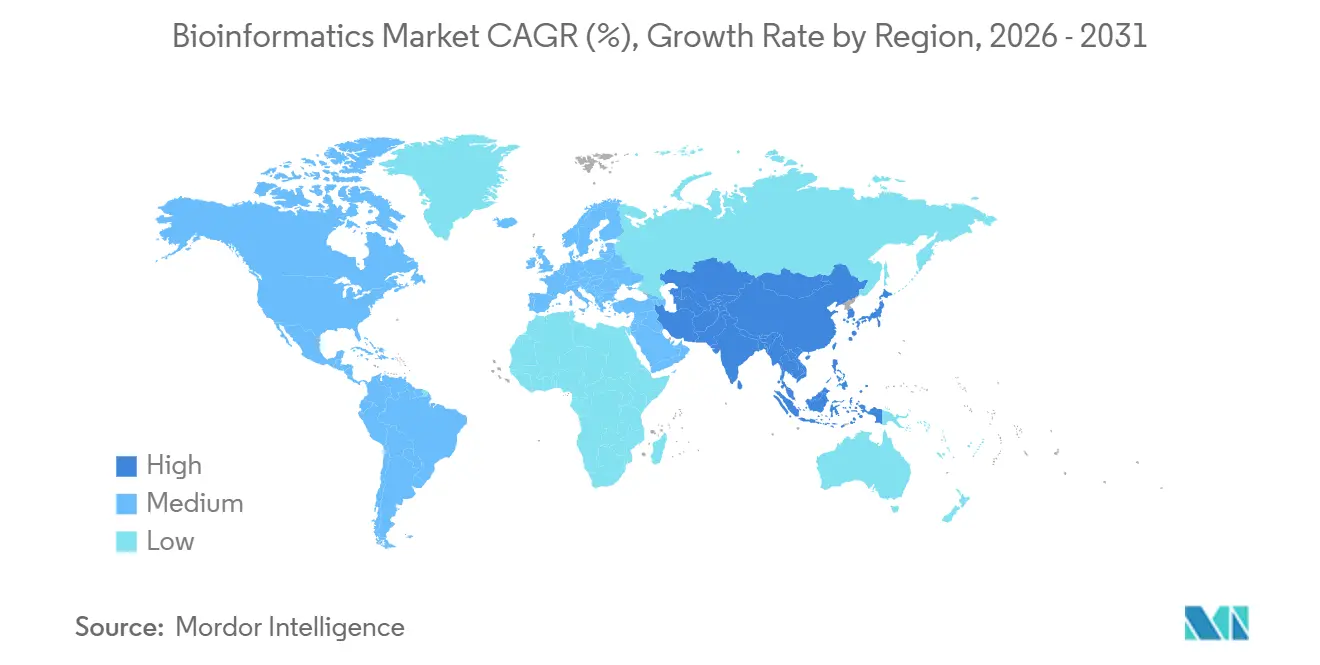
| Fastest Growing Market | Asia-Pacific |
| Largest Market | North America |
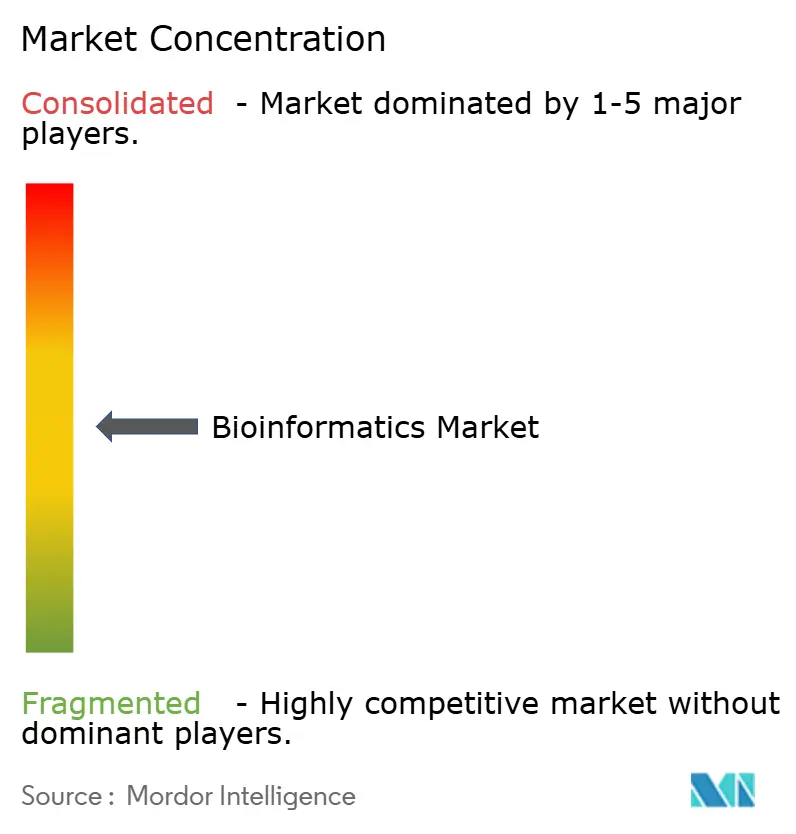
| Market Concentration | Medium |
Major Players *Disclaimer: Major Players sorted in no particular order Image © Mordor Intelligence. Reuse requires attribution under CC BY 4.0. | |
Bioinformatics Market Analysis by Mordor Intelligence
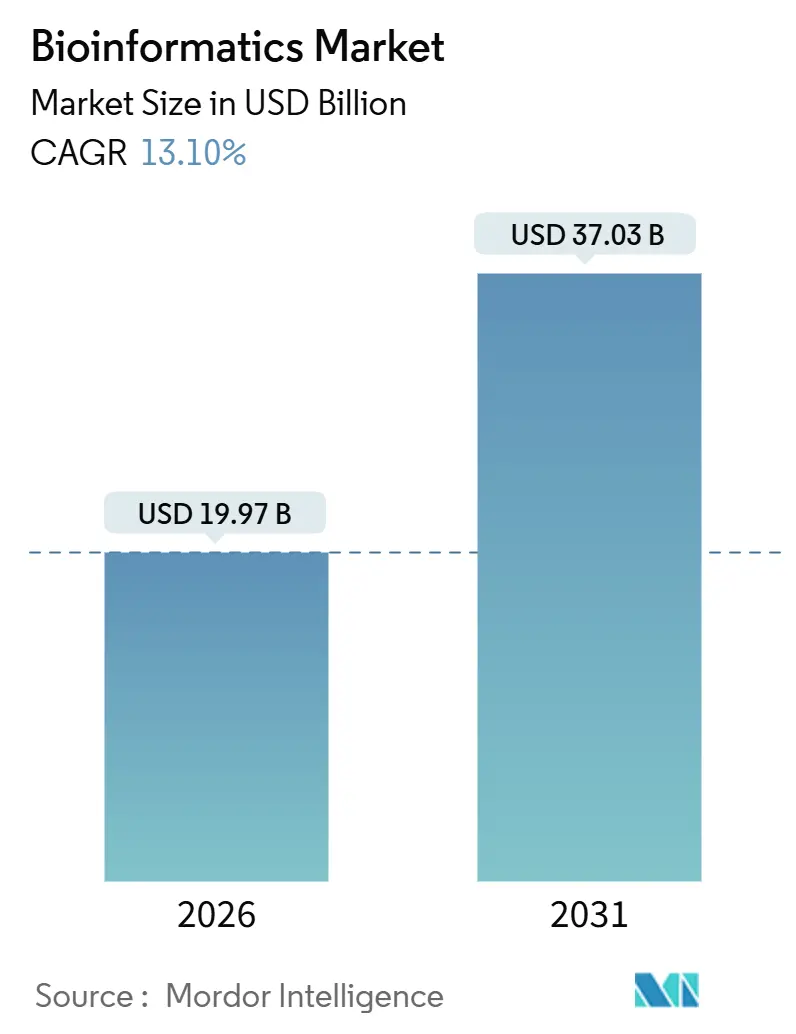
The Bioinformatics Market size is expected to grow from USD 17.66 billion in 2025 to USD 19.80 billion in 2026 and is forecast to reach USD 35.04 billion by 2031 at 12.10% CAGR over 2026-2031.
An expanding pipeline of multi-omics studies, rising regulatory pressure for precision diagnostics, and the pharmaceutical sector’s pivot toward data-centric R&D continue to reposition bioinformatics platforms from tactical tools to enterprise infrastructure. Cloud hyperscalers are embedding genomics-optimized services that shift capital expense to consumption-based models, while near-instrument analytics reduce latency and data-egress costs in clinical laboratories. Vendors that combine AI-native algorithms with elastic compute are capturing the largest share of new deployments, even as cybersecurity and workforce gaps temper near-term scalability. The resulting competitive landscape is defined by convergence: sequencing instrument makers, contract research organizations, and software start-ups now vie to own the same analytics stack.
Key Report Takeaways
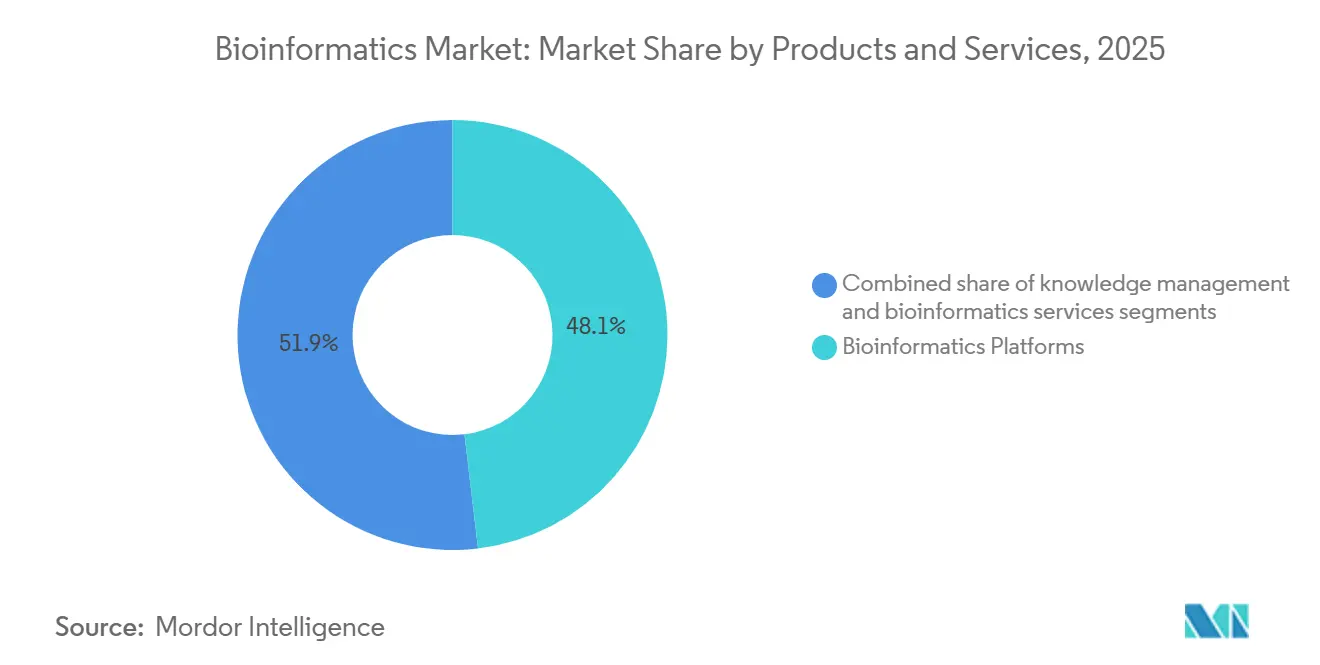
- By products and services, bioinformatics platforms led with 48.1% revenue share in 2025, whereas bioinformatics services are advancing at a 12.44% CAGR through 2031.
- By application, genomics and transcriptomics commanded a 34.6% share of the bioinformatics market size in 2025, while proteomics and metabolomics are forecast to expand at a 14.43% CAGR to 2031.
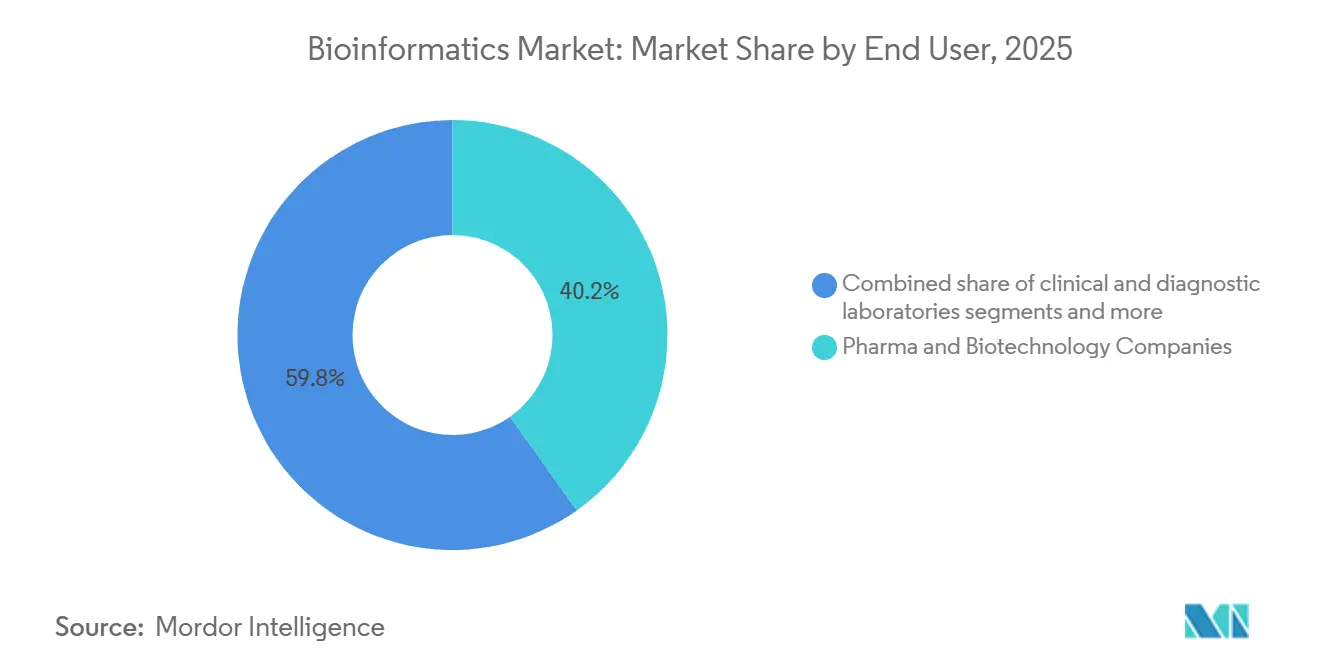
- By end-user, pharmaceutical and biotechnology companies accounted for 40.2% of the bioinformatics market share in 2025; contract research organizations are the fastest-growing segment at 14.98% CAGR to 2031.
- By geography, North America held a 39.4% share in 2025, yet Asia-Pacific is projected to register a 13.89% CAGR through 2031.
Note: Market size and forecast figures in this report are generated using Mordor Intelligence’s proprietary estimation framework, updated with the latest available data and insights as of January 2026.
Market Trends and Insights
Drivers Impact Analysis of Bioinformatics Market*
| Driver | (~) % Impact on CAGR Forecast | Geographic Relevance | Impact Timeline |
|---|---|---|---|
| Explosion of multi-omics data volumes | +2.8% | Global, peak in North America and China | Short term (≤ 2 years) |
| Precision medicine and companion diagnostics | +2.5% | North America, Europe, Japan | Medium term (2-4 years) |
| Pharma-biotech shift toward data-centric R&D | +2.2% | Global, led by North America and Europe | Medium term (2-4 years) |
| Government-funded genomic initiatives | +1.9% | North America, UK, China, India | Long term (≥ 4 years) |
| Edge or near-instrument processing | +1.6% | North America, Europe, core Asia-Pacific | Short term (≤ 2 years) |
| AI model marketplaces | +1.4% | Global, early adoption in North America | Medium term (2-4 years) |
| Source: Mordor Intelligence | |||
Explosion of Multi-Omics Data Volumes
Sequencing throughput has surpassed 20 petabases per instrument per year, yet storage and compute infrastructure trail demand, creating bottlenecks that bioinformatics platforms must resolve. The cost to sequence a human genome fell below USD 200 in 2024, but downstream analysis now costs three to five times that amount, driving investment in compression algorithms and federated learning that process data in situ. Pharmaceutical sponsors increasingly integrate genomic, transcriptomic, proteomic, and metabolomic datasets from identical patient cohorts, a workflow that depends on GPU clusters and object storage optimized for petabyte-scale workloads. Cloud providers such as AWS, Google Cloud, and Microsoft Azure are responding with managed pipelines that accelerate variant calling and annotation. Edge appliances embedded inside sequencers further minimize data-transfer fees by handling base-calling and primary analysis locally. Together, these dynamics sustain double-digit spending on elastic compute even as per-sample sequencing costs decline.
Precision Medicine and Companion Diagnostics Adoption
Regulatory approvals for companion diagnostics rose in 2025 as compared to 2024, owing to reinforcing the need for pipelines that detect complex genomic alterations with clinical-grade accuracy. Tumor-agnostic therapies targeting NTRK fusions and MSI-high signatures require panels interrogating more than 300 genes, shifting demand from single-gene assays toward comprehensive profiling. The European Medicines Agency finalized guidance in 2024 that obligates analytical validation across diverse ethnic cohorts, prompting expansion of reference datasets and ethnicity-aware algorithms. Japan added reimbursement codes for liquid biopsy monitoring in 2025, catalyzing the uptake of tools that track circulating tumor-DNA dynamics. Collectively, these policies anchor bioinformatics spending in oncology, yet spill into cardiology and rare disease as payers recognize the pharmacoeconomic value of stratified therapeutics.
Pharma-Biotech Shift Toward Data-Centric R&D
Pharmaceutical pipelines now lean on in-silico hypothesis generation to shorten wet-lab cycles. AlphaFold’s open release of 200 million protein structures demonstrated that years of crystallography can be compressed into hours of GPU time, accelerating structure-guided drug design. Antibody discovery particularly benefits as generative models trained on immune-repertoire data propose binders with predicted developability, trimming candidate pools significantly. Large sponsors, therefore, expand internal AI units while partnering with vendors that supply turnkey structure-prediction workflows. Contract research organizations scale similar capabilities across multiple clients, converting infrastructure into billable services and boosting adoption among cash-constrained biotech start-ups.
Government-Funded Genomic Initiatives
The NIH All of Us program released whole-genome sequences for 245,000 participants in 2025, creating the largest ethnically diverse cohort for precision-medicine research [1]. The UK Biobank added proteomic and metabolomic layers for 50,000 volunteers, producing integrated datasets that academic labs mine for cardiovascular biomarkers. China's National Genomics Data Center now stores more than 10 petabytes of sequencing data, enabling the construction of population-specific reference genomes that improve variant interpretation for Asian cohorts. India’s Genome India project finished sequencing 10,000 individuals, laying groundwork for dose-optimization studies that reduce adverse events linked to CYP2C19 and CYP2D6 alleles. These large-scale initiatives stimulate domestic cloud build-outs and fuel cross-border analytics partnerships.
Restraints Impact Analysis of Bioinformatics Market*
| Restraint | (~) % Impact on CAGR Forecast | Geographic Relevance | Impact Timeline |
|---|---|---|---|
| Shortage of skilled bioinformaticians | -1.8% | Global, acute in North America and Europe | Medium term (2-4 years) |
| Fragmented data standards | -1.4% | Global, disruptive in multi-site trials | Long term (≥ 4 years) |
| Cybersecurity and genomic-data privacy risks | -1.2% | Global, high regulatory pressure in the West | Short term (≤ 2 years) |
| Rising cloud egress and long-term storage fees | -1.0% | Global, acute for population-scale projects | Medium term (2-4 years) |
| Source: Mordor Intelligence | |||
Shortage of Skilled Bioinformaticians
Academic programs graduated roughly 8,500 computational biologists in 2025, versus industrial demand for more than 15,000 new hires, widening a talent gap that inflates salaries past USD 150,000 for mid-career professionals [2]. Companies launch in-house training to upskill molecular biologists in Python and R, while platform vendors embed no-code interfaces to widen usability. Offshore talent pools in India and Eastern Europe offer partial relief, though time-zone and data-sovereignty constraints restrict protected-health-information workflows.
Cybersecurity and Genomic-Data Privacy Risks
Ransomware attacks targeting genomic datasets rose significantly year over year in 2025, forcing laboratories to upgrade zero-trust architectures and comply with stricter HIPAA and GDPR enforcement. Insurance premiums for cyber coverage have surged, and some payers now mandate external penetration testing as a prerequisite for reimbursement of genomic assays. Encryption at rest and federated analysis mitigate exposure but add cost overhead that squeezes margins for smaller diagnostic centers.
*Our forecasts treat driver/restraint impacts as directional, not additive. The impact forecasts reflect baseline growth, mix effects, and variable interactions.
Bioinformatics Market Segment Analysis
By Products & Services:
Platforms Lead While Cloud Services AcceleratePlatforms accounted for 48.1% of the bioinformatics market in 2025, driven by tightly coupled sequence analysis workflows with Illumina and Oxford Nanopore instruments. Within this category, consumption-based cloud deployment is winning share as laboratories migrate away from depreciating on-premise clusters. Services grow at a 12.44% CAGR through 2031 by translating capital expenditure into variable operating expense and bundling compliance frameworks that satisfy CLIA and CE-IVDR requirements. Sequence analysis remains core, yet multi-omics integration and knowledge-management modules now bundle graph databases and text-mining engines that surface pathway insights faster than manual curation. Platform vendors that cannot deliver both cloud and edge codebases face consolidation pressure, as evidenced by recent mid-tier mergers.
Bioinformatics services capture expanding wallet share from small biotech and academic labs that lack internal computational teams. Hyperscalers amplify this trend by embedding genomics toolkits—AWS HealthOmics, Google Cloud Life Sciences API—into broader cloud offerings, often priced below cost to drive storage and compute consumption. As a result, the bioinformatics market size attributable to standalone software licenses is declining even though overall spend rises. Subscription and per-sample fees replace one-time hardware revenue, aligning vendor incentives with customer data volumes. Knowledge-management tools still monetize curation quality, yet open-access resources erode their pricing power, shifting emphasis toward proprietary algorithms that integrate with electronic lab notebooks and laboratory-information systems.

By Application:
Proteomics Emerges as Growth LeaderGenomics and transcriptomics held 34.6% share of the bioinformatics market size in 2025, anchored by national sequencing programs and oncology diagnostics. Proteomics and metabolomics, however, register 14.43% CAGR through 2031 on the back of mass-spectrometry advances that quantify more than 10,000 proteins per sample. Spatial techniques overlay molecular signals onto tissue architecture, driving demand for GPU-accelerated visualization. Drug discovery pipelines integrate structure-prediction algorithms with generative chemistry to trim preclinical timelines, while microbial genomics gains urgency as governments monitor antimicrobial resistance.
Precision-medicine use cases transition from research to clinic, with FDA-approved pharmacogenomic labels surpassing 400 in 2025. Agricultural and environmental genomics also rise as regulators evaluate CRISPR-edited crops for off-target effects. Single-cell sequencing marries imaging and omics, producing terabyte-scale datasets that necessitate real-time analytics and edge computing. Collectively, these emerging applications rebalance vendor portfolios and suppress reliance on single-omics revenues.
By End-User:
CROs Capitalize on Outsourcing WavePharmaceutical and biotechnology enterprises generated 40.2% of demand in 2025, deploying private clouds that integrate experimental data with regulatory submissions. Contract research organizations outpace other groups at 14.98% CAGR, leveraging shared infrastructure to amortize compute across sponsors and deliver turnkey analytic reports. Academic and research institutes remain influential but lose share as grant funding plateaus.
Clinical and diagnostic laboratories embed regulated pipelines that comply with CLIA and CAP checklists, a move that elevates demand for validated variant-interpretation engines. Agri-genomic and environmental testing firms, although niche, are growing swiftly as seed companies implement genomic selection. CRO acquisitions of platform providers, such as IQVIA’s 2024 purchase of a genomics division, illustrate vertical integration that captures more value per sample.
Geography Analysis
North America Bioinformatics Market
North America commanded 39.4% of the bioinformatics market in 2025, backed by a dense cluster of pharmaceutical headquarters, academic centers, and venture funding. FDA guidance published in 2024 tightened clinical validity standards for next-generation sequencing tests, extending development cycles yet raising overall data-analysis complexity. Canada’s precision-oncology networks deploy federated platforms that comply with provincial privacy acts, and Mexico’s biosimilar producers adopt bioinformatics tools for comparability protocols, diversifying regional demand.
APAC Bioinformatics Market
The Asia-Pacific region is forecast to expand at a 13.89% CAGR through 2031 as China’s state-sponsored genomics ecosystem scales sequencing capacity and vertically integrates analytics platform [3] India incubates start-ups that localize pipelines for South-Asian haplotypes, and Japan broadens reimbursement for 500-plus-gene panels, pushing hospital adoption of clinical-grade software. Australia and South Korea invest in national precision-medicine programs that couple cloud computing with sovereign data centers, ensuring compliance with domestic cybersecurity statutes.
EMEA and South America Bioinformatics Market
Europe’s In Vitro Diagnostic Regulation, enforceable from 2024, obliges software used in diagnostics to obtain CE-IVDR certification, increasing vendor compliance costs. Germany’s National Genome Center centralizes rare-disease workflows, while the United Kingdom integrates whole-genome sequencing into the National Health Service, mandating turnaround times of less than 14 days. South America’s market centers on Brazil’s pharmacogenomics pilots and Argentina’s crop genomics programs, whereas the Middle East and Africa remain nascent, with the United Arab Emirates and Saudi Arabia funding large-scale sequencing as part of their economic diversification agendas.
Regulatory Landscape
Bioinformatics used in regulated clinical workflows is increasingly treated as software that can inform diagnostic decision-making. In the United States, the FDA maintains oversight for next-generation sequencing tumor profiling tests under Product Code PZM (21 CFR 866.6080), where associated bioinformatics software and algorithms sit within a Class II regulatory context when used to support clinical decision support and reporting. In January 2026, the FDA updated Clinical Decision Support software guidance, clarifying which functions are excluded from the device definition under section 520(o)(1)(E) of the FD&C Act, which affects how vendors package analytics into clinical-facing applications.
On the data and interoperability side, the ONC Health IT Certification Program set USCDI Version 3 as the mandatory baseline for certified health IT from January 1, 2026, tightening expectations for standardized data elements that downstream bioinformatics and precision-medicine systems consume. ONC also advanced its Standards Version Advancement Process (SVAP) with the 2026 cycle, including HL7 FHIR US Core Implementation Guide STU 9.0.0 for voluntary incorporation beginning August 29, 2026, to support more consistent API-based data exchange into analytics environments. In the EU, Regulation (EU) 2025/327 (European Health Data Space, EHDS) entered into force on March 26, 2025, formalizing rules for electronic health data access and secondary use for research and personalized medicine; Commission Implementing Regulation (EU) 2026/771 (published April 7, 2026) established the EHDS Board to coordinate consistent application across Member States.
Value Chain Analysis
The bioinformatics value chain starts with upstream multi-omics data generation (sequencing and mass spectrometry) and moves through primary processing, analytics, interpretation, and delivery of outputs into research and clinical systems. Instrument vendors and assay providers increasingly bundle near-instrument or integrated analytics (including basecalling, alignment, variant calling, and QC), while cloud hyperscalers provide managed pipeline orchestration, elastic compute, and compliant environments that reduce the need for laboratories to maintain on-premise clusters. A recurring bottleneck sits between storage and compute, where I/O constraints and repeated decompression and formatting steps slow analysis at scale, which drives demand for optimized data formats, workflow engines, and architectures that reduce data movement.
Midstream participants include platform vendors, bioinformatics services providers, and CROs that standardize pipelines for multi-site trials and regulated reporting, with cybersecurity and privacy controls becoming integrated requirements rather than add-ons. Downstream, outputs are fed into knowledge management layers and clinical or enterprise systems, where interoperability standards, such as FHIR-aligned exchange in healthcare IT environments, influence how results are operationalized. Increasingly, federated data models keep sensitive genomic data in place while enabling cross-dataset query and analysis, reducing cross-border transfer friction and fitting with data-sovereignty constraints, including industry efforts to build global federated datasets for high-fidelity whole genomes. Publicly funded dataset infrastructure and access governance also shape throughput and reproducibility for academic and translational users, creating reliance on stable data stewardship and scalable compute access.
Competitive Landscape
The top five suppliers, Illumina, Thermo Fisher Scientific, QIAGEN, Agilent Technologies, and Roche, held a majority share in 2025, indicating moderate concentration. Illumina continues its vertical-integration play, coupling DRAGEN acceleration with instrument sales to generate USD 450 million in recurring software revenue. Thermo Fisher pursues horizontal expansion, acquiring point solutions and folding them into a cloud platform that spans sample prep to variant interpretation.
Disruptors include AI-first firms such as Insitro and Recursion, which commercialize proprietary analytics stacks originally built for internal drug discovery. NVIDIA’s BioNeMo toolkit enables pharmaceutical companies to train foundation models on local data, reducing reliance on third-party platforms. Standards bodies like GA4GH release open APIs that could commoditize routine alignment and variant calling, heightening price competition.
Bioinformatics Industry Leaders
-
Illumina Inc.
-
Thermo Fischer Scientific
-
Qiagen NV
-
Agilent Technologies
-
F. Hoffmann-La Roche Ltd.
- *Disclaimer: Major Players sorted in no particular order
Bioinformatics Market Companies Covered in this Report
- 3rd Millennium
- Agilent Technologies
- BGI Genomics Co. Ltd.
- Dassault Systèmes SE (BIOVIA)
- Data4Cure Inc.
- DNAnexus Inc.
- Eagle Genomics Ltd.
- Roche
- Gene42 Inc.
- Genedata
- Geneious (Biomatters)
- Illumina
- Ontoforce NV
- Oracle Corporation (Oracle Healthcare)
- Partek Inc.
- PerkinElmer
- QIAGEN
- Seven Bridges Genomics Inc.
- SoftGenetics LLC
- Thermo Fisher Scientific
- WuXi NextCODE Genomics
Market Opportunities and Future Outlook
A near-term opportunity lies in clinical expansion of multi-omics and oncology workflows that require validated, end-to-end analytics rather than stand-alone tools. Hospital systems and national health services are translating liquid biopsy and broad-panel sequencing into routine pathways, which raises demand for platforms that combine assay-specific pipelines, QC, variant interpretation, and auditable reporting. In 2026, SOPHiA GENETICS expanded clinical adoption signals, with Mount Sinai Health System adopting the SOPHiA DDM platform for oncology NGS, and with Synnovis partnering to support ctDNA liquid biopsy testing across NHS England (targeting around 7,000 annual tests). These deployments favor vendors that can operationalize regulated workflows across multiple sites while meeting privacy and security requirements.
Interoperability and compliant data access for secondary use also remains a focused opportunity area as health data regulations and certification baselines tighten the link between clinical data systems and bioinformatics stacks. In the EU, the EHDS framework provides a structured route for cross-organization data use in research and personalized medicine, increasing the value of platforms designed for consent, governance, and federated analysis. In the United States, ONC certification baselines (USCDI v3 from January 2026) and SVAP-driven FHIR advancements increase incentives to procure systems that can consume standardized clinical data and return traceable results, particularly where analytics need lifecycle controls and auditability. Vendors and service providers that deliver validated pipelines, data lineage, and privacy-preserving collaboration environments are positioned to capture spend as organizations consolidate fragmented workflows into enterprise infrastructure.
Recent Industry Developments in Bioinformatics Market
- June 2026: Thermo Fisher Scientific introduced new Orbitrap mass spectrometry platforms at ASMS 2026, including the Orbitrap Tribrid Apex. Higher-throughput proteomics increases downstream requirements for robust bioinformatics pipelines, accelerating demand for scalable analysis, visualization, and interpretation software in biopharma and translational research.
- May 2026: Illumina announced a whole-genome sequencing-based molecular residual disease (MRD) research solution in early access. WGS-based MRD pushes data volumes and analytical complexity beyond targeted panels, lifting the importance of optimized alignment, variant calling, and longitudinal analytics within integrated bioinformatics platforms.
- February 2025: QIAGEN acquired Bioinformatics Solutions Inc. (BSI) to strengthen its capabilities in proteomics and mass spectrometry data analysis. The deal broadened QIAGENs ability to deliver integrated multi-omics analytics and supported cross-selling into laboratories that run both sequencing and proteomics workflows.
Bioinformatics Market Report Scope and Research Methodology
Market Definition and Coverage
This market covers revenue generated from bioinformatics software, platforms, knowledge management tools, and paid analytical services used to store, process, visualize, and interpret biological data from areas like genomics, transcriptomics, proteomics, and metabolomics across major regions.
Scope exclusions: We exclude sequencing instruments and lab hardware, and we also exclude generic cloud compute or storage sold without a bioinformatics workflow layer.
Segments Covered in This Report
- By Products & Services
- Knowledge Management Tools
- Bioinformatics Platforms
- Sequence Analysis Platforms
- Sequence Alignment Platforms
- Sequence Manipulation Platforms
- Structural & Functional Analysis Platforms
- Multi-omics Integration Platforms
- Bioinformatics Services
- Sequencing & Data-Generation Services
- Database Construction & Management
- Data Analysis & Interpretation Services
- Cloud-native Bioinformatics-as-a-Service
- By Application
- Genomics & Transcriptomics
- Proteomics & Metabolomics
- Drug Discovery & Development
- Microbial Genomics (Metagenomics & AMR)
- Precision & Personalized Medicine
- Other Applications
- By End-user
- Pharmaceutical & Biotechnology Companies
- Academic & Research Institutes
- Clinical & Diagnostic Laboratories
- Contract Research Organizations (CROs)
- Other End-Users
- Geography
- North America
- United States
- Canada
- Mexico
- Europe
- Germany
- United Kingdom
- France
- Italy
- Spain
- Rest of Europe
- Asia-Pacific
- China
- Japan
- India
- South Korea
- Australia
- Rest of Asia-Pacific
- Middle East and Africa
- GCC
- South Africa
- Rest of Middle East and Africa
- South America
- Brazil
- Argentina
- Rest of South America
- North America
Data Sources, Market Sizing, and Validation
Desk Research
Desk research was used to map the demand pool and to build practical assumptions that can be repeated. We relied on public science and health sources such as NCBI (NIH), the National Human Genome Research Institute, OECD health and innovation indicators, World Bank macro series, and sources like the WHO for broader healthcare signals.
To connect science activity to spending, we also reviewed company annual reports, earnings decks, regulatory and funding announcements, peer reviewed articles, and association publications that discuss sequencing volumes, multi-omics adoption, and bioinformatics workloads. Where helpful, we used paid subscriptions limited to company financials and intelligence, news and financials, and patent databases to cross-check revenue exposure and technology direction. The desk sources listed here are not exhaustive, and we reviewed other public documents for data collection, validation, and clarification as needed.
Primary Interviews and Surveys
Primary work focused on confirming what is actually paid for in bioinformatics, and what is bundled into adjacent items like lab services or cloud spend. We spoke with a mix of solution providers, service teams, research leaders, and procurement roles across APAC, EMEA, and the Americas, so assumptions on pricing, adoption timing, and use-case mix could be corrected and then re-tested.
Distribution of primary research fieldwork respondents
| Company type | Respondent position | Region |
|---|---|---|
| Top tier: 27% | CXOs: 12% | APAC: 38% |
| Mid tier: 59% | Functional/Unit leaders: 43% | EMEA: 35% |
| Smaller Players: 14% | Managers: 45% | Americas: 27% |
Market-Sizing & Forecasting
Sizing starts with a top-down build where the addressable bioinformatics spend is reconstructed from multi-omics research and clinical activity, then filtered through adoption and monetization rates for platforms, tools, and paid services. Once that shape is set, we use selective bottom-up checks to make sure totals are not drifting, including sampled revenue splits from public filings, price-per-seat or subscription ranges from interviews, and volume x average price approximations for commonly purchased workflows.
Key inputs used in the model include sequencing and multi-omics throughput signals, share of projects using genomics and transcriptomics versus proteomics and metabolomics, the mix shift between on-premise and cloud deployed tools, typical license and subscription price progression, and end-user mix between biopharma, academic institutes, and other customer groups. When bottom-up data is missing for smaller geographies or niche applications, we filled gaps using proxy adoption ratios anchored to research funding and publication intensity, and those ratios were then stress-tested with experts.
For forecasting, scenario analysis was used with a multivariate regression layer where growth is linked to indicators like research funding direction, installed sequencing capacity trends, and software consumption patterns. Assumptions were finalized only after primary feedback converged on what a normal buying cycle and renewal behavior look like for end users by the end of the forecast period.
Data Validation & Update Cycle
Outputs were validated by triangulating against independent signals, such as regional research intensity, known multi-omics adoption timelines, and observed shifts in platform versus services spending. If a country or application result looked out of pattern, we re-checked the drivers and then ran a second-pass review to confirm the unit logic, currency handling, and year alignment.
Before sign-off, the full workbook is reviewed in steps so errors are caught early and assumptions stay consistent across regions and end users. The report is refreshed annually, and interim updates are made when material events change spending behavior or pricing. Prior to delivery, an analyst performs a fresh pass so clients receive the latest updated view.
Mordor Intelligence's Global Bioinformatics Market Estimate Compared With Other Published Estimates
Different published sizes for bioinformatics do not always match because the included items and the year being measured are not the same, and that changes the math even before forecasting begins. Variance also comes from how pricing is treated across software, platforms, and services, plus how fast adoption is assumed in fast-growth regions.
Sequencing instruments and lab hardware sit outside Mordor Intelligence's scope, which can make some broader life-science IT totals look higher when those adjacent revenues are counted together. Gaps also show up when a source uses a different base year, applies a more aggressive price expansion for software subscriptions, or converts currencies using a different timing, and we saw these effects clearly when reconciling the same regions and end-user mix.
Benchmark comparison
| Source | Market Size | Gaps in Research Methodology |
|---|---|---|
| Mordor Intelligence | USD 19.97 B (2026) | |
| Industry Publisher A | USD 18.69 B (2025) | Uses an earlier sizing year and a different base-year setup, which shifts the starting revenue pool and can understate the step-up from recent multi-omics adoption and pricing changes. |
| Global Consultancy B | USD 31.74 B (2025) | Reports a larger 2025 value that likely reflects broader inclusions and faster price escalation assumptions for software and services, which pushes totals up before regional adoption checks are applied. |
The spread in the table is mostly explained by what is counted as bioinformatics revenue, which year is used for the stated size, and how pricing growth is applied to software-led spending. By keeping inputs tied to observable activity signals and repeating the same year alignment and scope rules across regions, the final estimate stays practical to audit and consistent to update.
Key Questions Answered in the Report
How fast is the bioinformatics market expected to grow through 2031?
The bioinformatics market is projected to expand from USD 19.80 billion in 2026 to USD 35.04 billion by 2031, registering a 12.10% CAGR.
Which product category currently contributes the most revenue?
Bioinformatics platforms contributed 48.1% of total revenue in 2025, reflecting their central role in sequence analysis and multi-omics integration.
Why are contract research organizations gaining share?
CROs scale bioinformatics infrastructure across multiple sponsors, lowering per-project costs and achieving a projected 14.98% CAGR in demand through 2031.
Why is precision medicine important for Bioinformatics market growth?
Precision medicine depends on translating genomic data into clinical actions, and bioinformatics platforms provide the analytics that enable this translation.
Which region will see the fastest expansion by 2031?
Asia-Pacific is set to grow at a 13.89% CAGR, propelled by large-scale government genomics initiatives in China, India, and Japan.
How are vendors addressing data-security concerns?
Providers deploy zero-trust architectures, local edge processing, and federated analysis to comply with HIPAA and GDPR while reducing exposure to ransomware attacks.