| Study Period | 2017 - 2030 |
| Base Year For Estimation | 2024 |
| Forecast Data Period | 2025 - 2030 |
| Market Size (2025) | USD 3.18 Billion |
| Market Size (2030) | USD 5.34 Billion |
| CAGR (2025 - 2030) | 10.89 % |
| Market Concentration | Low |
Major Players*Disclaimer: Major Players sorted in no particular order |

Biofungicides Market Analysis
The Biofungicides Market size is estimated at 3.18 billion USD in 2025, and is expected to reach 5.34 billion USD by 2030, growing at a CAGR of 10.89% during the forecast period (2025-2030).
The biofungicides industry is experiencing a significant transformation driven by technological advancements in microbial research and formulation development. Leading companies are increasingly focusing on research and development to create more effective and stable biological solutions. This trend is exemplified by the strategic collaboration between Certis Biologicals and Novozymes in June 2022, aimed at developing new technologies for highly effective fungal disease control. The industry has also witnessed notable consolidation activities, as demonstrated by Corteva Agriscience's acquisition of the biologicals-based company Symborg in September 2022, highlighting the growing importance of biological fungicide solutions in the agricultural sector.
The advancement in microbial technologies has led to the development of more sophisticated biofungicide formulations. The industry primarily utilizes four key microorganisms: Bacillus, Trichoderma, Streptomyces, and Pseudomonas, which have proven highly effective against major plant pathogens including Pythium, Rhizoctonia, Fusarium, Sclerotinia, and Botrytis. These biological solutions are particularly gaining traction due to their multiple modes of action and ability to both control diseases and stimulate plant growth. The efficacy of these solutions has been further enhanced through improved formulation technologies and application methods.
Product innovation and regulatory approvals are driving market expansion across regions. A notable example is Seipasa's successful launch of its advanced bio-fungicidal product "Fungisei" in Portugal and France in 2022, following its registration by the European Commission. This trend of new product introductions is particularly significant in Brazil, where the number of registered biopesticides reached 433 in March 2022, representing a remarkable 404% increase over nine years. These developments indicate a growing acceptance of biological solutions in conventional agricultural practices.
The industry is witnessing a shift in farming practices with an increasing emphasis on integrated pest management strategies. Agricultural producers are adopting more sustainable approaches, incorporating biofungicides as part of their disease management programs. This transition is supported by advancements in application technologies and improved understanding of biological control mechanisms. Companies are investing in educational initiatives to help farmers optimize the use of these biological solutions, leading to better adoption rates and improved crop protection outcomes.
Global Biofungicides Market Trends
Organic production is at an all-time high in North America and Europe, due to the increasing awareness and Government initiatives.
- Organic agriculture has emerged as a significant contributor to sustainable food systems, with 187 countries practicing it globally. As of 2021, there was 72.3 million ha of organic agricultural land worldwide, with an average increase of 2.9% across all regions from 2018 to 2021. Organic arable land accounted for 14.4 million ha, representing 19.9% of the total organic agricultural land.
- The strongest markets for organic farming are North America and Europe, accounting for 41.0% of the global organic arable land. In 2022, Europe had 6.5 million ha of organic arable land, equivalent to 44.1% of the overall organic arable agricultural area. The most significant crops grown organically in North America and Europe are apples, strawberries, cereals, and olives.
- Developing countries in Asia-Pacific are also joining the organic agriculture movement and becoming self-sufficient in producing and providing fresh organic produce to meet their domestic demand. The trend of organic farming is gaining momentum in Asia-Pacific, with the region recording an 18.8% increase in organic arable land from 2017 to 2022. The major initiatives by governments in the region also play a vital role in the growing trend of organic farming. For example, Japan's Basic Plan for Food, Agriculture, and Rural Areas aims to triple the number of organic farmers and lands by 2030.
- The growth of organic agriculture is driven by the rising awareness of the benefits of organic farming, such as promoting soil health, reducing environmental impacts, and producing healthier food.

Understand The Key Trends Shaping This Market
Download PDF
Per capita spending of organic food majorly observed in United States and Germany, attributed to the consumer demand for healthier and sustainable food
- The organic food market experienced significant growth in the past few years, with global sales reaching USD 120.6 billion in 2020, up from USD 70.8 billion in 2012. The trend toward organic food is being driven by several factors, such as increasing consumer demand for healthier, more sustainable food options and a growing awareness of the environmental impact of conventional agriculture. The global organic food market is expected to continue its growth trend over the coming years.
- According to a survey conducted by the Organic Trade Association in 2021, sales of organic fruits and vegetables increased by around 4.5% in the same year, accounting for 15% of the overall organic sales. North America dominates the market in terms of average spending on organic products, with per capita spending in the United States reaching USD 186.7 in 2021, the highest among all North American countries. Europe is also expected to experience significant growth in the organic food market, with Germany accounting for the highest per capita spending of USD 75.6 in 2021.
- While the organic food market is still dominated by developed countries with high consumer disposable incomes, it is also expected to grow in developing nations. For example, the increasing number of working-class people in the Asia-Pacific region may contribute to the market's expansion due to the growing availability and affordability of organic food products.

Segment Analysis: Crop Type
Row Crops Segment in Biofungicides Market
The row crops segment maintains its dominant position in the global biofungicides market, accounting for approximately 64% of the total market value in 2024. This significant market share is primarily driven by major crops such as barley, corn, wheat, rapeseed, rye, sunflower, soybean, and rice. North America leads the consumption of biofungicides in row crops, with the United States being the primary contributor, accounting for over 71% of the total market value. The widespread adoption of biofungicides in row crops is attributed to the extensive cultivation area and an increasing shift toward organic farming practices, particularly in regions like Europe where government initiatives are actively promoting sustainable agricultural practices.
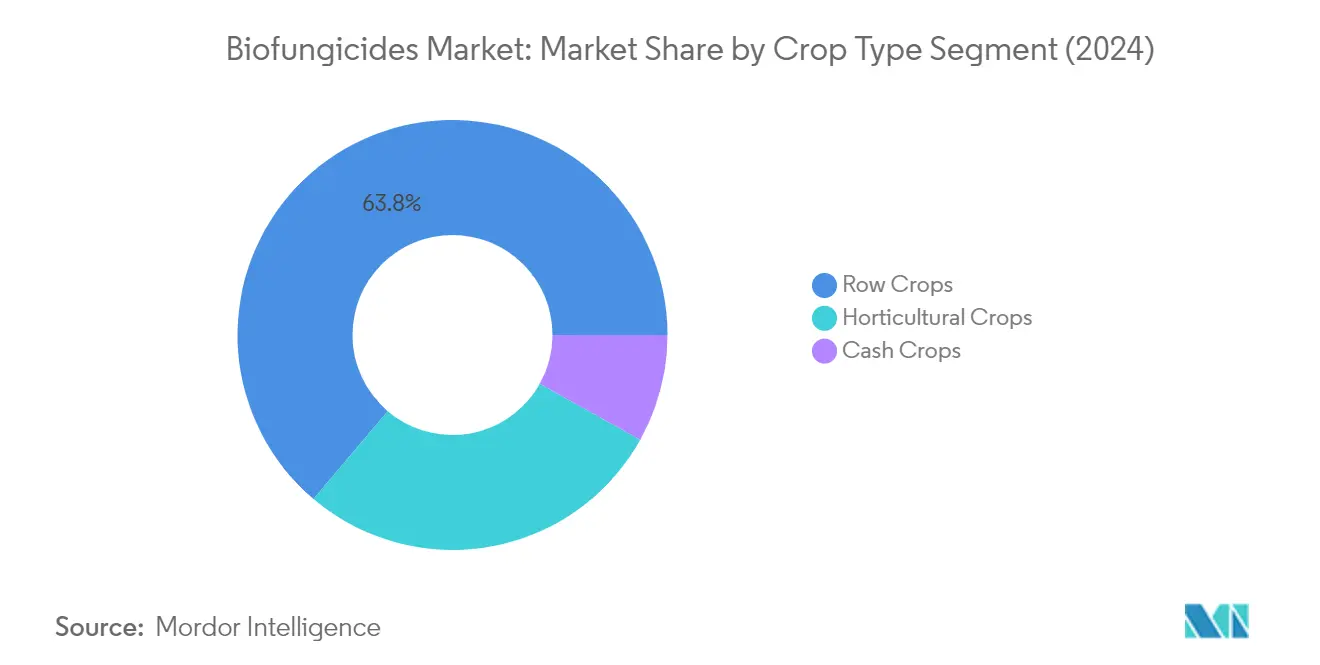
Horticultural Crops Segment in Biofungicides Market
The horticultural crops segment is emerging as the fastest-growing segment in the global biofungicides market, projected to expand at approximately 11% CAGR from 2024 to 2029. This robust growth is driven by the increasing adoption of protected cultivation practices in modern greenhouses, which is considered a highly sustainable food production system. The European region dominates this segment, with Italy, France, and Spain leading the market. The surge in demand for organically produced fruits and vegetables, including bananas, apples, grapes, tomatoes, onions, cucumbers, and cabbages, is significantly contributing to the segment's growth trajectory.
Remaining Segments in Crop Type
The cash crops segment, while smaller in market share, plays a vital role in the global biofungicides market. This segment primarily includes crops such as coffee, tea, cocoa, cotton, tobacco, rubber, and sugarcane. The adoption of biofungicides in cash crops is particularly strong in North America and the Asia-Pacific region, with growing awareness among farmers about sustainable farming practices. The segment's growth is supported by increasing organic certification programs and government initiatives promoting environmentally friendly agricultural practices in major cash crop-producing regions.
Biofungicides Market Geography Segment Analysis
Biofungicides Market in North America
North America represents a dominant force in the global biofungicides market, driven by the increasing adoption of sustainable agricultural practices and stringent regulations on chemical pesticide usage. The region's market is characterized by strong research and development activities, particularly in the United States, Canada, and Mexico. These countries have established robust infrastructure for biological fungicides and demonstrate a growing consumer preference for organically produced food products. The presence of major market players and advanced agricultural technologies further strengthens the region's position in the biofungicides landscape.
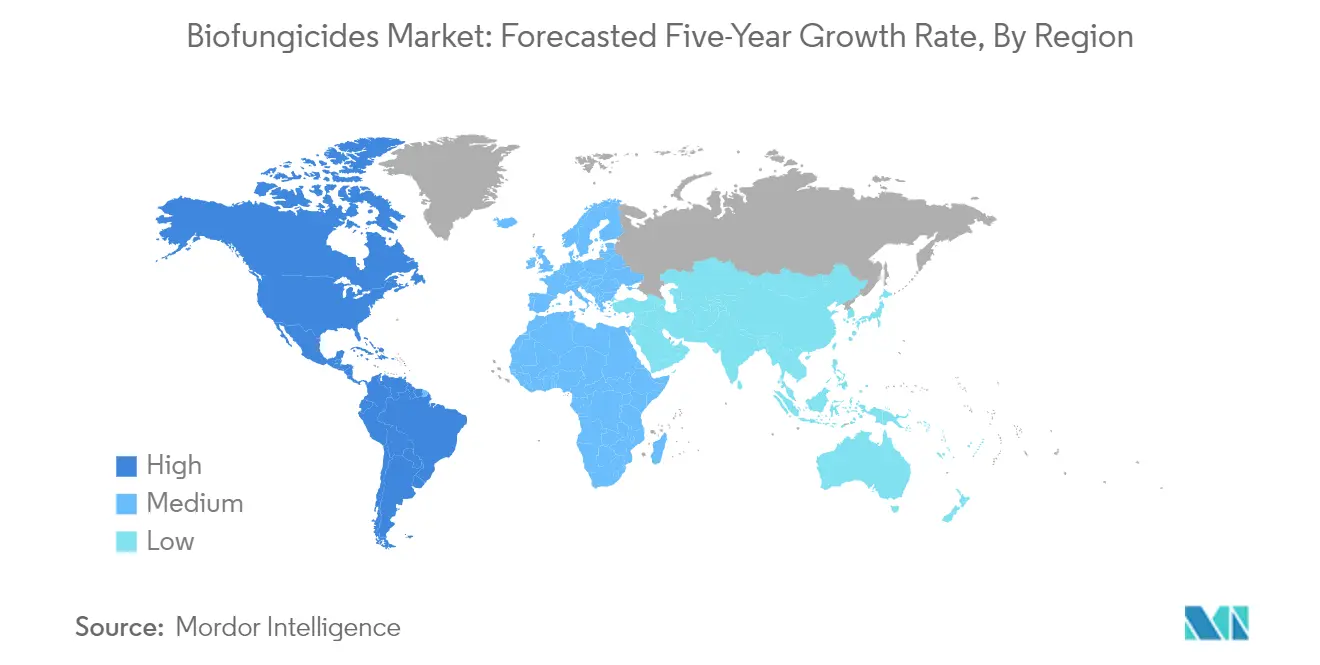
Biofungicides Market in the United States
The United States leads the North American biofungicides market, commanding approximately 37% of the regional market value in 2024. The country's dominance is attributed to its extensive agricultural land under organic cultivation and supportive government initiatives promoting sustainable farming practices. The US market benefits from advanced research facilities and strong distribution networks for biological crop protection products. The country's organic farming sector continues to expand, with an increasing number of farmers transitioning from conventional to organic farming methods. The USDA's ongoing support through various programs and certifications has created a favorable environment for biofungicides adoption across different crop segments.
Biofungicides Market in Mexico
Mexico emerges as the fastest-growing market for biofungicides in North America, with a projected growth rate of approximately 13% from 2024 to 2029. The country's rapid market expansion is driven by increasing awareness about sustainable farming practices and growing export opportunities for organic produce. Mexican farmers are increasingly adopting biofungicides as part of integrated pest management strategies, particularly in high-value crops. The country's agricultural sector benefits from favorable climate conditions and growing government support for organic farming initiatives. The rising demand for pesticide-free agricultural products in both domestic and international markets continues to drive the adoption of biofungicides among Mexican farmers.
Get Analysis on Important Geographic Markets
Download PDF
Biofungicides Industry Overview
Top Companies in Biofungicides Market
The global biofungicides market is characterized by companies actively pursuing product innovations and strategic partnerships to strengthen their market positions. Companies are investing significantly in research and development to create advanced biological fungicides solutions that offer improved efficacy and broader spectrum disease control. Strategic collaborations between agricultural biotechnology firms are becoming increasingly common to develop new technologies and expand product portfolios. Market leaders are focusing on geographical expansion through distribution agreements and establishing local manufacturing facilities in key agricultural regions. The emphasis on sustainable agriculture and organic farming has prompted companies to develop specialized formulations targeting specific crop diseases while maintaining environmental safety standards. Additionally, firms are investing in technical support teams to provide customized solutions and application guidance to farmers, enhancing their market presence through value-added services.
Fragmented Market with Regional Specialist Dominance
The biofungicides market exhibits a highly fragmented structure with a mix of global agrochemical conglomerates and specialized biological product manufacturers. Regional specialists have established strong footholds in their respective markets through a deep understanding of local agricultural practices and crop disease patterns. The market is characterized by the presence of numerous small and medium-sized enterprises focusing on niche applications and specific crop segments, alongside larger players with diverse product portfolios spanning multiple biopesticide categories.
Merger and acquisition activity in the sector remains moderate, with larger agrochemical companies primarily targeting innovative biotech firms to expand their biological product offerings. The industry is witnessing increasing partnerships between research institutions and commercial entities to accelerate product development and registration processes. Market consolidation is gradually increasing as established players seek to strengthen their positions through strategic acquisitions of regional players and technology-focused startups, though the overall market remains relatively unconsolidated compared to traditional agricultural input sectors.
Innovation and Distribution Network Drive Success
Success in the biofungicides market increasingly depends on companies' ability to develop innovative formulations that offer comparable efficacy to chemical alternatives while maintaining cost-effectiveness. Building strong distribution networks and establishing relationships with key agricultural stakeholders has become crucial for market penetration. Companies need to invest in educational initiatives to demonstrate product benefits and application methods to farmers, while also developing integrated pest management solutions that complement existing agricultural practices. The ability to obtain regulatory approvals across multiple jurisdictions and maintain quality consistency in biological production processes has emerged as a critical success factor.
For new entrants and smaller players, focusing on specialized market segments and developing products for specific crop-disease combinations offers a viable path to market entry. Success factors include establishing strong research and development capabilities, securing intellectual property rights, and building partnerships with established distribution networks. Companies must also consider potential regulatory changes regarding chemical pesticide usage and organic farming standards, which could significantly impact market dynamics. The development of resistance management strategies and integration with digital farming technologies are becoming increasingly important for long-term success in the market.
Biofungicides Market Leaders
-
Bioworks Inc.
-
Corteva Agriscience
-
Koppert Biological Systems Inc.
-
Marrone Bio Innovations Inc.
-
Seipasa SA
- *Disclaimer: Major Players sorted in no particular order

Need More Details on Market Players and Competitors?
Download PDF
Biofungicides Market News
- October 2022: Seipasa launched its new advanced bio fungicidal product, "Fungisei," in Portugal after getting registered Phytosaniritarily by the European Commission.
- September 2022: Corteva Agriscience signed an agreement to acquire a biologicals-based company Symborg as a part of its strategy to expand its biologicals portfolio. This move would help Corteva Agriscience achieve its goal of becoming a global leader in the agricultural biological market.
- June 2022: Certis Biologicals and Novozymes, two leading agricultural biotechnology companies, collaborated to develop new technologies for highly effective fungal disease control. This collaboration will provide new solutions to row crop growers.
Free With This Report
Along with the report, We also offer a comprehensive and exhaustive data pack on Areas under organic cultivation, one of the key trends that affect the market size of agricultural biologicals. This data pack also includes areas under cultivation by crop types, such as Row Crops (Cereals, Pulses, and Oilseeds), Horticultural Crops (Fruits and Vegetables), and Cash Crops in North America, Europe, Asia-Pacific, South America and Africa.


Biofungicides Market Report - Table of Contents
1. EXECUTIVE SUMMARY & KEY FINDINGS
2. REPORT OFFERS
3. INTRODUCTION
- 3.1 Study Assumptions & Market Definition
- 3.2 Scope of the Study
- 3.3 Research Methodology
4. KEY INDUSTRY TRENDS
- 4.1 Area Under Organic Cultivation
- 4.2 Per Capita Spending On Organic Products
-
4.3 Regulatory Framework
- 4.3.1 Argentina
- 4.3.2 Australia
- 4.3.3 Brazil
- 4.3.4 Canada
- 4.3.5 China
- 4.3.6 Egypt
- 4.3.7 France
- 4.3.8 Germany
- 4.3.9 India
- 4.3.10 Indonesia
- 4.3.11 Italy
- 4.3.12 Japan
- 4.3.13 Mexico
- 4.3.14 Netherlands
- 4.3.15 Nigeria
- 4.3.16 Philippines
- 4.3.17 Russia
- 4.3.18 South Africa
- 4.3.19 Spain
- 4.3.20 Thailand
- 4.3.21 Turkey
- 4.3.22 United Kingdom
- 4.3.23 United States
- 4.3.24 Vietnam
- 4.4 Value Chain & Distribution Channel Analysis
5. MARKET SEGMENTATION (includes market size in Value in USD and Volume, Forecasts up to 2030 and analysis of growth prospects)
-
5.1 Crop Type
- 5.1.1 Cash Crops
- 5.1.2 Horticultural Crops
- 5.1.3 Row Crops
-
5.2 Region
- 5.2.1 Africa
- 5.2.1.1 By Country
- 5.2.1.1.1 Egypt
- 5.2.1.1.2 Nigeria
- 5.2.1.1.3 South Africa
- 5.2.1.1.4 Rest of Africa
- 5.2.2 Asia-Pacific
- 5.2.2.1 By Country
- 5.2.2.1.1 Australia
- 5.2.2.1.2 China
- 5.2.2.1.3 India
- 5.2.2.1.4 Indonesia
- 5.2.2.1.5 Japan
- 5.2.2.1.6 Philippines
- 5.2.2.1.7 Thailand
- 5.2.2.1.8 Vietnam
- 5.2.2.1.9 Rest of Asia-Pacific
- 5.2.3 Europe
- 5.2.3.1 By Country
- 5.2.3.1.1 France
- 5.2.3.1.2 Germany
- 5.2.3.1.3 Italy
- 5.2.3.1.4 Netherlands
- 5.2.3.1.5 Russia
- 5.2.3.1.6 Spain
- 5.2.3.1.7 Turkey
- 5.2.3.1.8 United Kingdom
- 5.2.3.1.9 Rest of Europe
- 5.2.4 Middle East
- 5.2.4.1 By Country
- 5.2.4.1.1 Iran
- 5.2.4.1.2 Saudi Arabia
- 5.2.4.1.3 Rest of Middle East
- 5.2.5 North America
- 5.2.5.1 By Country
- 5.2.5.1.1 Canada
- 5.2.5.1.2 Mexico
- 5.2.5.1.3 United States
- 5.2.5.1.4 Rest of North America
- 5.2.6 South America
- 5.2.6.1 By Country
- 5.2.6.1.1 Argentina
- 5.2.6.1.2 Brazil
- 5.2.6.1.3 Rest of South America
6. COMPETITIVE LANDSCAPE
- 6.1 Key Strategic Moves
- 6.2 Market Share Analysis
- 6.3 Company Landscape
-
6.4 Company Profiles (includes Global Level Overview, Market Level Overview, Core Business Segments, Financials, Headcount, Key Information, Market Rank, Market Share, Products and Services, and Analysis of Recent Developments).
- 6.4.1 Andermatt Group AG
- 6.4.2 Biolchim SPA
- 6.4.3 Bioworks Inc.
- 6.4.4 Certis USA LLC
- 6.4.5 Corteva Agriscience
- 6.4.6 Indogulf BioAg LLC (Biotech Division of Indogulf Company)
- 6.4.7 Koppert Biological Systems Inc.
- 6.4.8 Lallemand Inc.
- 6.4.9 Marrone Bio Innovations Inc.
- 6.4.10 Seipasa SA
7. KEY STRATEGIC QUESTIONS FOR AGRICULTURAL BIOLOGICALS CEOS
8. APPENDIX
-
8.1 Global Overview
- 8.1.1 Overview
- 8.1.2 Porter’s Five Forces Framework
- 8.1.3 Global Value Chain Analysis
- 8.1.4 Market Dynamics (DROs)
- 8.2 Sources & References
- 8.3 List of Tables & Figures
- 8.4 Primary Insights
- 8.5 Data Pack
- 8.6 Glossary of Terms
You Can Purchase Parts Of This Report. Check Out Prices For Specific Sections
Get Price Break-up Now
List of Tables & Figures
- Figure 1:
- AREA UNDER ORGANIC CULTIVATION IN HECTARES, GLOBAL, 2017 - 2022
- Figure 2:
- PER CAPITA SPENDING ON ORGANIC PRODUCTS IN USD, GLOBAL, 2017 - 2022
- Figure 3:
- GLOBAL BIOFUNGICIDES MARKET, VOLUME, METRIC TON, 2017 - 2029
- Figure 4:
- GLOBAL BIOFUNGICIDES MARKET, VALUE, USD, 2017 - 2029
- Figure 5:
- BIOFUNGICIDES CONSUMPTION IN METRIC TON, GLOBAL, 2017 - 2029
- Figure 6:
- BIOFUNGICIDES CONSUMPTION IN USD, GLOBAL, 2017 - 2029
- Figure 7:
- BIOFUNGICIDES CONSUMPTION VOLUME BY CROP TYPE IN %, GLOBAL, 2017 VS 2023 VS 2029
- Figure 8:
- BIOFUNGICIDES CONSUMPTION VALUE BY CROP TYPE IN %, GLOBAL, 2017 VS 2023 VS 2029
- Figure 9:
- BIOFUNGICIDES CONSUMPTION BY CASH CROPS IN METRIC TON, GLOBAL, 2017 - 2029
- Figure 10:
- BIOFUNGICIDES CONSUMPTION BY CASH CROPS IN USD, GLOBAL, 2017 - 2029
- Figure 11:
- BIOFUNGICIDES CONSUMPTION VALUE BY REGION IN %, GLOBAL, 2021 VS 2028
- Figure 12:
- BIOFUNGICIDES CONSUMPTION BY HORTICULTURAL CROPS IN METRIC TON, GLOBAL, 2017 - 2029
- Figure 13:
- BIOFUNGICIDES CONSUMPTION BY HORTICULTURAL CROPS IN USD, GLOBAL, 2017 - 2029
- Figure 14:
- BIOFUNGICIDES CONSUMPTION VALUE BY REGION IN %, GLOBAL, 2021 VS 2028
- Figure 15:
- BIOFUNGICIDES CONSUMPTION BY ROW CROPS IN METRIC TON, GLOBAL, 2017 - 2029
- Figure 16:
- BIOFUNGICIDES CONSUMPTION BY ROW CROPS IN USD, GLOBAL, 2017 - 2029
- Figure 17:
- BIOFUNGICIDES CONSUMPTION VALUE BY REGION IN %, GLOBAL, 2021 VS 2028
- Figure 18:
- BIOFUNGICIDES CONSUMPTION IN METRIC TON, GLOBAL, 2017 - 2029
- Figure 19:
- BIOFUNGICIDES CONSUMPTION IN USD, GLOBAL, 2017 - 2029
- Figure 20:
- BIOFUNGICIDES CONSUMPTION VOLUME BY REGION IN %, GLOBAL, 2017 VS 2023 VS 2029
- Figure 21:
- BIOFUNGICIDES CONSUMPTION VALUE BY REGION IN %, GLOBAL, 2017 VS 2023 VS 2029
- Figure 22:
- BIOFUNGICIDES CONSUMPTION IN METRIC TON, AFRICA, 2017 - 2029
- Figure 23:
- BIOFUNGICIDES CONSUMPTION IN USD, AFRICA, 2017 - 2029
- Figure 24:
- BIOFUNGICIDES CONSUMPTION VOLUME BY COUNTRY IN %, AFRICA, 2017 VS 2023 VS 2029
- Figure 25:
- BIOFUNGICIDES CONSUMPTION VALUE BY COUNTRY IN %, AFRICA, 2017 VS 2023 VS 2029
- Figure 26:
- BIOFUNGICIDES CONSUMPTION IN METRIC TON, EGYPT, 2017 - 2029
- Figure 27:
- BIOFUNGICIDES CONSUMPTION IN USD, EGYPT, 2017 - 2029
- Figure 28:
- BIOFUNGICIDES CONSUMPTION VALUE BY CROP TYPE IN %, EGYPT, 2021 VS 2028
- Figure 29:
- BIOFUNGICIDES CONSUMPTION IN METRIC TON, NIGERIA, 2017 - 2029
- Figure 30:
- BIOFUNGICIDES CONSUMPTION IN USD, NIGERIA, 2017 - 2029
- Figure 31:
- BIOFUNGICIDES CONSUMPTION VALUE BY CROP TYPE IN %, NIGERIA, 2021 VS 2028
- Figure 32:
- BIOFUNGICIDES CONSUMPTION IN METRIC TON, SOUTH AFRICA, 2017 - 2029
- Figure 33:
- BIOFUNGICIDES CONSUMPTION IN USD, SOUTH AFRICA, 2017 - 2029
- Figure 34:
- BIOFUNGICIDES CONSUMPTION VALUE BY CROP TYPE IN %, SOUTH AFRICA, 2021 VS 2028
- Figure 35:
- BIOFUNGICIDES CONSUMPTION IN METRIC TON, REST OF AFRICA, 2017 - 2029
- Figure 36:
- BIOFUNGICIDES CONSUMPTION IN USD, REST OF AFRICA, 2017 - 2029
- Figure 37:
- BIOFUNGICIDES CONSUMPTION VALUE BY CROP TYPE IN %, REST OF AFRICA, 2021 VS 2028
- Figure 38:
- BIOFUNGICIDES CONSUMPTION IN METRIC TON, ASIA-PACIFIC, 2017 - 2029
- Figure 39:
- BIOFUNGICIDES CONSUMPTION IN USD, ASIA-PACIFIC, 2017 - 2029
- Figure 40:
- BIOFUNGICIDES CONSUMPTION VOLUME BY COUNTRY IN %, ASIA-PACIFIC, 2017 VS 2023 VS 2029
- Figure 41:
- BIOFUNGICIDES CONSUMPTION VALUE BY COUNTRY IN %, ASIA-PACIFIC, 2017 VS 2023 VS 2029
- Figure 42:
- BIOFUNGICIDES CONSUMPTION IN METRIC TON, AUSTRALIA, 2017 - 2029
- Figure 43:
- BIOFUNGICIDES CONSUMPTION IN USD, AUSTRALIA, 2017 - 2029
- Figure 44:
- BIOFUNGICIDES CONSUMPTION VALUE BY CROP TYPE IN %, AUSTRALIA, 2021 VS 2028
- Figure 45:
- BIOFUNGICIDES CONSUMPTION IN METRIC TON, CHINA, 2017 - 2029
- Figure 46:
- BIOFUNGICIDES CONSUMPTION IN USD, CHINA, 2017 - 2029
- Figure 47:
- BIOFUNGICIDES CONSUMPTION VALUE BY CROP TYPE IN %, CHINA, 2021 VS 2028
- Figure 48:
- BIOFUNGICIDES CONSUMPTION IN METRIC TON, INDIA, 2017 - 2029
- Figure 49:
- BIOFUNGICIDES CONSUMPTION IN USD, INDIA, 2017 - 2029
- Figure 50:
- BIOFUNGICIDES CONSUMPTION VALUE BY CROP TYPE IN %, INDIA, 2021 VS 2028
- Figure 51:
- BIOFUNGICIDES CONSUMPTION IN METRIC TON, INDONESIA, 2017 - 2029
- Figure 52:
- BIOFUNGICIDES CONSUMPTION IN USD, INDONESIA, 2017 - 2029
- Figure 53:
- BIOFUNGICIDES CONSUMPTION VALUE BY CROP TYPE IN %, INDONESIA, 2021 VS 2028
- Figure 54:
- BIOFUNGICIDES CONSUMPTION IN METRIC TON, JAPAN, 2017 - 2029
- Figure 55:
- BIOFUNGICIDES CONSUMPTION IN USD, JAPAN, 2017 - 2029
- Figure 56:
- BIOFUNGICIDES CONSUMPTION VALUE BY CROP TYPE IN %, JAPAN, 2021 VS 2028
- Figure 57:
- BIOFUNGICIDES CONSUMPTION IN METRIC TON, PHILIPPINES, 2017 - 2029
- Figure 58:
- BIOFUNGICIDES CONSUMPTION IN USD, PHILIPPINES, 2017 - 2029
- Figure 59:
- BIOFUNGICIDES CONSUMPTION VALUE BY CROP TYPE IN %, PHILIPPINES, 2021 VS 2028
- Figure 60:
- BIOFUNGICIDES CONSUMPTION IN METRIC TON, THAILAND, 2017 - 2029
- Figure 61:
- BIOFUNGICIDES CONSUMPTION IN USD, THAILAND, 2017 - 2029
- Figure 62:
- BIOFUNGICIDES CONSUMPTION VALUE BY CROP TYPE IN %, THAILAND, 2021 VS 2028
- Figure 63:
- BIOFUNGICIDES CONSUMPTION IN METRIC TON, VIETNAM, 2017 - 2029
- Figure 64:
- BIOFUNGICIDES CONSUMPTION IN USD, VIETNAM, 2017 - 2029
- Figure 65:
- BIOFUNGICIDES CONSUMPTION VALUE BY CROP TYPE IN %, VIETNAM, 2021 VS 2028
- Figure 66:
- BIOFUNGICIDES CONSUMPTION IN METRIC TON, REST OF ASIA-PACIFIC, 2017 - 2029
- Figure 67:
- BIOFUNGICIDES CONSUMPTION IN USD, REST OF ASIA-PACIFIC, 2017 - 2029
- Figure 68:
- BIOFUNGICIDES CONSUMPTION VALUE BY CROP TYPE IN %, REST OF ASIA-PACIFIC, 2021 VS 2028
- Figure 69:
- BIOFUNGICIDES CONSUMPTION IN METRIC TON, EUROPE, 2017 - 2029
- Figure 70:
- BIOFUNGICIDES CONSUMPTION IN USD, EUROPE, 2017 - 2029
- Figure 71:
- BIOFUNGICIDES CONSUMPTION VOLUME BY COUNTRY IN %, EUROPE, 2017 VS 2023 VS 2029
- Figure 72:
- BIOFUNGICIDES CONSUMPTION VALUE BY COUNTRY IN %, EUROPE, 2017 VS 2023 VS 2029
- Figure 73:
- BIOFUNGICIDES CONSUMPTION IN METRIC TON, FRANCE, 2017 - 2029
- Figure 74:
- BIOFUNGICIDES CONSUMPTION IN USD, FRANCE, 2017 - 2029
- Figure 75:
- BIOFUNGICIDES CONSUMPTION VALUE BY CROP TYPE IN %, FRANCE, 2021 VS 2028
- Figure 76:
- BIOFUNGICIDES CONSUMPTION IN METRIC TON, GERMANY, 2017 - 2029
- Figure 77:
- BIOFUNGICIDES CONSUMPTION IN USD, GERMANY, 2017 - 2029
- Figure 78:
- BIOFUNGICIDES CONSUMPTION VALUE BY CROP TYPE IN %, GERMANY, 2021 VS 2028
- Figure 79:
- BIOFUNGICIDES CONSUMPTION IN METRIC TON, ITALY, 2017 - 2029
- Figure 80:
- BIOFUNGICIDES CONSUMPTION IN USD, ITALY, 2017 - 2029
- Figure 81:
- BIOFUNGICIDES CONSUMPTION VALUE BY CROP TYPE IN %, ITALY, 2021 VS 2028
- Figure 82:
- BIOFUNGICIDES CONSUMPTION IN METRIC TON, NETHERLANDS, 2017 - 2029
- Figure 83:
- BIOFUNGICIDES CONSUMPTION IN USD, NETHERLANDS, 2017 - 2029
- Figure 84:
- BIOFUNGICIDES CONSUMPTION VALUE BY CROP TYPE IN %, NETHERLANDS, 2021 VS 2028
- Figure 85:
- BIOFUNGICIDES CONSUMPTION IN METRIC TON, RUSSIA, 2017 - 2029
- Figure 86:
- BIOFUNGICIDES CONSUMPTION IN USD, RUSSIA, 2017 - 2029
- Figure 87:
- BIOFUNGICIDES CONSUMPTION VALUE BY CROP TYPE IN %, RUSSIA, 2021 VS 2028
- Figure 88:
- BIOFUNGICIDES CONSUMPTION IN METRIC TON, SPAIN, 2017 - 2029
- Figure 89:
- BIOFUNGICIDES CONSUMPTION IN USD, SPAIN, 2017 - 2029
- Figure 90:
- BIOFUNGICIDES CONSUMPTION VALUE BY CROP TYPE IN %, SPAIN, 2021 VS 2028
- Figure 91:
- BIOFUNGICIDES CONSUMPTION IN METRIC TON, TURKEY, 2017 - 2029
- Figure 92:
- BIOFUNGICIDES CONSUMPTION IN USD, TURKEY, 2017 - 2029
- Figure 93:
- BIOFUNGICIDES CONSUMPTION VALUE BY CROP TYPE IN %, TURKEY, 2021 VS 2028
- Figure 94:
- BIOFUNGICIDES CONSUMPTION IN METRIC TON, UNITED KINGDOM, 2017 - 2029
- Figure 95:
- BIOFUNGICIDES CONSUMPTION IN USD, UNITED KINGDOM, 2017 - 2029
- Figure 96:
- BIOFUNGICIDES CONSUMPTION VALUE BY CROP TYPE IN %, UNITED KINGDOM, 2021 VS 2028
- Figure 97:
- BIOFUNGICIDES CONSUMPTION IN METRIC TON, REST OF EUROPE, 2017 - 2029
- Figure 98:
- BIOFUNGICIDES CONSUMPTION IN USD, REST OF EUROPE, 2017 - 2029
- Figure 99:
- BIOFUNGICIDES CONSUMPTION VALUE BY CROP TYPE IN %, REST OF EUROPE, 2021 VS 2028
- Figure 100:
- BIOFUNGICIDES CONSUMPTION IN METRIC TON, MIDDLE EAST, 2017 - 2029
- Figure 101:
- BIOFUNGICIDES CONSUMPTION IN USD, MIDDLE EAST, 2017 - 2029
- Figure 102:
- BIOFUNGICIDES CONSUMPTION VOLUME BY COUNTRY IN %, MIDDLE EAST, 2017 VS 2023 VS 2029
- Figure 103:
- BIOFUNGICIDES CONSUMPTION VALUE BY COUNTRY IN %, MIDDLE EAST, 2017 VS 2023 VS 2029
- Figure 104:
- BIOFUNGICIDES CONSUMPTION IN METRIC TON, IRAN, 2017 - 2029
- Figure 105:
- BIOFUNGICIDES CONSUMPTION IN USD, IRAN, 2017 - 2029
- Figure 106:
- BIOFUNGICIDES CONSUMPTION VALUE BY CROP TYPE IN %, IRAN, 2021 VS 2028
- Figure 107:
- BIOFUNGICIDES CONSUMPTION IN METRIC TON, SAUDI ARABIA, 2017 - 2029
- Figure 108:
- BIOFUNGICIDES CONSUMPTION IN USD, SAUDI ARABIA, 2017 - 2029
- Figure 109:
- BIOFUNGICIDES CONSUMPTION VALUE BY CROP TYPE IN %, SAUDI ARABIA, 2021 VS 2028
- Figure 110:
- BIOFUNGICIDES CONSUMPTION IN METRIC TON, REST OF MIDDLE EAST, 2017 - 2029
- Figure 111:
- BIOFUNGICIDES CONSUMPTION IN USD, REST OF MIDDLE EAST, 2017 - 2029
- Figure 112:
- BIOFUNGICIDES CONSUMPTION VALUE BY CROP TYPE IN %, REST OF MIDDLE EAST, 2021 VS 2028
- Figure 113:
- BIOFUNGICIDES CONSUMPTION IN METRIC TON, NORTH AMERICA, 2017 - 2029
- Figure 114:
- BIOFUNGICIDES CONSUMPTION IN USD, NORTH AMERICA, 2017 - 2029
- Figure 115:
- BIOFUNGICIDES CONSUMPTION VOLUME BY COUNTRY IN %, NORTH AMERICA, 2017 VS 2023 VS 2029
- Figure 116:
- BIOFUNGICIDES CONSUMPTION VALUE BY COUNTRY IN %, NORTH AMERICA, 2017 VS 2023 VS 2029
- Figure 117:
- BIOFUNGICIDES CONSUMPTION IN METRIC TON, CANADA, 2017 - 2029
- Figure 118:
- BIOFUNGICIDES CONSUMPTION IN USD, CANADA, 2017 - 2029
- Figure 119:
- BIOFUNGICIDES CONSUMPTION VALUE BY CROP TYPE IN %, CANADA, 2021 VS 2028
- Figure 120:
- BIOFUNGICIDES CONSUMPTION IN METRIC TON, MEXICO, 2017 - 2029
- Figure 121:
- BIOFUNGICIDES CONSUMPTION IN USD, MEXICO, 2017 - 2029
- Figure 122:
- BIOFUNGICIDES CONSUMPTION VALUE BY CROP TYPE IN %, MEXICO, 2021 VS 2028
- Figure 123:
- BIOFUNGICIDES CONSUMPTION IN METRIC TON, UNITED STATES, 2017 - 2029
- Figure 124:
- BIOFUNGICIDES CONSUMPTION IN USD, UNITED STATES, 2017 - 2029
- Figure 125:
- BIOFUNGICIDES CONSUMPTION VALUE BY CROP TYPE IN %, UNITED STATES, 2021 VS 2028
- Figure 126:
- BIOFUNGICIDES CONSUMPTION IN METRIC TON, REST OF NORTH AMERICA, 2017 - 2029
- Figure 127:
- BIOFUNGICIDES CONSUMPTION IN USD, REST OF NORTH AMERICA, 2017 - 2029
- Figure 128:
- BIOFUNGICIDES CONSUMPTION VALUE BY CROP TYPE IN %, REST OF NORTH AMERICA, 2021 VS 2028
- Figure 129:
- BIOFUNGICIDES CONSUMPTION IN METRIC TON, SOUTH AMERICA, 2017 - 2029
- Figure 130:
- BIOFUNGICIDES CONSUMPTION IN USD, SOUTH AMERICA, 2017 - 2029
- Figure 131:
- BIOFUNGICIDES CONSUMPTION VOLUME BY COUNTRY IN %, SOUTH AMERICA, 2017 VS 2023 VS 2029
- Figure 132:
- BIOFUNGICIDES CONSUMPTION VALUE BY COUNTRY IN %, SOUTH AMERICA, 2017 VS 2023 VS 2029
- Figure 133:
- BIOFUNGICIDES CONSUMPTION IN METRIC TON, ARGENTINA, 2017 - 2029
- Figure 134:
- BIOFUNGICIDES CONSUMPTION IN USD, ARGENTINA, 2017 - 2029
- Figure 135:
- BIOFUNGICIDES CONSUMPTION VALUE BY CROP TYPE IN %, ARGENTINA, 2021 VS 2028
- Figure 136:
- BIOFUNGICIDES CONSUMPTION IN METRIC TON, BRAZIL, 2017 - 2029
- Figure 137:
- BIOFUNGICIDES CONSUMPTION IN USD, BRAZIL, 2017 - 2029
- Figure 138:
- BIOFUNGICIDES CONSUMPTION VALUE BY CROP TYPE IN %, BRAZIL, 2021 VS 2028
- Figure 139:
- BIOFUNGICIDES CONSUMPTION IN METRIC TON, REST OF SOUTH AMERICA, 2017 - 2029
- Figure 140:
- BIOFUNGICIDES CONSUMPTION IN USD, REST OF SOUTH AMERICA, 2017 - 2029
- Figure 141:
- BIOFUNGICIDES CONSUMPTION VALUE BY CROP TYPE IN %, REST OF SOUTH AMERICA, 2021 VS 2028
- Figure 142:
- GLOBAL BIOFUNGICIDES MARKET, MOST ACTIVE COMPANIES, BY NUMBER OF STRATEGIC MOVES, 2017-2022
- Figure 143:
- GLOBAL BIOFUNGICIDES MARKET, MOST ADOPTED STRATEGIES, 2017-2022
- Figure 144:
- GLOBAL BIOFUNGICIDES MARKET SHARE(%), BY MAJOR PLAYERS
Biofungicides Industry Segmentation
Cash Crops, Horticultural Crops, Row Crops are covered as segments by Crop Type. Africa, Asia-Pacific, Europe, Middle East, North America, South America are covered as segments by Region.| Crop Type | Cash Crops | |||
| Horticultural Crops | ||||
| Row Crops | ||||
| Region | Africa | By Country | Egypt | |
| Nigeria | ||||
| South Africa | ||||
| Rest of Africa | ||||
| Asia-Pacific | By Country | Australia | ||
| China | ||||
| India | ||||
| Indonesia | ||||
| Japan | ||||
| Philippines | ||||
| Thailand | ||||
| Vietnam | ||||
| Rest of Asia-Pacific | ||||
| Europe | By Country | France | ||
| Germany | ||||
| Italy | ||||
| Netherlands | ||||
| Russia | ||||
| Spain | ||||
| Turkey | ||||
| United Kingdom | ||||
| Rest of Europe | ||||
| Middle East | By Country | Iran | ||
| Saudi Arabia | ||||
| Rest of Middle East | ||||
| North America | By Country | Canada | ||
| Mexico | ||||
| United States | ||||
| Rest of North America | ||||
| South America | By Country | Argentina | ||
| Brazil | ||||
| Rest of South America | ||||
Need A Different Region or Segment?
Customize Now
Market Definition
- AVERAGE DOSAGE RATE - The average application rate is the average volume of biofungicides applied per hectare of farmland in the respective region/country.
- CROP TYPE - Crop type includes Row crops (Cereals, Pulses, Oilseeds), Horticultural Crops (Fruits and vegetables) and Cash Crops (Plantation Crops, Fibre Crops and Other Industrial Crops)
- FUNCTION - The Crop Protection function of agirucultural biological include products that prevent or control various biotic and abiotic stress.
- TYPE - Biofungicides prevent or control disease-causing pests from causing crop damage and yield loss.
| Keyword | Definition |
|---|---|
| Cash Crops | Cash crops are non-consumable crops sold as a whole or part of the crop to manufacture end-products to make a profit. |
| Integrated Pest Management (IPM) | IPM is an environment-friendly and sustainable approach to control pests in various crops. It involves a combination of methods, including biological controls, cultural practices, and selective use of pesticides. |
| Bacterial biocontrol agents | Bacteria used to control pests and diseases in crops. They work by producing toxins harmful to the target pests or competing with them for nutrients and space in the growing environment. Some examples of commonly used bacterial biocontrol agents include Bacillus thuringiensis (Bt), Pseudomonas fluorescens, and Streptomyces spp. |
| Plant Protection Product (PPP) | A plant protection product is a formulation applied to crops to protect from pests, such as weeds, diseases, or insects. They contain one or more active substances with other co-formulants such as solvents, carriers, inert material, wetting agents or adjuvants formulated to give optimum product efficacy. |
| Pathogen | A pathogen is an organism causing disease to its host, with the severity of the disease symptoms. |
| Parasitoids | Parasitoids are insects that lay their eggs on or within the host insect, with their larvae feeding on the host insect. In agriculture, parasitoids can be used as a form of biological pest control, as they help to control pest damage to crops and decrease the need for chemical pesticides. |
| Entomopathogenic Nematodes (EPN) | Entomopathogenic nematodes are parasitic roundworms that infect and kill pests by releasing bacteria from their gut. Entomopathogenic nematodes are a form of biocontrol agents used in agriculture. |
| Vesicular-arbuscular mycorrhiza (VAM) | VAM fungi are mycorrhizal species of fungus. They live in the roots of different higher-order plants. They develop a symbiotic relationship with the plants in the roots of these plants. |
| Fungal biocontrol agents | Fungal biocontrol agents are the beneficial fungi that control plant pests and diseases. They are an alternative to chemical pesticides. They infect and kill the pests or compete with pathogenic fungi for nutrients and space. |
| Biofertilizers | Biofertilizers contain beneficial microorganisms that enhance soil fertility and promote plant growth. |
| Biopesticides | Biopesticides are natural/bio-based compounds used to manage agricultural pests using specific biological effects. |
| Predators | Predators in agriculture are the organisms that feed on pests and help control pest damage to the crops. Some common predator species used in agriculture include ladybugs, lacewings, and predatory mites. |
| Biocontrol agents | Biocontrol agents are living organisms used to control pests and diseases in agriculture. They are alternatives to chemical pesticides and are known for their lesser impact on the environment and human health. |
| Organic Fertilizers | Organic fertilizer is composed of animal or vegetable matter used alone or in combination with one or more non-synthetically derived elements or compounds used for soil fertility and plant growth. |
| Protein hydrolysates (PHs) | Protein hydrolysate-based biostimulants contain free amino acids, oligopeptides, and polypeptides produced by enzymatic or chemical hydrolysis of proteins, primarily from vegetal or animal sources. |
| Biostimulants/Plant Growth Regulators (PGR) | Biostimulants/Plant Growth Regulators (PGR) are substances derived from natural resources to enhance plant growth and health by stimulating plant processes (metabolism). |
| Soil Amendments | Soil Amendments are substances applied to soil that improve soil health, such as soil fertility and soil structure. |
| Seaweed Extract | Seaweed extracts are rich in micro and macronutrients, proteins, polysaccharides, polyphenols, phytohormones, and osmolytes. These substances boost seed germination and crop establishment, total plant growth and productivity. |
| Compounds related to biocontrol and/or promoting growth (CRBPG) | Compounds related to biocontrol or promoting growth (CRBPG) are the ability of a bacteria to produce compounds for phytopathogen biocontrol and plant growth promotion. |
| Symbiotic Nitrogen-Fixing Bacteria | Symbiotic nitrogen-fixing bacteria such as Rhizobium obtain food and shelter from the host, and in return, they help by providing fixed nitrogen to the plants. |
| Nitrogen Fixation | Nitrogen fixation is a chemical process in soil which converts molecular nitrogen into ammonia or related nitrogenous compounds. |
| ARS (Agricultural Research Service) | ARS is the U.S. Department of Agriculture's chief scientific in-house research agency. It aims to find solutions to agricultural problems faced by the farmers in the country. |
| Phytosanitary Regulations | Phytosanitary regulations imposed by the respective government bodies check or prohibit the importation and marketing of certain insects, plant species, or products of these plants to prevent the introduction or spread of new plant pests or pathogens. |
| Ectomycorrhizae (ECM) | Ectomycorrhiza (ECM) is a symbiotic interaction of fungi with the feeder roots of higher plants in which both the plant and the fungi benefit through the association for survival. |
Need More Details on Market Definition?
Ask a Question
Research Methodology
Mordor Intelligence follows a four-step methodology in all our reports.
- Step-1: Identify Key Variables: In order to build a robust forecasting methodology, the variables and factors identified in Step-1 are tested against available historical market numbers. Through an iterative process, the variables required for market forecast are set and the model is built on the basis of these variables.
- Step-2: Build a Market Model: Market-size estimations for the forecast years are in nominal terms. Inflation is not a part of the pricing, and the average selling price (ASP) is kept constant throughout the forecast period.
- Step-3: Validate and Finalize: In this important step, all market numbers, variables and analyst calls are validated through an extensive network of primary research experts from the market studied. The respondents are selected across levels and functions to generate a holistic picture of the market studied.
- Step-4: Research Outputs: Syndicated Reports, Custom Consulting Assignments, Databases & Subscription Platforms.

Get More Details On Research Methodology
Download PDF


