Market Overview
| Study Period | 2020 - 2030 |
|---|---|
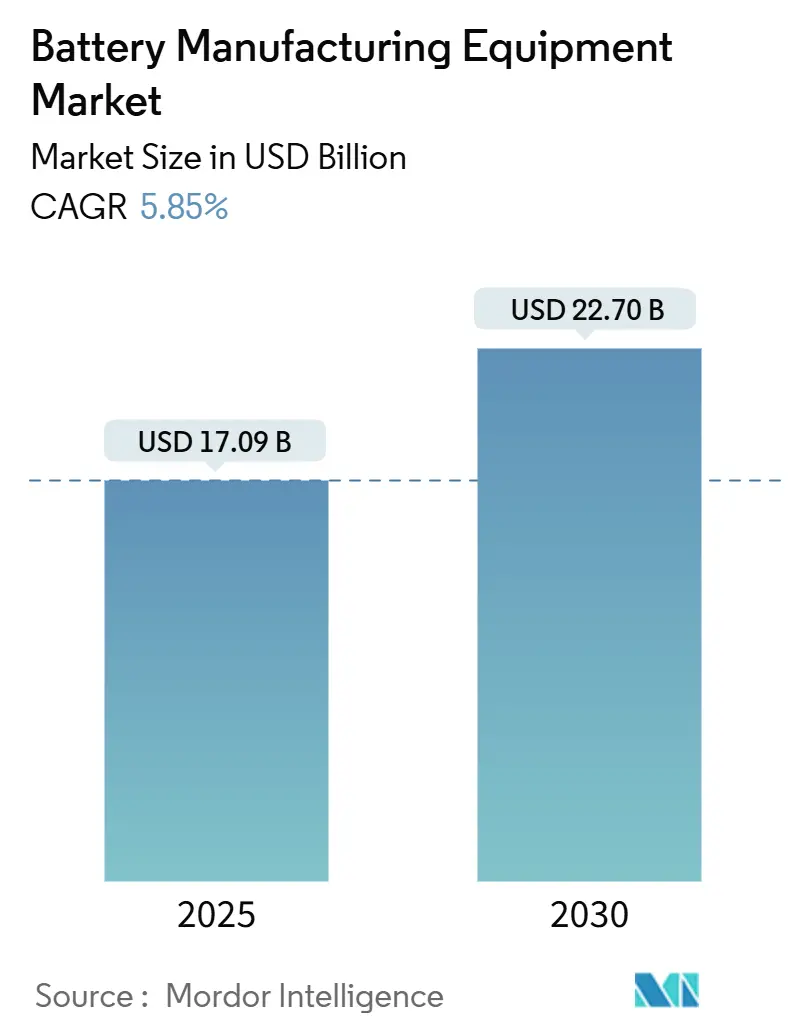
| Market Size (2025) | USD 17.09 Billion |
| Market Size (2030) | USD 22.70 Billion |
| Growth Rate (2025 - 2030) | 5.85% CAGR |
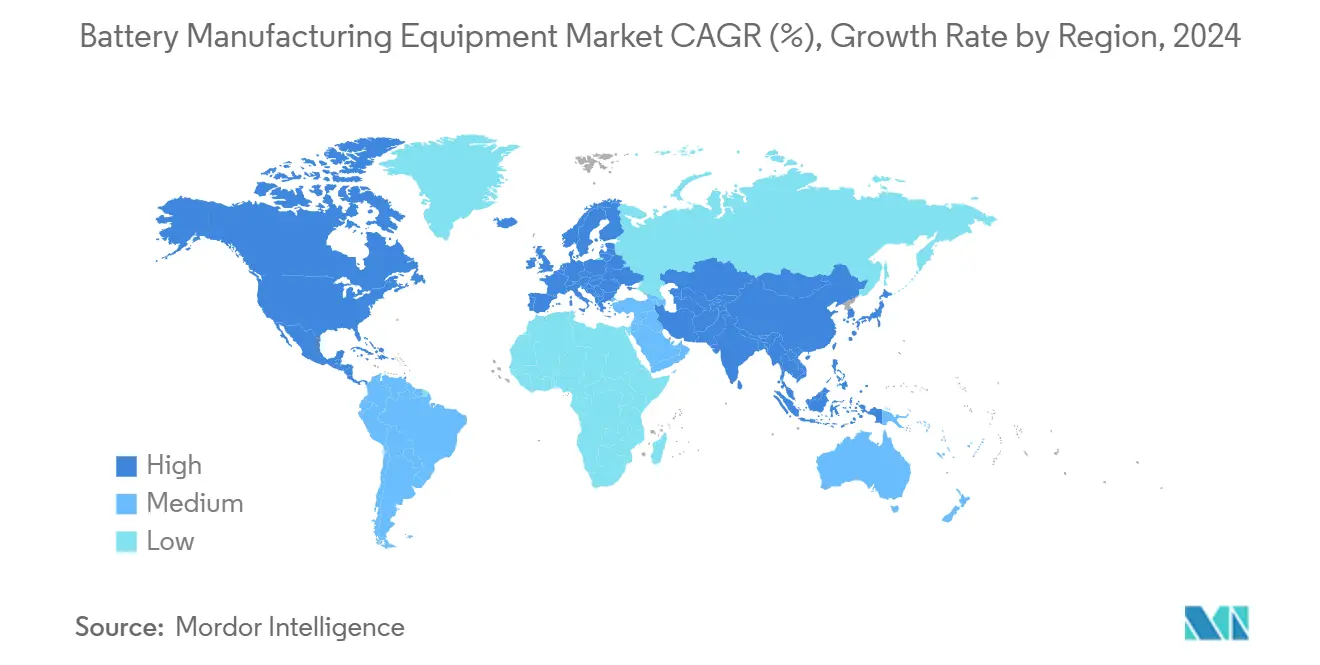
| Fastest Growing Market | North America |
| Largest Market | Asia-Pacific |
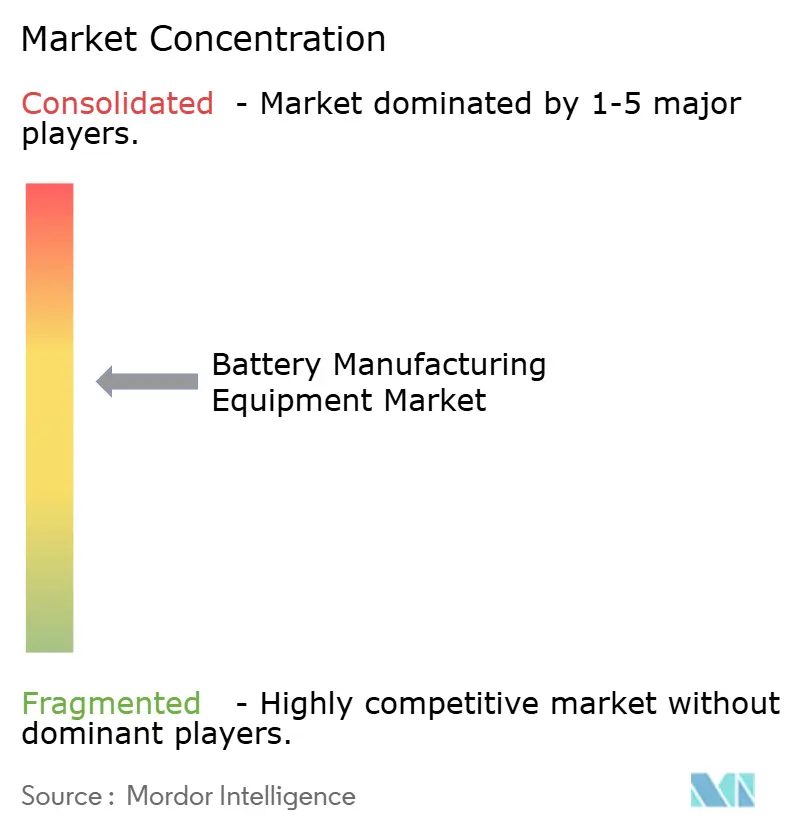
| Market Concentration | Medium |
Major Players
*Disclaimer: Major Players sorted in no particular order Image © Mordor Intelligence. Reuse requires attribution under CC BY 4.0. |
|
Battery Manufacturing Equipment Market Analysis by Mordor Intelligence
The Battery Manufacturing Equipment Market size is estimated at USD 17.09 billion in 2025, and is expected to reach USD 22.70 billion by 2030, at a CAGR of 5.85% during the forecast period (2025-2030).
This steady headline figure conceals a sharper strategic pivot as vehicle makers and grid-storage developers accelerate turnkey-line purchases ahead of a looming solid-state upgrade cycle, shortening equipment refresh intervals and favoring suppliers with modular platforms. Incentives embedded in the U.S. Inflation Reduction Act (IRA) and the European Net-Zero Industry Act are reshaping geographic demand, while surging raw-material volatility forces buyers to embed indexed clauses that shift risk downstream.[1]Wall Street Journal, “IRA Credits Reshape Battery Supply Chains,” wsj.com Formation and testing equipment, long a budgeting afterthought, emerges as a bottleneck, as cell makers realize that downstream cycle times negate upstream speed gains. Dry-electrode processes and AI-enabled inline inspection are cutting scrap and energy use, lifting overall equipment effectiveness (OEE), and widening the adoption gap between early movers and legacy solvent-based lines. Suppliers that bundle recycling modules with primary cell lines also gain an edge as new regulations require recycled-content compliance at a gigafactory scale.
Key Report Takeaways
- By battery chemistry, lithium-ion lines commanded 83.8% of 2024 revenue, and solid-state configurations are projected to grow at a 31.5% CAGR to 2030.
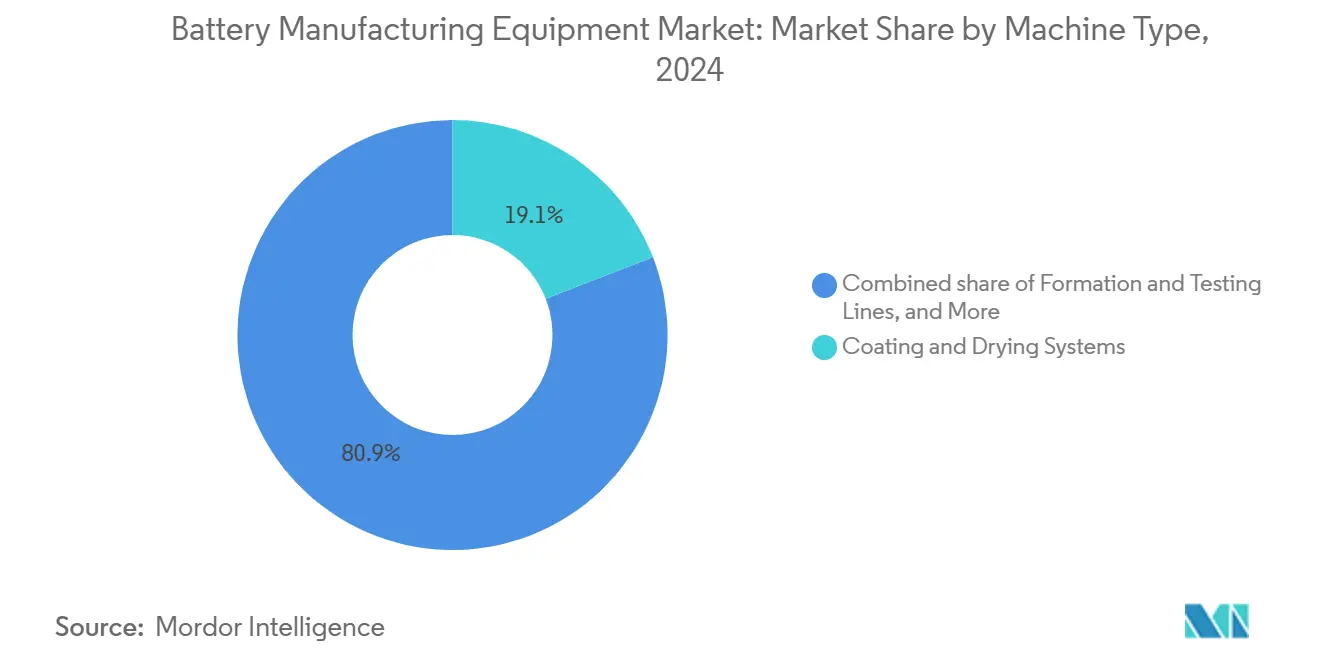
- By machine type, coating and drying systems held 19.1% of the Battery manufacturing equipment market share in 2024, and formation & testing lines are forecast to expand at a 12.8% CAGR through 2030.
- By automation level, fully automatic systems accounted for 60.5% of 2024 shipments, and AI-supervised “lights-out” lines are progressing at a 15.1% CAGR.
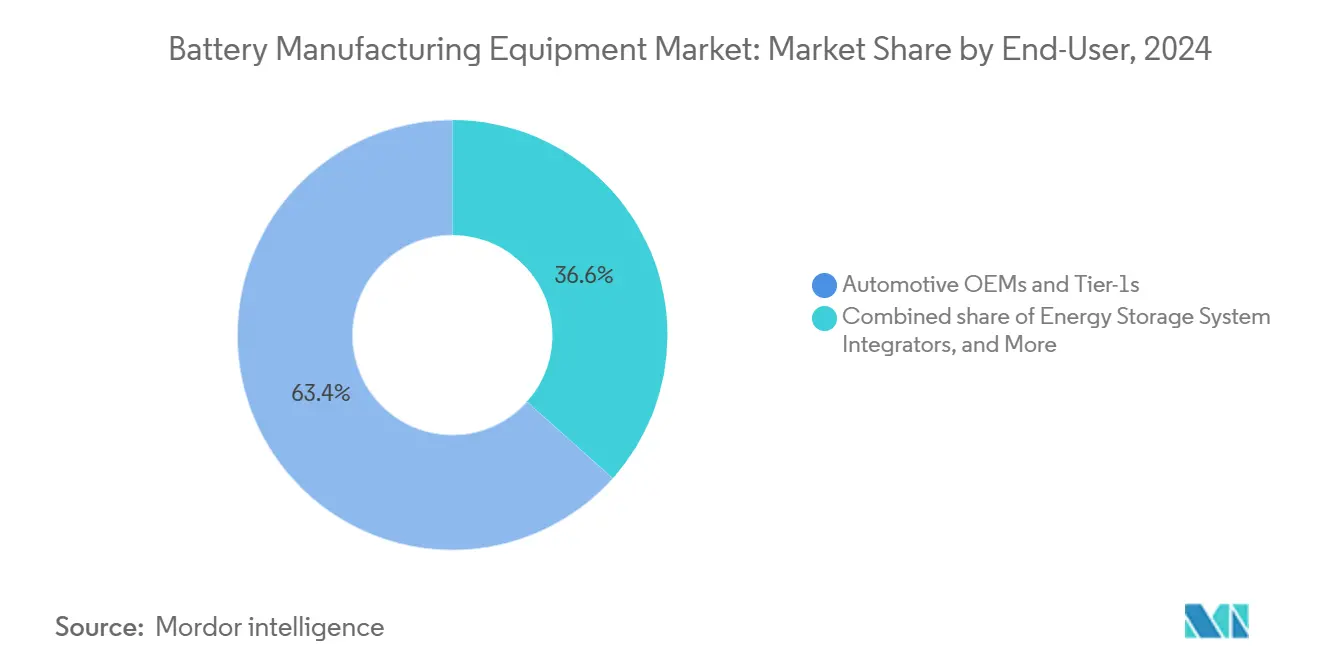
- By end user, automotive OEMs and tier-1s captured 63.4% of 2024 revenue, whereas energy-storage-system integrators are rising at a 14.7% CAGR through 2030.
- By geography, Asia-Pacific led with 55.2% revenue share of the Battery manufacturing equipment market in 2024, while North America is advancing at a 12.4% CAGR to 2030.
Global Battery Manufacturing Equipment Market Trends and Insights
Drivers Impact Analysis
| Driver | (~) % Impact on CAGR Forecast | Geographic Relevance | Impact Timeline |
|---|---|---|---|
| Surging EV production capacity expansion plans | 1.80% | Global, China, U.S., Europe | Medium term (2-4 years) |
| Government subsidies & IRA-driven on-shoring | 1.50% | North America, Europe | Short term (≤2 years) |
| Falling $/GWh gigafactory CAPEX | 0.90% | Global | Long term (≥4 years) |
| Grid-scale ESS build-out needing high-throughput lines | 1.20% | North America, Asia-Pacific | Medium term (2-4 years) |
| Dry-electrode & solvent-free coating adoption | 0.70% | North America, Europe, Japan | Long term (≥4 years) |
| AI-enabled inline inspection boosting OEE | 0.60% | Global | Medium term (2-4 years) |
| Source: Mordor Intelligence | |||
Surging EV Production Capacity Expansion Plans
Automakers announced 1.2 TWh of new lithium-ion capacity during 2024, triple the 2023 level, as companies bring cell production in-house to secure supply amid geopolitical risk.[2]Ford Motor Company, “2024 Form 10-K,” ford.com Ford’s USD 3.5 billion lithium-iron-phosphate plant in Michigan requires 35 GWh of coating, stacking, and formation equipment by 2026, pressuring vendors for quick delivery. General Motors’ Ultium Cells venture ordered 12 GWh of modular lines capable of both pouch and prismatic formats, signaling a preference for flexibility under future-chemistry uncertainty. Chinese majors CATL, BYD, and EVE Energy tendered 180 GWh of kit in 2024, yet 15-20% of contracts include clauses permitting deferral if lithium prices fall below USD 12,000 t, baking commodity risk into equipment deals. Volkswagen’s PowerCo set a 95% OEE target within six months of commissioning at its Valencia plant, filtering out suppliers lacking real-time process-control algorithms. Tesla’s USD 1.8 billion 4680 dry-electrode spend through mid-2024 shows that next-generation formats can double per-line capital needs even as they promise lower per-kWh cell costs.
Government Subsidies & IRA-Driven On-Shoring
The IRA’s Advanced Manufacturing Production Credit of USD 45 kWh for cells underpins North American gigafactory economics despite 40-60% labor premiums over Asia. Panasonic’s USD 4 billion Kansas project depends on these credits, while LG Energy Solution and SK On filed for USD 1.2 billion each and now demand U.S. content guarantees from Wuxi Lead and Manz. Europe’s Net-Zero Industry Act offers investment tax credits up to 40% of equipment outlay, but member states disbursed just EUR 2.1 billion of an earmarked EUR 8 billion by late 2024, delaying orders.[3]European Commission, “Battery Regulation Fact Sheet,” europa.eu Canada’s CAD 1.3 billion (USD 962 million) award to Stellantis-LGES and Volkswagen-PowerCo requires 60% regional content, prompting Dürr and Andritz to convert idle paint-shop assets into battery-equipment lines. Japan’s JPY 350 billion (USD 2.3 billion) 2024 subsidy tranche ring-fences solid-state pilot-line spend for domestic vacuum-deposition tools, protecting Hitachi High-Tech and Ulvac.
Grid-Scale ESS Build-Out Needing High-Throughput Lines
Four-hour and eight-hour stationary-storage projects require prismatic formats incompatible with legacy cylindrical tooling, pushing energy-storage-system integrators’ equipment demand to a 14.7% CAGR. Utilities favor high-throughput lines that cut cycle time and improve state-of-charge consistency across large cells. Fluence’s USD 280 million Texas joint venture will install 15 GWh of lithium-iron-phosphate prismatic capacity using bespoke stacking and welding modules. U.S. grid auctions specify U.S.-made content to capture IRA credits, tilting awards toward suppliers opening local assembly hubs. Asia-Pacific utilities follow, as South Korea and Japan move to secure domestic supply for renewable-firming mandates. The need for modules that handle thicker electrodes and wider form factors shifts capex allocations toward high-tonnage presses and oversized formation chambers, raising the average equipment spend per GWh.
Dry-Electrode & Solvent-Free Coating Adoption
Tesla’s dry-electrode process trims line length 35% and energy use 50 kWh m², while delivering 98.2% of wet-coating energy density and slashing capex to USD 58 million GWh, down 32%. CATL is retrofitting two Chinese lines with Wuxi Lead dry-coating modules that target a 40% cut in VOC emissions, anticipating China’s stricter 2025 air-quality rules. Fraunhofer research shows aqueous-binder cathodes reach 94% adhesion yet need longer calendaring dwell, boosting demand for presses with extended nip zones. QuantumScape’s separator-free architecture eliminates wet coating, compressing three legacy steps into a single vacuum-deposition pass and shrinking equipment footprint 60%. Pending EPA rules lowering NMP exposure to 10 ppm would impose USD 15 million in scrubbers per GWh line, accelerating solvent-free adoption.
Restraints Impact Analysis
| Restraint | (~) % Impact on CAGR Forecast | Geographic Relevance | Impact Timeline |
|---|---|---|---|
| High capex & long payback of turnkey lines | -1.1% | Global, acute in emerging markets and tier-2 suppliers | Short term (≤2 years) |
| Raw-material price volatility dampening orders | -0.9% | Global, with spillover effects in China, Europe, North America | Medium term (2-4 years) |
| Shortage of cell-assembly automation engineers | -0.7% | North America, Europe, ASEAN; less acute in China, South Korea | Medium term (2-4 years) |
| Tightening solvent-use rules (NMP, VOC) | -0.6% | Europe, North America, China (post-2025); limited impact in Southeast Asia | Long term (≥4 years) |
| Source: Mordor Intelligence | |||
High Capex & Long Payback of Turnkey Lines
A 10 GWh fully automated lithium-ion line needs USD 650-850 million, stretching payback to 7-9 years at prevailing cell prices of USD 90-110 kWh, which deters second-tier buyers lacking robust balance sheets. Northvolt’s November 2024 bankruptcy, tied to USD 5.8 billion in equipment debt, spooked lenders and tightened project-finance covenants. India’s Reliance New Energy postponed tooling orders after failing to secure a USD 2.5 billion loan, underlining how finance risk decouples machinery demand from EV sales trajectories. Manz saw Q3 2024 order intake slide 23% as customers phased purchases, buying coating kits now and deferring formation spend. The U.S. DOE approved just USD 1.1 billion of the USD 17 billion requested for battery projects in 2024, leaving suppliers with conditional orders that may never convert.[4]U.S. Department of Energy, “Bipartisan Infrastructure Law Battery Funding,” energy.gov Leasing models pioneered by Dürr and Bühler cut upfront cash by 60% but cap supplier ROIC below 10%, dampening long-term investment appetite.
Raw-Material Price Volatility Dampening Orders
Lithium carbonate’s plunge from USD 80,000 t in 2022 to USD 13,000 in August 2024 erased cell-maker margins and put USD 6.2 billion in equipment backlog at cancellation risk. CATL deferred 15 GWh of Sichuan expansion, while LGES invoked force-majeure clauses on USD 340 million of formation tools following a customer’s 18% EV-output cut. Benchmark Mineral Intelligence counts 22 GWh of Western capacity on hold in 2024, equal to USD 1.8 billion of lost equipment revenue. Nickel sulfate’s USD 12,800-22,400 t swings deter buyers from ordering high-nickel cathode lines that cannot be repurposed for LFP chemistries. Suppliers now write commodity-indexed pricing into contracts, improving margin visibility but shortening order pipelines, as Sovema’s EUR 47 million tooling write-down shows.[5]Sovema Group, “2024 Annual Report,” sovema-group.com
Segment Analysis
Lithium-ion accounted for 83.8% of 2024 revenue, underscoring its entrenched role in EVs and consumer devices. Solid-state lines, however, are projected to surge at 31.5% CAGR, driving a parallel ecosystem of vacuum-deposition coaters and inert-atmosphere stackers that cost almost triple per GWh. Toyota indicated that the sulfide-electrolyte kit requires 2.8× the capital of lithium-ion equivalents. Solid Power’s USD 62 million pilot order with Bühler highlights early demand for sub-5 ppm moisture environments. Sodium-ion remains niche but offers format flexibility that may lift adoption in stationary storage once performance stabilizes. Legacy lead-acid and nickel systems are expected to erode at -2.3% CAGR, though price-sensitive markets still value their recyclability.
The rising premium of solid-state tooling enlarges the Battery manufacturing equipment market size for niche high-energy systems and shifts supplier focus toward Japanese vacuum specialists. These high-margin modules, bundled with sulfide-handling options, offset slower growth in mature lithium-ion lines. The competitive set expands as startups co-develop equipment directly with cell innovators, shortening design cycles. Meanwhile, regulatory recycled-content mandates spur early investment in recycling modules that can be integrated alongside lithium-ion and sodium-ion primary lines, broadening the chemistry mix within turnkey packages.
By Machine Type: Formation Bottleneck Elevates Testing Lines
Coating and drying systems captured the largest 19.1% revenue share in 2024, reflecting their role in electrode quality and capital intensity. Still, formation and testing equipment is set to expand at a 12.8% CAGR because next-generation cells require longer, more complex conditioning cycles. Samsung SDI’s Gen5 prismatic program doubled its formation footprint amid tighter calendar-life targets, delaying ramp schedules until extra chambers arrived. Calendaring presses grow at a 6.2% CAGR as high-nickel cathodes demand extreme nip pressure, while slitting and laser-notching segments face price erosion from Chinese challengers.
As dwell times lengthen, gigafactories re-allocate budgets toward downstream assets, increasing the Battery manufacturing equipment market share of formation chambers and AI-supervised test racks. Suppliers able to combine predictive maintenance with chamber design gain pricing power. Simultaneously, dry-electrode adoption threatens wet-coating incumbents but lifts demand for high-precision calendaring and vacuum-degassing systems. The shift pulls capital into recycling and black-mass equipment as plants pre-integrate end-of-life flows to satisfy EU rules, widening the machine-type spread within turnkey orders.
Note: Segment shares of all individual segments available upon report purchase
Get Detailed Market Forecasts at the Most Granular Levels
Download PDF
By Automation Level: Lights-Out Lines Address Labor Scarcity
Fully automatic systems shipped 60.5% of total units in 2024, but AI-supervised lights-out configurations are climbing at 15.1% CAGR as manufacturers battle a shortage of skilled process engineers. SK On’s Georgia facility runs unmanned night shifts, cutting labor expense by 23% and boosting OEE near 98% with real-time vision systems. Semi-automatic lines remain essential in pilot facilities where chemistry iteration is rapid, yet vendors now design modular kits that upgrade via software unlocks, extending asset life.
Predictive analytics embedded in cloud platforms elevate service revenue and deepen vendor lock-in, expanding the Battery manufacturing equipment market size for digital add-ons. Lights-out solutions also mitigate safety risk in solvent-free and high-temperature solid-state processes. Pneumatic-driven actuators and AI-driven robot scheduling further cut cycle times, enabling throughput gains without extra square footage, a key advantage in retrofit-constrained brownfield sites across Europe and Japan.
By End-User: ESS Integrators Diversify Demand Base
Automotive OEMs and tier-1s absorbed 63.4% of 2024 spend, mirroring their race to secure vertically integrated cell supply. Yet energy-storage-system integrators are forecast to grow 14.7% CAGR as utilities deploy multi-hour projects that favor prismatic LFP cells. Fluence’s Texas venture demonstrates how ESS-specific formats redirect tooling requirements toward robust stacking, welding, and formation infrastructure. Consumer electronics retain a 14.2% share but grow just a 3.1% CAGR because thinner devices need precision retrofit rather than new coating capacity.
Diversification into ESS reduces cyclicality tied to automotive model launches and widens the Battery manufacturing equipment industry revenue base. Industrial power-tool and aerospace segments, though smaller, command premium inspection and traceability features that underpin higher margins. Vendors targeting medical, marine, and defense niches bundle semi-automatic and manual lab-scale gear, sustaining a profitable long-tail beyond mainstream gigafactories.
Note: Segment shares of all individual segments available upon report purchase
Get Detailed Market Forecasts at the Most Granular Levels
Download PDF
Geography Analysis
Asia-Pacific generated 55.2% of 2024 revenue, led by China’s 480 GWh installed capacity and South Korea’s export orientation, though regional growth moderates to 4.2% CAGR as the domestic EV boom matures. China alone delivered 38.1% of global orders, yet lithium-price swings triggered deferrals, exposing suppliers over-reliant on local demand. Japan and South Korea accelerate solid-state pilot programs backed by government subsidies, nudging up their collective share.
North America accounted for 18.6% of 2024 spend and is advancing at a 12.4% CAGR, the fastest worldwide, as IRA credits de-risk new capacity despite higher labor costs. U.S. projects total 320 GWh announced through 2030, while Canada grows 14.8% CAGR on the back of Stellantis-LGES and Volkswagen-PowerCo ventures. Mexico follows with 9.7% CAGR, anchored by Tesla’s Nuevo León site, though infrastructure delays extend commissioning by up to nine months.
Europe secured 21.3% of 2024 revenue, expanding 8.9% CAGR under the Net-Zero Industry Act’s 90 GWh target. Germany remains Europe’s core at 8.4% global share, but orders back-load to 2025-2026 pending subsidy clarity. France and Spain outpace the region as Automotive Cells Company and Volkswagen unlock grants. Nordic momentum slows after Northvolt’s bankruptcy clouds EUR 1.2 billion in open contracts. South America (2.1%) and Middle East & Africa (1.5%) post mid-single-digit growth as resource players eye downstream integration but lack subsidy depth.
Get Analysis on Important Geographic Markets
Download PDF
Competitive Landscape
The Battery manufacturing equipment market exhibits moderate concentration: the top five suppliers, Wuxi Lead, Yinghe Technology, Dürr, Manz, and Hitachi High-Tech, controlled about 38% of 2024 revenue, while no single firm exceeded 12% share. Chinese vendors dominate cost-sensitive coating and stacking tools, undercutting Western peers by up to 40%. European and Japanese incumbents retain leadership in formation, testing, and laser systems, where process IP and after-sales service justify premiums.
Strategic activity in 2024 underscores geographic diversification. Dürr took a 35% stake in a Korean formation specialist, and Manz bought a majority of an Indian startup to localize coating equipment. Yinghe opened a Michigan technical center, while TMAX set a Polish service hub, anticipating local-content rules. ABB partnered with Northvolt on AI robot scheduling, illustrating a shift from hardware margins to lifecycle software revenue.
White-space opportunities arise in solid-state vacuum tools, sodium-ion mixers, and integrated recycling lines, fields where legacy players lack mature offerings. Suppliers embed digital twins and predictive maintenance to secure recurring revenue. The competitive intensity is likely to heighten as subsidy-driven regionalization fragments demand, rewarding vendors able to provide modular, quick-install lines that de-risk chemistry transitions without full plant overhauls.
Battery Manufacturing Equipment Industry Leaders
-
Wuxi Lead Intelligent Equipment Co., Ltd.
-
Yinghe Technology Co., Ltd.
-
Dürr AG
-
Manz AG
-
Hitachi High-Tech Corp.
- *Disclaimer: Major Players sorted in no particular order
Need More Details on Market Players and Competitors?
Download PDF
Recent Industry Developments
- October 2024: Dürr AG won a EUR 420 million contract for coating, drying, and calendaring tools at a 25 GWh Tennessee gigafactory, its largest battery order to date.
- September 2024: Wuxi Lead and LG Energy Solution committed USD 85 million to co-develop 4680 formation lines, targeting 30% cycle-time cuts.
- August 2024: Manz AG acquired 60% of an Indian battery-equipment startup for EUR 32 million to localize coating and slitting production.
- July 2024: Hitachi High-Tech introduced an AI-Vision inspection system that lifted Samsung SDI scrap performance by 2.8 percentage points.
Global Battery Manufacturing Equipment Market Report Scope
Battery manufacturing equipment covers machines and equipment used in the production of raw materials, as well as the processing and assembly of batteries. Dosing machines, mixing and coating machines, and so on are necessary for raw material processing, whereas assembling process equipment comprises electrode stacking and cutting machines, heat sealing, and liquid injection machines. For each segment, the market sizing and forecasts have been done based on revenue (USD Billion). The Global Battery Manufacturing Equipment Market report includes:
By Battery Chemistry
| Lithium-ion |
| Solid-state |
| Sodium-ion |
| Lead-acid |
| Nickel-based |
| Flow Batteries (Zn-Br, Vanadium etc.) |
By Machine Type
| Coating and Drying Systems |
| Calendaring Presses |
| Mixing and Homogenizers |
| Slitting Machines |
| Laser Notching and Cutting |
| Electrode Stacking |
| Vacuum Drying and Degassing |
| Electro-lyte Filling |
| Assembly and Handling Robots |
| Formation and Testing Lines |
| Packaging and Sealing |
| Recycling and Black-mass Processing Equipment |
By Automation Level
| Manual/Lab-scale |
| Semi-automatic |
| Fully-automatic |
| AI-supervised “lights-out” lines |
By End-User
| Automotive OEMs and Tier-1s |
| Energy Storage System Integrators |
| Consumer Electronics |
| Industrial and Power Tools |
| Aerospace and Defense |
| Other End Users |
By Geography
| North America | United States |
| Canada | |
| Mexico | |
| Europe | Germany |
| United Kingdom | |
| France | |
| Italy | |
| Spain | |
| NORDIC Countries | |
| Russia | |
| Rest of Europe | |
| Asia-Pacific | China |
| India | |
| Japan | |
| South Korea | |
| ASEAN Countries | |
| Australia and New Zealand | |
| Rest of Asia Pacific | |
| South America | Brazil |
| Argentina | |
| Rest of South America | |
| Middle East and Africa | Saudi Arabia |
| South Africa | |
| Rest of Middle East and Africa |
| By Battery Chemistry | Lithium-ion | |
| Solid-state | ||
| Sodium-ion | ||
| Lead-acid | ||
| Nickel-based | ||
| Flow Batteries (Zn-Br, Vanadium etc.) | ||
| By Machine Type | Coating and Drying Systems | |
| Calendaring Presses | ||
| Mixing and Homogenizers | ||
| Slitting Machines | ||
| Laser Notching and Cutting | ||
| Electrode Stacking | ||
| Vacuum Drying and Degassing | ||
| Electro-lyte Filling | ||
| Assembly and Handling Robots | ||
| Formation and Testing Lines | ||
| Packaging and Sealing | ||
| Recycling and Black-mass Processing Equipment | ||
| By Automation Level | Manual/Lab-scale | |
| Semi-automatic | ||
| Fully-automatic | ||
| AI-supervised “lights-out” lines | ||
| By End-User | Automotive OEMs and Tier-1s | |
| Energy Storage System Integrators | ||
| Consumer Electronics | ||
| Industrial and Power Tools | ||
| Aerospace and Defense | ||
| Other End Users | ||
| By Geography | North America | United States |
| Canada | ||
| Mexico | ||
| Europe | Germany | |
| United Kingdom | ||
| France | ||
| Italy | ||
| Spain | ||
| NORDIC Countries | ||
| Russia | ||
| Rest of Europe | ||
| Asia-Pacific | China | |
| India | ||
| Japan | ||
| South Korea | ||
| ASEAN Countries | ||
| Australia and New Zealand | ||
| Rest of Asia Pacific | ||
| South America | Brazil | |
| Argentina | ||
| Rest of South America | ||
| Middle East and Africa | Saudi Arabia | |
| South Africa | ||
| Rest of Middle East and Africa | ||
Need A Different Region or Segment?
Customize Now
Key Questions Answered in the Report
How large is the Battery manufacturing equipment market today?
The Battery manufacturing equipment market size reached USD 17.09 billion in 2025 and is set to climb to USD 22.70 billion by 2030 at a 5.85% CAGR.
Which machine type is expanding fastest?
Formation and testing lines are the fastest-growing machine type, advancing at a 12.8% CAGR through 2030 as longer conditioning cycles become the main bottleneck.
Why is North America’s demand rising so quickly?
IRA production credits of up to USD 45 kWh make domestic plants financially attractive, pushing North American equipment demand to a 12.4% CAGR.
What impact will solid-state batteries have on equipment suppliers?
Solid-state lines require vacuum-deposition and sulfide-handling modules that cost nearly three times standard lithium-ion tools, creating a high-margin parallel equipment segment forecast to grow at 31.5% CAGR.
How are suppliers addressing raw-material price volatility?
Vendors increasingly include commodity-indexed pricing clauses and offer leasing models to share risk, though these mechanisms shorten backlog visibility and complicate capacity planning.
Which companies lead the competitive field?
Wuxi Lead, Yinghe Technology, Dürr, Manz, and Hitachi High-Tech top the revenue ranks, together holding about 38% of the global total.
Page last updated on:


