
Automotive Imaging Market Size and Share
Market Overview
| Study Period | 2020 - 2031 |
|---|---|
| Market Size (2026) | USD 6.15 Billion |
| Market Size (2031) | USD 9.01 Billion |
| Growth Rate (2026 - 2031) | 7.94 % |
| Fastest Growing Market | Asia-Pacific |
| Largest Market | North America |
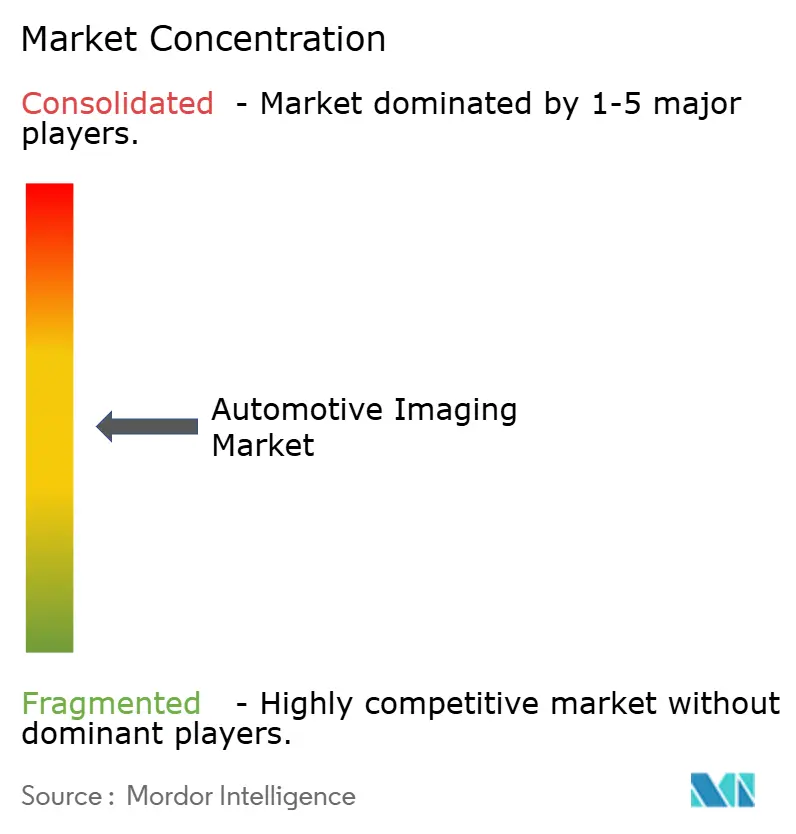
| Market Concentration | Medium |
Major Players
*Disclaimer: Major Players sorted in no particular order Image © Mordor Intelligence. Reuse requires attribution under CC BY 4.0. |
|
Automotive Imaging Market Analysis by Mordor Intelligence
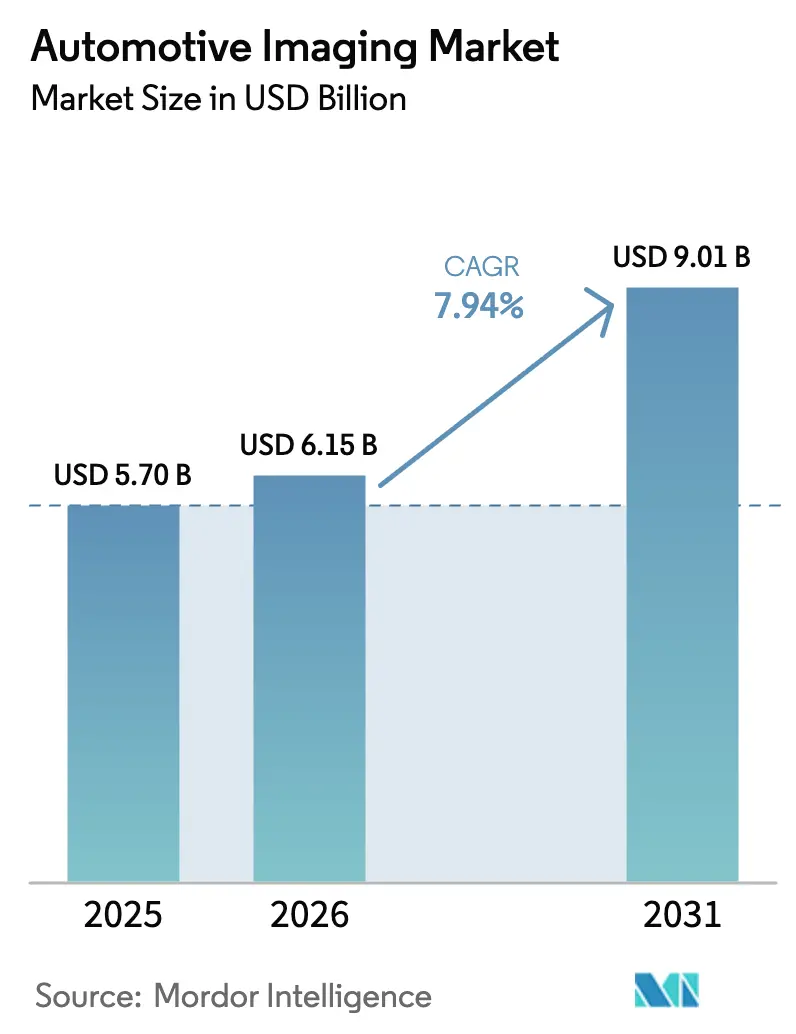
The automotive imaging market size is expected to grow from USD 5.7 billion in 2025 to USD 6.15 billion in 2026 and is forecast to reach USD 9.01 billion by 2031 at 7.94% CAGR over 2026-2031. This growth comes as vehicle platforms evolve into software-defined systems that depend on cameras, LiDAR and imaging radar for perception across all driving modes. Momentum is strongest where New Car Assessment Programme (NCAP) protocols, automatic emergency braking (AEB) requirements and over-the-air (OTA) cybersecurity rules converge, compelling automakers to add more high-resolution cameras and depth sensors per vehicle. Cost breakthroughs in stacked single-photon avalanche diode (SPAD) time-of-flight (ToF) components, together with 8-Mpixel high-dynamic-range (HDR) CMOS imagers, lower the entry barrier for mass-market models. At the same time, robotaxi pilots, particularly in North America and China, validate >12-camera reference designs that will eventually cascade into passenger cars. Technology suppliers respond by integrating AI image-signal-processing blocks directly on-sensor, cutting latency by 30% while reducing printed-circuit-board footprint and power budgets.
Key Report Takeaways
- By product type, CMOS image sensors held 38.10% of automotive imaging market share in 2025 and remain the revenue anchor.
- By product type, solid-state LiDAR is advancing at a 28.15% CAGR to 2031, giving it the fastest growth trajectory in the automotive imaging market.
- By vehicle type, the passenger-car segment generated 62.40% of 2025 revenue, whereas robotaxis and shuttles are projected to expand at a 37.25% CAGR through 2031.
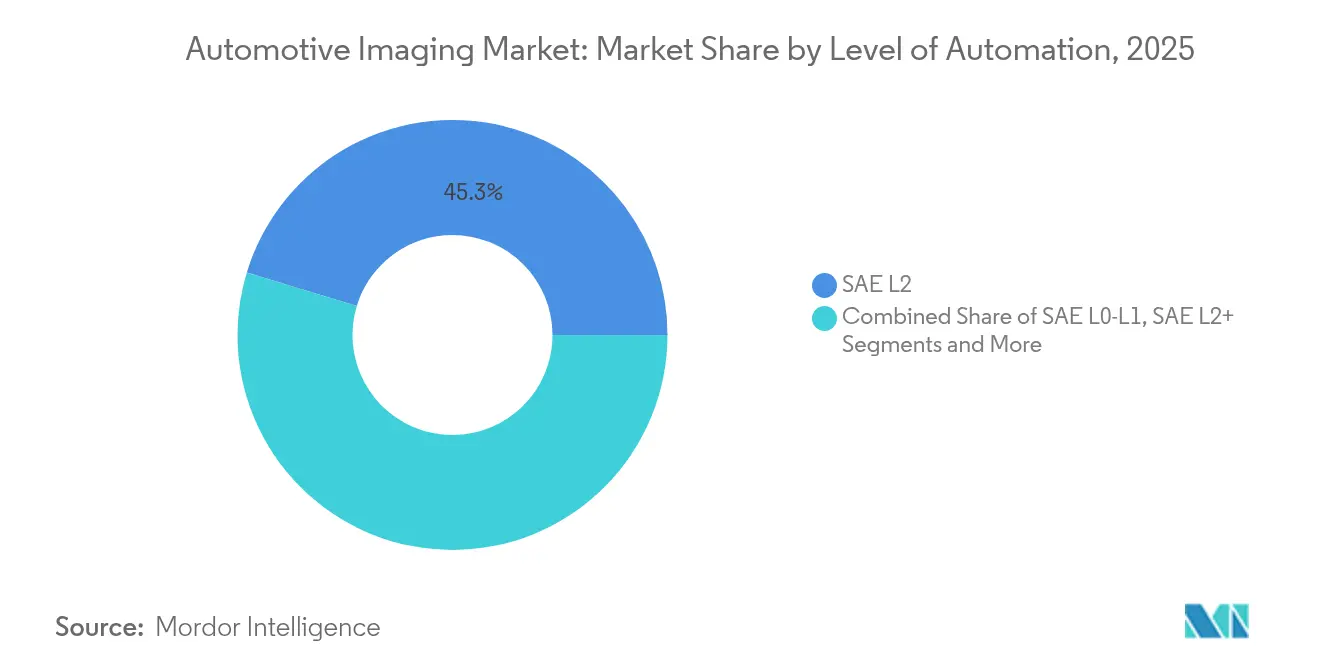
- By level of automation, SAE L2 accounted for 45.30% of deployments in 2025; SAE L4+ solutions are forecast to post a 33.85% CAGR over the period.
- By application, rear-view cameras represented 27.90% of the automotive imaging market size in 2025, while in-cabin monitoring leads growth at a 26.2% CAGR.
- By imaging technology, 2-D CMOS retained 43.50% of the automotive imaging market size in 2025; 4-D radar is set to grow at 23.6% CAGR.
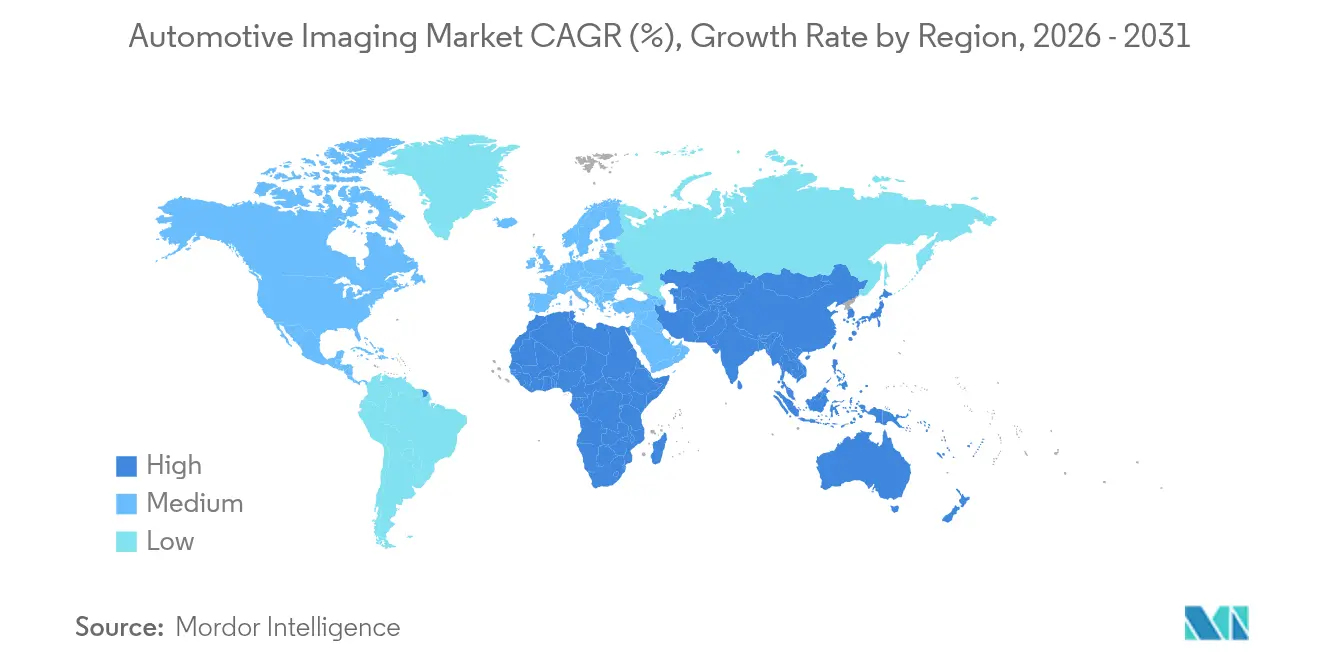
- Geographically, Asia-Pacific commanded 41.60% of 2025 revenue and is expected to progress at an 11.1% CAGR to 2031.
Note: Market size and forecast figures in this report are generated using Mordor Intelligence’s proprietary estimation framework, updated with the latest available data and insights as of 2026.
Market Trends and Insights
Drivers Impact Analysis of Automotive Imaging Market*
| Driver | (~) % Impact on CAGR Forecast | Geographic Relevance | Impact Timeline |
|---|---|---|---|
| Heightened NCAP-driven multi-camera mandates | 2.10% | Global, with early gains in EU, US, China | Medium term (2-4 years) |
| Cost-down of stacked SPAD ToF sensors below US$50 | 1.80% | APAC core, spill-over to North America | Short term (≤ 2 years) |
| Rapid shift to 8-Mpixel HDR image sensors in ADAS | 1.50% | Global, with concentration in premium segments | Medium term (2-4 years) |
| Robotaxi pilots triggering >12-camera architectures | 2.30% | North America, China, select EU cities | Long term (≥ 4 years) |
| Cyber-secure OTA update regulations (UNECE R156) | 1.20% | EU, Japan, South Korea, expanding globally | Short term (≤ 2 years) |
| Integrated AI ISP reducing latency by 30% | 1.70% | Global, with early adoption in APAC | Medium term (2-4 years) |
| Source: Mordor Intelligence | |||
Heightened NCAP-driven Multi-camera Mandates
Evolving NCAP rules require broader camera coverage for higher safety ratings. The US National Highway Traffic Safety Administration ruled that all light vehicles must feature AEB by September 2029, pushing automakers to add forward, side and rear imaging units for pedestrian detection. Euro NCAP’s 2026 protocol introduces enhanced vulnerable-road-user assessments, encouraging high-dynamic-range sensors able to operate in varied lighting. China NCAP 2024 implements similar multi-camera benchmarks with added emphasis on night-vision capability, further lifting demand for thermal imaging. Together, these standards turn multi-camera arrays into foundational safety infrastructure rather than premium options. Suppliers that deliver AEC-Q-qualified 8-Mpixel sensors stand to benefit as OEMs converge on four- to six-camera baselines for all trims of future model years. [1]
Cost-down of Stacked SPAD ToF Sensors Below USD 50
Sony’s IMX479 stacked SPAD depth sensor exemplifies how manufacturing scale drives solid-state LiDAR costs below USD 50, unlocking depth perception for mid-tier vehicles. SPAD arrays now achieve 37% photon-detection efficiency at 300 m range, meeting ISO 26262 redundancy guidelines without mechanical scanning. Automakers leverage the economic crossover to deploy hybrid camera-LiDAR bundles that mitigate corner-case failures and improve automatic emergency braking performance. Industry trackers anticipate SPAD-based ToF penetration to exceed 40% of global new-vehicle programs by 2027, compared with under 5% in 2024, confirming the cost inflection as a key growth catalyst for the automotive imaging market. [2]
Rapid Shift to 8-Mpixel HDR Image Sensors in ADAS
Sony’s ISX038 CMOS imager outputs RAW and YUV streams simultaneously and delivers 106 dB dynamic range, enabling single-camera modules to replace multiple lower-resolution devices. OEMs such as Subaru embed 8-Mpixel sensors in next-generation EyeSight systems to classify objects beyond 200 m while keeping ASIL-C compliance. Higher resolution improves long-range object identification, which is critical for highway-speed AEB and adaptive cruise control. The accelerated migration toward 8-Mpixel architectures therefore raises average sensor selling prices and deepens semiconductor content per vehicle, directly lifting the automotive imaging market.
Robotaxi Pilots Triggering >12-camera Architectures
Waymo’s Jaguar I-Pace robotaxi integrates 51 sensors, including multi-spectral cameras for full 360-degree perception. Tesla is commercializing a camera-only robotaxi concept that relies on high-performance AI processors to extract depth cues, shaping supplier roadmaps toward higher resolution and global-shutter designs. The technical proof points created by robotaxi fleets orient consumer-vehicle programs toward similar topologies, reinforcing the long-term pull for complex imaging suites in the automotive imaging market.
Restraints Impact Analysis of Automotive Imaging Market*
| Restraint | (~) % Impact on CAGR Forecast | Geographic Relevance | Impact Timeline |
|---|---|---|---|
| Persistent thermal management issues in 120°C engine bays | -1.40% | Global, with severity in hot climates | Medium term (2-4 years) |
| L4 regulatory ambiguity delaying high-volume LiDAR take-rate | -2.10% | North America, EU regulatory zones | Long term (≥ 4 years) |
| Silicon supply crunch for BSI pixels <2 µm | -1.80% | Global, concentrated in advanced nodes | Short term (≤ 2 years) |
| Radar–camera fusion IP litigation risk | -0.90% | North America, EU legal jurisdictions | Medium term (2-4 years) |
| Source: Mordor Intelligence | |||
Persistent Thermal Management Issues in 120 °C Engine Bays
Cameras mounted near radiators or exhaust manifolds face temperature cycling from -40 °C to +125 °C, compromising alignment and accelerating component aging. Samsung Electro-Mechanics is readying weather-proof modules with lens heating and hydrophobic coatings, but these counter-measures inflate bill-of-materials cost. STMicroelectronics’ VG6640 sensor extends operation to +125 °C, yet sustained exposure still erodes signal-to-noise margins. Thermal stress therefore hinders free placement of forward-facing cameras and limits uptake in certain vehicle segments, tempering growth for the automotive imaging market.
L4 Regulatory Ambiguity Delaying High-Volume LiDAR Take-rate
UNECE Working Party 29 has yet to finalize cohesive Level 4 frameworks, leaving OEMs uncertain about the sensor redundancy they must certify. The lack of clarity compels program engineers to qualify different sensor stacks for Europe, North America and China, slowing purchasing commitments that could drive LiDAR cost curves downward. Even market leader Hesai, which holds 37% global automotive LiDAR share, notes that heterogeneous rules complicate global platform scaling. Until uniform homologation paths emerge, mainstream brands will favor mature camera-radar suites and delay high-volume LiDAR integration, shaving percentage points off the automotive imaging market CAGR.
*Our forecasts treat driver/restraint impacts as directional, not additive. The impact forecasts reflect baseline growth, mix effects, and variable interactions.
Automotive Imaging Market Segment Analysis
By Product Type:
CMOS Sensors Drive Volume While LiDAR Captures GrowthCMOS image sensors accounted for 38.10% of 2025 revenue and set the cadence for the automotive imaging market size because nearly every vehicle grade depends on at least one CMOS-based camera. Sony aims to lift its automotive share to 43% by fiscal 2026 on the strength of stacked-sensor roadmaps and stable wafer supply contracts. Increasing frame rates and HDR levels allow a single 8-Mpixel module to replace multiple VGA units, cutting harness weight while raising content value. The segment also benefits from cost-optimized wafer stacking that integrates AI ISP blocks, shortening development cycles for Tier 1 modules.
Solid-state LiDAR, in contrast, contributed a modest revenue base in 2025 but demonstrates a 28.15% CAGR through 2031, the fastest across product categories in the automotive imaging market. Vendors such as Luminar deliver 4-fold performance gains and 50% cost reductions in one product turn, shrinking housing dimensions to fit behind windshield blackouts. Mass-market adoption accelerates when OEMs pair LiDAR with existing camera suites for higher NCAP ratings, unlocking advanced hands-free features. The combination of volume CMOS shipments and high-growth LiDAR pulls supporting segments—vision processors, ToF sensors and camera-module assemblies—up the value chain.


By Vehicle Type:
Passenger Cars Dominate While Robotaxis Drive InnovationPassenger cars generated 62.40% of automotive imaging market demand in 2025, anchored by global AEB mandates that compel inclusion of rear-view and forward-facing cameras. Typical C-segment sedans now ship with eight imagers; mid-cycle refreshes slated for 2027 already blueprint for twelve. Rising trim penetration for 360-degree surround-view cameras further elevates average sensor counts, sustaining high wafer utilization at foundry partners.
Robotaxis and shuttles, albeit smaller in unit terms, carry a 37.25% CAGR that outpaces every other vehicle category. Fleet operators insist on redundant camera-LiDAR-radar stacks exceeding 50 sensors to meet no-driver fallback requirements. These reference designs validate megapixel-grade thermal imagers, 4-D radar and multi-camera synchronization networks that later flow into premium passenger vehicles. The technology spillover feeds cross-segment scalability, cementing the automotive imaging market as a beneficiary of autonomous mobility trials.
By Level of Automation:
L2 Systems Dominate Current DeploymentsSAE Level 2 systems held 45.30% share in 2025, supported by widespread consumer acceptance and straightforward homologation. Standard feature packs bundle adaptive cruise control, lane-keep assist and traffic-sign recognition—functionality that relies on three to five cameras and keeps unit prices attractive. Continuous software updates boost perceived value without altering the hardware bill, ensuring recurring demand for mid-tier imagers.
Level 4+ prototypes, though limited in volume, are forecast to advance at 33.85% CAGR and exert strong influence on sensor-suite specifications. Automakers developing hands-off cruising or urban chauffeur features need low-latency imaging pipelines and long-range LiDAR redundancy. As regulatory frameworks settle, the automotive imaging market will see an uptick in dual-LiDAR front-facing configurations and multi-camera fail-operational topologies that originated in robotaxi pilots.
By Application:
Rear-View Cameras Provide Foundation While In-Cabin Monitoring AcceleratesRear-view cameras formed the largest application group at 27.90% of 2025 revenue after becoming mandatory in the United States, Canada, EU and China. Commoditized VGA sensors and economies of scale curb unit pricing, yet global volumes keep the segment robust. Greater differentiation now occurs in lens cleaning, thermal durability and miniaturization, pushing suppliers to integrate micro-heaters and water-repellent coatings directly into housings.
Driver and occupant monitoring systems deliver the steepest expansion, posting a 26.2% CAGR as Level 2+ regulation requires continuous driver gaze tracking. Near-infrared global-shutter sensors with RGB-IR pixel architectures acquire accurate eye-closure metrics even under sunglass occlusion. Automakers combine these imagers with time-of-flight depth cameras to classify occupants, deploy smart airbags and enable hands-off verification for conditional automation. As user-experience designers add gaze-based HMI interactions, in-cabin monitoring becomes a strategic revenue lever, bolstering the automotive imaging market.
Geography Analysis
APAC Automotive Imaging Market
Asia-Pacific led with 41.60% of 2025 revenue and an 11.1% CAGR outlook, anchored by China’s aggressive electrification targets and LiDAR scale. Hesai alone captured 37% global LiDAR shipments, extending from robotaxis into premium EVs. Japanese suppliers add momentum; Sony seeks 43% of global automotive CMOS share by 2026 as domestic OEMs expand camera counts. South Korea contributes through Samsung Electro-Mechanics’ weather-proof modules, mitigating regional hot-climate challenges. These developments ensure a continuous pull for sensor wafers, modules and AI processors throughout the region.
North America Automotive Imaging Market
North America remains the second-largest market due to early autonomous pilot programs and firm NHTSA timelines for AEB deployment. High-power compute availability and a robust software ecosystem accelerate the adoption of camera-centric ADAS across both passenger cars and robotaxi fleets. Regional suppliers secure long-term allocation of 8-Mpixel sensors, minimizing exposure to potential supply disruptions.
EMEA and South America Automotive Imaging Market
Europe sustains strong demand, propelled by Euro NCAP’s 2026 scoring model that weights pedestrian and cyclist protection heavily. German premium brands incorporate multi-modal sensor fusion to defend market positioning, fostering uptake of 4-D radar and thermal imagers. Middle East and Africa, although nascent, mimic European regulation over time, while South America catches up as local safety agencies tighten crash-avoidance criteria. Across all territories, regulated safety performance underpins the automotive imaging market’s resilience to macroeconomic cycles.
Regulatory Landscape
Regulatory and assessment protocols are a key demand lever for camera and depth-sensing content in vehicles. Euro NCAPs 2026 protocol strengthens scoring around vulnerable road users, increasing the need for higher dynamic range and low-light capable imagers. China NCAP 2024 similarly raises the bar on multi-camera performance, including night-vision capability.
In the United States, the National Highway Traffic Safety Administration finalized a rule requiring automatic emergency braking (AEB) on all light vehicles by September 2029, reinforcing the shift from optional camera features to baseline perception suites. Conformity requirements are also expanding into quality, functional safety, and cyber-secure software operations that affect imaging electronics. IEEE P2020 (Standard for Automotive System Image Quality) provides a standardized method to evaluate automotive camera image quality for ADAS use cases, and ISO 26262 remains a key gate for ASIL-aligned sensor and processing designs. UNECE cybersecurity and software update frameworks (UN R155 and UNECE R156) add compliance obligations for secure OTA updates and lifecycle cyber risk management, pushing OEMs and Tier 1s to harden camera, LiDAR, and ISP pipelines against manipulation and update-related faults.
Value Chain Analysis
The automotive imaging value chain begins with wafer and specialty semiconductor inputs (CMOS image sensors, SPAD/ToF devices, radar front ends), then moves through optics and packaging (lenses, filters, housings, AEC-qualified assembly). The chain further extends into camera and LiDAR module manufacturing and ECU integration by Tier 1 suppliers.
Downstream, OEMs integrate perception stacks with domain or zone architectures and in-vehicle networks. OTA-capable software and cybersecurity compliance are increasingly influencing component selection and validation cycles. Supply and manufacturing strategies are shifting alongside higher-resolution imagers and more complex multi-sensor suites. Sony is adding development and production lines in Koshi City, Kumamoto Prefecture, aligning capacity and process technology with automotive-grade image sensor demand. onsemi highlights a hybrid model that combines internal manufacturing with external partners to improve resilience, and it is also executing its Fab Right strategy, including agreements to divest two manufacturing facilities, to optimize footprint and cost structure.
Competitive Landscape
The competitive field exhibits moderate concentration: the five largest suppliers—Sony, ON Semi, OmniVision, Samsung and Bosch—collectively account for roughly 55% of 2024 revenue. Sony capitalizes on wafer-stacking IP to achieve high margins on 8-Mpixel HDR parts. ON Semi secures guaranteed demand by aligning with DENSO in a strategic share purchase arrangement that locks in capacity for ADAS programs. [4]
Partnerships now shape differentiation. Volkswagen teams with Valeo and Mobileye to embed a centralized Surround ADAS platform that fuses 360-degree cameras with imaging radar for Level 2+ features. Continental spins off its Automotive unit as Aumovio to focus investment on software-defined mobility and sensor innovation. Meanwhile, Valeo collaborates with Teledyne FLIR to introduce thermal imaging modules addressing Euro NCAP night-time pedestrian tests.
Emerging LiDAR companies concentrate on cost, size and power. Luminar’s Halo sensor achieves 4-fold range improvement and 3-fold housing reduction, priming the architecture for windshield integration. Innoviz and RoboSense chase similar integration metrics, targeting sub-USD 500 bill-of-materials for volume projects. The dynamic tensions between incumbent CMOS leaders and LiDAR disruptors sustain technological diversity within the automotive imaging market.
Automotive Imaging Industry Leaders
-
Sony Group Corporation
-
ON Semiconductor Corporation
-
OmniVision Technologies, Inc.
-
Continental AG (ADAS & Sensor BU)
-
Samsung Electronics Co., Ltd.
- *Disclaimer: Major Players sorted in no particular order
Automotive Imaging Market Companies Covered in this Report
- Sony Group Corporation
- ON Semiconductor Corporation
- OmniVision Technologies, Inc.
- Samsung Electronics Co., Ltd.
- Panasonic Holdings Corporation
- STMicroelectronics N.V.
- Robert Bosch GmbH
- Continental AG
- Aptiv plc
- ZF Friedrichshafen AG
- Valeo SE
- Magna International Inc.
- DENSO Corporation
- Veoneer Holdings Ltd.
- LG Electronics Inc.
- Luminar Technologies, Inc.
- Innoviz Technologies Ltd.
- Hesai Group
- RoboSense (Beijing) Technology Co., Ltd.
- PIXELPLUS Co., Ltd.
Market Opportunities and Future Outlook
Opportunities are widening where standardized interfaces, platform integration, and domestic capacity programs reduce friction for OEMs moving to higher-resolution and multi-camera baselines. Sony Semiconductor Solutions and TSMC signed a preliminary agreement in May 2026 to form a joint venture to develop and manufacture next-generation image sensors for automotive and robotics, with Japanese government financial support reportedly totaling USD 380 million.
A second opportunity area is the convergence of imaging sensors with centralized compute and automotive Ethernet in software-defined vehicle architectures, where latency, bandwidth, and temperature tolerance affect purchasing decisions. Suppliers such as onsemi are positioning around intelligent sensing and in-vehicle connectivity building blocks (including 10BASE-T1S Ethernet), which complements the shift toward richer sensor fusion and lower-latency perception pipelines. At the same time, the lack of uniform Level 4 homologation keeps OEMs qualifying multiple sensor stacks across regions, creating near-term whitespace for flexible, standards-aligned sensor platforms that can be reused across trims, vehicle types, and regulatory zones.
Recent Industry Developments in Automotive Imaging Market
- January 2026: OmniVision announced 8MP OX08D10 and 3MP OX03H10 CMOS image sensors with TheiaCel technology are supported on NVIDIA DRIVE AGX Hyperion autonomous vehicle platform. The initiative ties high resolution sensing to a leading on vehicle compute platform, expanding sensor suites for ADAS and automation. The on platform integration accelerates production ready autonomous driving sensor suites through on platform sensor integration.
- October 2025: Sony Semiconductor Solutions announced the upcoming IMX828 automotive image sensor with built in MIPI A-PHY interface for automotive applications. The move standardizes MIPI A-PHY for vehicle sensors, reducing system integration complexity across perception stacks. The capacity addition strengthens the alignment of sensor modules with automotive compute and storage interfaces for faster deployment in next gen ADAS.
- October 2025: OmniVision launched the OX08D20 8 megapixel CMOS image sensor with TheiaCel technology for exterior automotive cameras. The exterior camera sensor addition supports higher resolution sensing in mass market vehicles, aiding next gen ADAS deployments. The capability expands OmniVision's footprint in exterior imaging and reinforces multi sensor stack adoption in mainstream models.
Automotive Imaging Market Report Scope and Research Methodology
Market Definition and Coverage
For this study, the automotive imaging market covers the hardware and enabling processing that helps a vehicle capture, interpret, and use visual or perception data for safety, automation, and in-cabin functions, across major automotive regions.
Scope exclusions: We exclude unrelated infotainment displays and generic telematics services when they are not directly tied to imaging sensors, modules, or perception hardware.
Segments Covered in This Report
-
By Product Type
- CMOS Image Sensors
- Camera Modules
- Vision Processors / ISP
- LiDAR Units
- Radar Sensors
-
By Vehicle Type
- Passenger Cars
- Light Commercial Vehicles
- Heavy Commercial Vehicles
- Robotaxis and Shuttles
-
By Level of Automation
- SAE L0-L1
- SAE L2
- SAE L2+
- SAE L3
- SAE L4+
-
By Application
- Rear View
- 360-Surround
- Forward ADAS
- Night-Vision & Side-Mirror Replacement
- In-Cabin Driver/Occupant Monitoring
- Dashboard / Event Data
-
By Imaging Technology
- 2-D CMOS
- 3-D ToF / Structured Light
- Mechanical LiDAR
- Solid-State LiDAR
- 4-D Imaging Radar
-
By Geography
-
North America
- United States
- Canada
- Mexico
-
Europe
- United Kingdom
- Germany
- France
- Italy
- Rest of Europe
-
Asia-Pacific
- China
- Japan
- India
- South Korea
- Rest of Asia-Pacific
-
Middle East
- Israel
- Saudi Arabia
- United Arab Emirates
- Turkey
- Rest of Middle East
-
Africa
- South Africa
- Egypt
- Rest of Africa
-
South America
- Brazil
- Argentina
- Rest of South America
-
North America
Data Sources, Market Sizing, and Validation
Desk Research
Desk work starts with building a clean fact base on vehicle production and safety feature adoption, because imaging content per vehicle is the main driver of demand. We referenced public sources such as OICA vehicle production statistics, UNECE vehicle safety regulations, NHTSA rulemaking and compliance notes, and Euro NCAP test protocols to understand which camera and sensing functions are being pulled into standard fit.
To convert demand signals into a usable market model, we also reviewed technical and pricing indicators from sources such as SAE papers, IEEE publications, and patent databases. These sources helped track architecture shifts including HDR, ToF, and imaging radar. On top of that, company filings, investor presentations, and reputable press were used to confirm product roadmaps and capacity expansions. Paid subscriptions for company financials, news, and patent analytics were used selectively where public disclosure was thin. This list is not exhaustive, and many other sources were used for data collection, validation, and clarification.
Primary Interviews and Surveys
Primary work was used to pressure test the desk assumptions, especially around camera count per vehicle, attach rates by ADAS package, and how quickly LiDAR and imaging radar move from pilots into series production. We spoke with a mix of component suppliers, automotive system integrators, and vehicle platform stakeholders across key regions so that pricing, take rates, and near-term supply constraints could be triangulated with real buying behavior.
Distribution of primary research fieldwork respondents
| Company type | Respondent position | Region |
|---|---|---|
| Top tier: 25% | CXOs: 17% | APAC: 50% |
| Mid tier: 55% | Functional/Unit leaders: 34% | EMEA: 29% |
| Smaller Players: 20% | Managers: 49% | Americas: 21% |
Market-Sizing & Forecasting
Sizing is built using a top-down demand pool logic where vehicle production by region is combined with penetration of rear view, surround view, forward ADAS, and in-cabin monitoring features, then translated into component demand. The model stays practical by updating a few inputs carefully, including average cameras per vehicle by trim, the mix shift toward higher-resolution sensors, the share of vehicles using ToF for in-cabin sensing, and early adoption curves for LiDAR and 4-D imaging radar.
Once the demand pool is shaped, average selling prices are applied by component type. These are adjusted for expected price erosion and spec upgrades, then checked against sampled supplier roll-ups and channel discussions to keep totals realistic. Where disclosure is incomplete, gaps are handled using proxy ratios such as imaging content per ADAS-equipped vehicle, cross-checked against known platform launches.
For forecasting, we use scenario analysis supported by a light multivariate regression that links revenue to vehicle builds, ADAS feature fitment, and regulatory pull in major markets. Assumptions are tightened after expert feedback, because timing differences in platform refresh cycles can change the curve even when long-term adoption stays intact.
Data Validation & Update Cycle
Outputs are validated through multiple checks, starting with consistency tests between regional vehicle production, feature adoption, and implied sensor shipments. If a region shows an unusual jump, the underlying variables are revisited and follow-up calls are triggered to confirm whether the change is real or driven by a modeling assumption.
Before sign-off, the model and narrative are reviewed in steps by analysts so calculation logic, units, and currency conversions align with the stated scope. Reports are refreshed annually, and if a material event happens, such as a major safety mandate update or a sudden supply disruption, interim updates are made. Right before delivery, a fresh pass is completed so clients receive the most current view.
Mordor Intelligence's Global Automotive Imaging Market Sizing Compared With Other Published Estimates
It is normal for published market sizes to look different even when they use the same market name, since included components and counting logic can vary substantially. Differences usually show up when one estimate focuses only on camera modules, while another mixes in adjacent perception hardware. Another common divergence is whether certain vehicle types, such as robotaxis, are treated as separate buckets.
In this study, the largest gap drivers were scope boundaries and how content per vehicle is modeled. Camera counts, LiDAR take rates, and imaging radar ramp timing do not move together across regions. We also saw that some estimates lock prices to a single year, while others let ASPs move with resolution upgrades and sensor fusion trends. Refresh cadence can also shift the current-year anchor when adoption data changes mid-cycle.
Benchmark comparison
| Source | Market Size | Gaps in Research Methodology |
|---|---|---|
| Mordor Intelligence | USD 6.15 B (2026) | |
| Trade Journal A | USD 6.00 B (2024) | This figure is presented as camera module revenue, which typically excludes LiDAR units, radar sensors, and vision processors, and it anchors on an earlier year that can miss later feature-fitment changes. |
| Industry Tracker B | USD 8.70 B (2030) | This estimate is a forward milestone for camera modules and may not align to a full automotive imaging scope or to a 2026-2031 forecast window, so timing and included components can inflate comparisons. |
The spread in the table is mainly explained by whether the number is about camera modules only or about a wider imaging stack, and also by which year is used as the anchor for adoption and pricing. Counting LiDAR units, radar sensors, and vision processors alongside camera modules is the key scope call that brings the 2026 value to USD 6.15 B in Mordor Intelligence.
Key Questions Answered in the Report
What is the current size of the automotive imaging market?
The automotive imaging market was valued at USD 6.15 billion in 2026 and is projected to reach USD 9.01 billion by 2031.
Which product segment grows fastest within the automotive imaging market?
Solid-state LiDAR registers the highest growth, expanding at a 28.15% CAGR through 2031 as costs fall below USD 50 per unit.
Why are 8-Mpixel sensors important for advanced driver assistance systems?
They offer extended detection range beyond 200 m and 106 dB dynamic range, enabling single-camera modules to support highway-speed AEB and adaptive cruise control.
How many cameras does a typical robotaxi use?
Leading robotaxi platforms integrate more than 12 cameras, with some designs exceeding 50 sensors when including LiDAR, radar and ultrasonic devices.
Which region leads the automotive imaging market?
Asia-Pacific leads with 41.60% revenue share in 2025 and shows the fastest growth at an 11.1% CAGR through 2031.
What are the main restraints on market growth?
High engine-bay temperatures that degrade sensors and regulatory ambiguity around Level 4 autonomy slow high-volume LiDAR adoption.