
Automotive Fuse Market Size and Share
Market Overview
| Study Period | 2020 - 2031 |
|---|---|
| Market Size (2026) | USD 2.27 Billion |
| Market Size (2031) | USD 3.19 Billion |
| Growth Rate (2026 - 2031) | 7.04 % |
| Fastest Growing Market | Asia Pacific |
| Largest Market | Asia Pacific |
| Market Concentration | Medium |
Major Players *Disclaimer: Major Players sorted in no particular order Image © Mordor Intelligence. Reuse requires attribution under CC BY 4.0. | |
Automotive Fuse Market Analysis by Mordor Intelligence
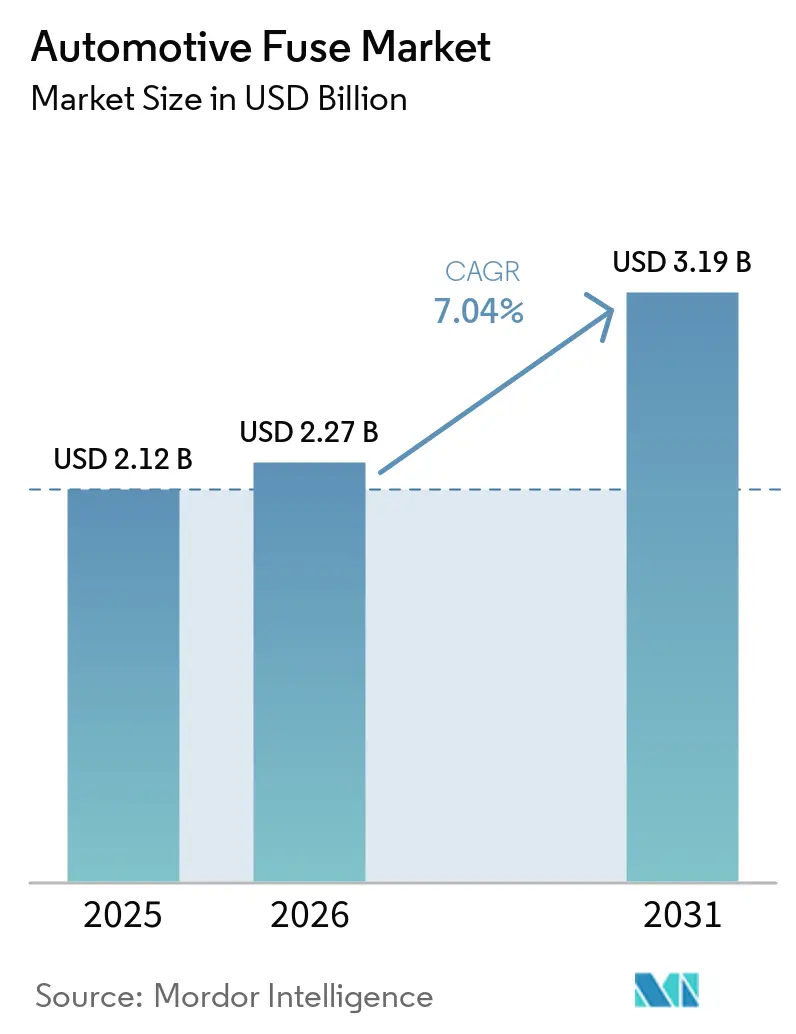
The automotive fuse market size was valued at USD 2.12 billion in 2025 and estimated to grow from USD 2.27 billion in 2026 to reach USD 3.19 billion by 2031, at a CAGR of 7.04% during the forecast period (2026-2031). Rapid vehicle electrification, growth in 48 V architectures, and rising electronic content per vehicle collectively encourage OEMs to specify advanced over-current protection that moves beyond legacy blade designs. High-voltage battery packs rated up to 1,000 V now dominate new EV platforms, prompting fuse makers to adapt materials, melting elements, and thermal management for safe DC interruption. OEM preference for smart, self-resettable units accelerates the transition toward electronic fusing while regulators tighten rules that favor qualified, traceable components. The dual effect of stricter safety norms and expanding on-board computing drives consistent demand across passenger, commercial, and specialty vehicle programs.
Key Report Takeaways
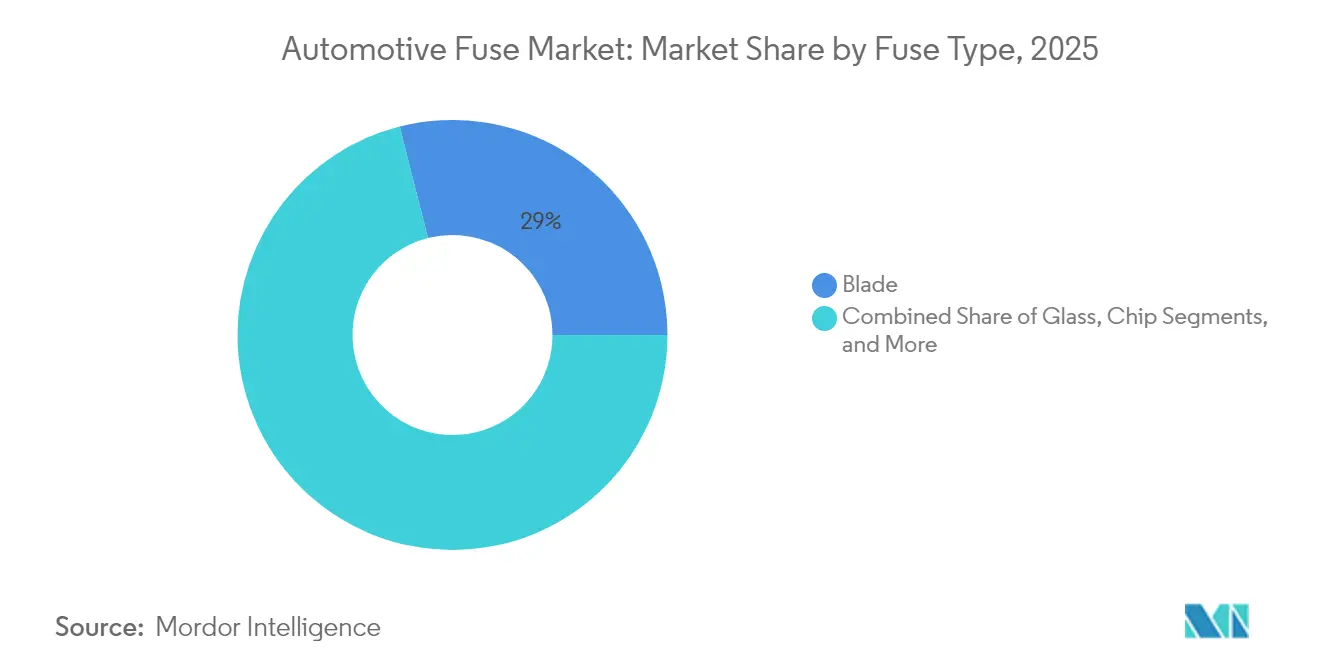
- By fuse type, blade fuses led with 28.95% of the automotive fuse market share in 2025, while high-voltage fuses are forecast to grow at an 8.59% CAGR through 2031.
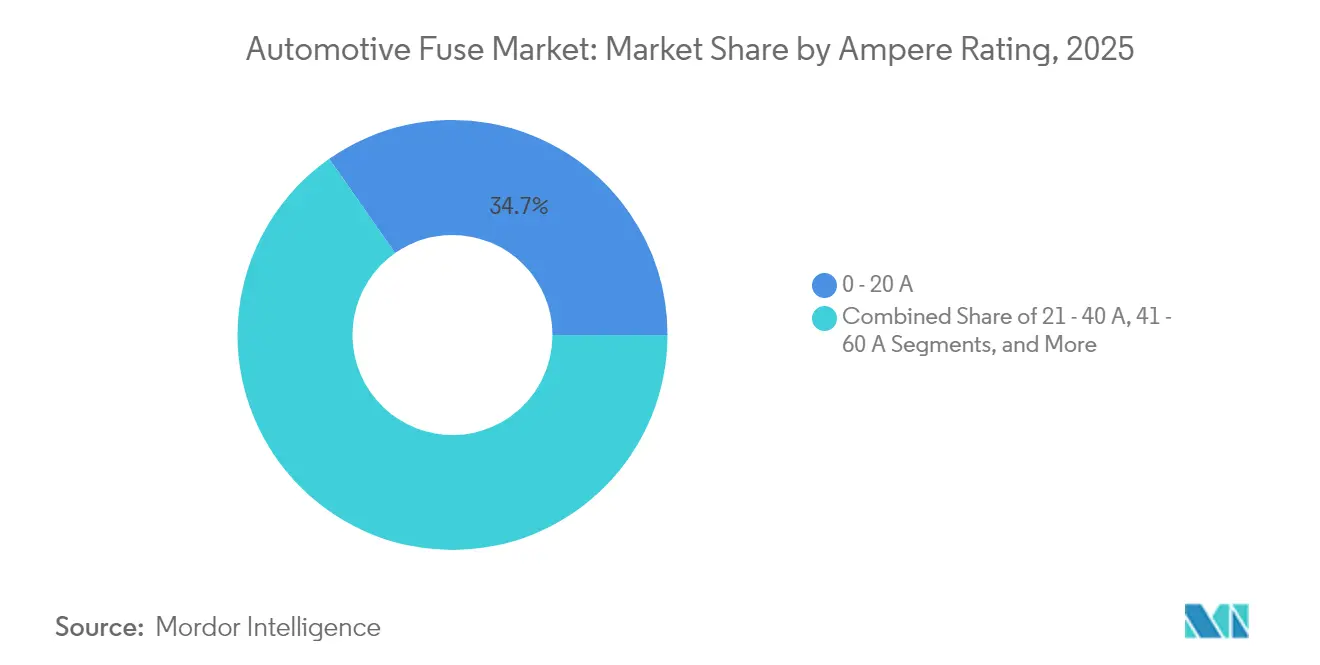
- By ampere rating, the 0–20 A class captured 34.72% share of the automotive fuse market size in 2025, and the > 60 A class is advancing at an 8.76% CAGR to 2031.
- By vehicle type, passenger cars held 60.65% revenue share in 2025; battery electric vehicles will expand at a 8.95% CAGR during the forecast period.
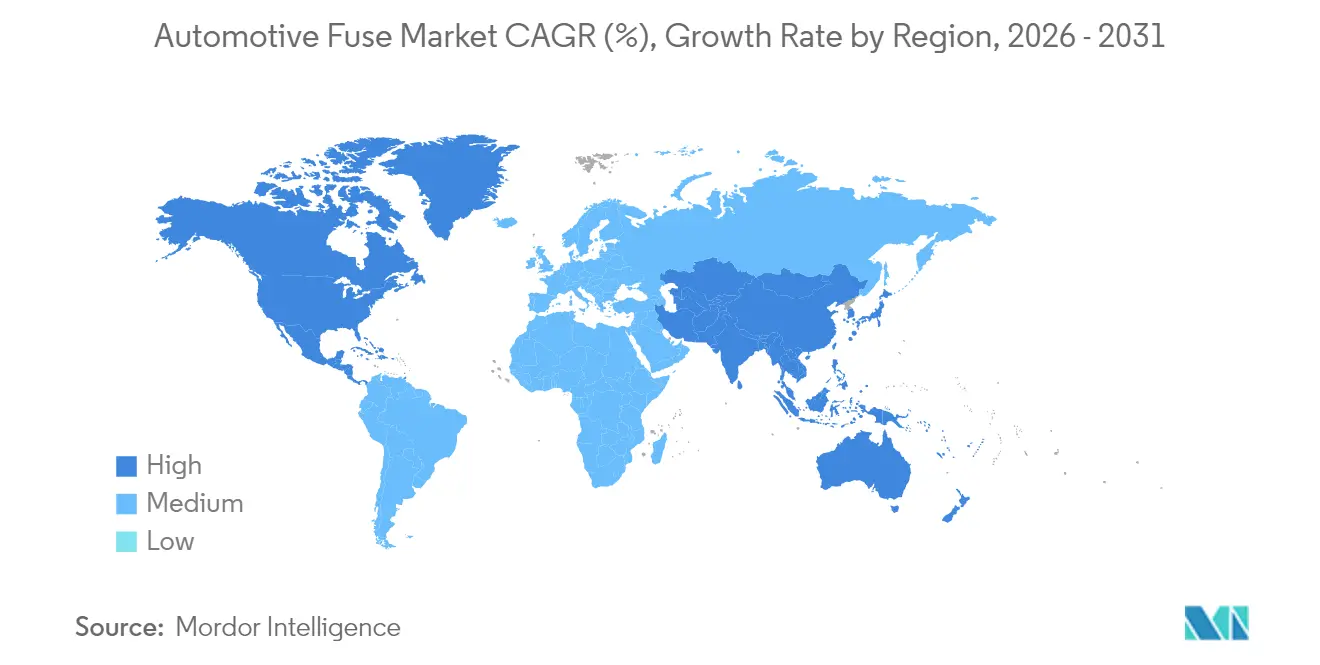
- By geography, Asia-Pacific commanded a 62.70% share in 2025 and is projected to post a 9.05% CAGR through 2031.
Note: Market size and forecast figures in this report are generated using Mordor Intelligence’s proprietary estimation framework, updated with the latest available data and insights as of 2026.
Market Trends and Insights
Drivers Impact Analysis of Automotive Fuse Market*
| DRIVER | (~) % IMPACT ON CAGR FORECAST | GEOGRAPHIC RELEVANCE | IMPACT TIMELINE |
|---|---|---|---|
| Surge in electric-vehicle production volume | +2.1% | China, Europe, North America | Medium term (2-4 years) |
| Higher electronic content per vehicle (ADAS, infotainment) | +1.8% | Premium segments globally | Long term (≥ 4 years) |
| Stringent safety norms mandating circuit-protection devices | +1.3% | Europe, North America, and expanding to the Asia-Pacific | Medium term (2-4 years) |
| Growth of connected commercial-vehicle telematics | +0.9% | North America, Europe, adoption in Asia-Pacific | Long term (≥ 4 years) |
| Adoption of 48 V mild-hybrid architectures | +0.7% | Europe, China, expanding globally | Medium term (2-4 years) |
| OEM shift toward smart self-resettable fuse modules | +0.4% | Premium segments globally, early adoption in Europe | Long term (≥ 4 years) |
| Source: Mordor Intelligence | |||
Surge in Electric-Vehicle Production Volume Drives Specialized Protection Demand
Electric-vehicle momentum is reshaping every layer of the automotive fuse market. Battery packs now operate at 400 V, 800 V, or even 1,000 V, forcing manufacturers to deliver fuses with DC interrupting capacities up to 30 kA and robust I²t values that stay stable across wide temperature windows. High-energy charging events create significant thermal stress, so vapor-phase solder, ceramic bodies, and silver elements are used to maintain low resistance under continuous load. The segment additionally boosts demand for pyrotechnic battery-disconnect fuses that open within 2 milliseconds during collisions, a capability now commercialized by Eaton.[1] Together, these requirements shift the automotive fuse market toward higher unit price points and deeper supplier qualification cycles.
Higher Electronic Content per Vehicle Amplifies Protection Requirements
Modern driver-assistance suites combine cameras, radars, and lidar sensors that draw varying peak currents during data acquisition. A single Level 2+ platform can host 100+ control units that each require primary and secondary over-current devices. Analog Devices highlights the need for low-profile fuses capable of withstanding cold-crank inrush without nuisance trips while still clearing short circuits within milliseconds.[2]The shift to software-defined vehicles keeps multiple power domains active at all times, leading to miniaturized surface-mount fuses rated up to 1,000 V DC in 5 × 20 mm footprints. Continuous connectivity heightens expectations for zero-downtime electrical architectures, which in turn stimulates demand for smart fuse modules that relay real-time current data to central gateways.[3]
Stringent Safety Norms Mandate Advanced Circuit Protection
Global Technical Regulation No. 20 and ISO 8820-8 set minimum performance thresholds covering interrupt rating, temperature rise, and vibration durability for high-voltage fuses.[4] Compliance requires multilayer protection: pack level, module level, and charger inlet level. Extensive third-party testing elevates entry barriers for unqualified suppliers, steering OEM sourcing toward established players with AEC-Q200 track records. The National Highway Traffic Safety Administration’s make-inoperative prohibition further drives genuine part replacement throughout the vehicle life cycle. Together, these mandates secure recurring revenue streams for certified fuse vendors and stabilize quality benchmarks across the automotive fuse market.
Adoption of 48 V Mild-Hybrid Architectures Creates Intermediate Voltage Opportunities
Europe-led adoption of 48 V electrification bridges the gap between 12 V legacy and 400 V high-voltage systems. TE Connectivity reports that board-level current demands in 48 V domains can exceed 200 A during start-stop and e-booster events. Specialized mini-blade and bolt-on fuses rated 60–125 V DC ensure safe energy flow while fitting existing fuse boxes. These architectures enable regenerative braking and torque assist in mainstream models, multiplying fuse attachment points across auxiliary compressors, electric turbochargers, and power steering modules. The mid-voltage zone thus adds depth to the automotive fuse market without cannibalizing traditional 12 V requirements.
Restraints Impact Analysis of Automotive Fuse Market*
| RESTRAINT | (~) % IMPACT ON CAGR FORECAST | GEOGRAPHIC RELEVANCE | IMPACT TIMELINE |
|---|---|---|---|
| Rising preference for solid-state power-distribution units | -1.4% | Premium segments in developed markets | Long term (≥ 4 years) |
| Shrinking ICE vehicle parc in mature markets | -1.1% | North America, Europe, Japan | Medium term (2-4 years) |
| Limited standardization of high-amp micro-blade formats | -0.6% | Global, with fragmentation across regions | Medium term (2-4 years) |
| Ceramic-substrate supply-chain concentration | -0.3% | Global dependency on Asia-Pacific suppliers | Short term (≤ 2 years) |
| Source: Mordor Intelligence | |||
Rising Preference for Solid-State Power-Distribution Units Challenges Traditional Fuses
Semiconductor-based e-fuses interrupt faults within microseconds and recover by command, eliminating physical replacement cycles. They integrate current sensing, thermal shutdown, and diagnostics that align with zonal architectures favored by premium EV makers. The cost premium and cooling complexity restrict use to higher trim levels today, but falling silicon prices signal a gradual spread into mid-market models. Conventional fuse suppliers respond by embedding sense resistors and digital interfaces into familiar housings to slow share erosion. This technology tug-of-war will temper volume growth for passive fuse formats even as total protection spending climbs.
Shrinking ICE Vehicle Production in Mature Markets Constrains Traditional Fuse Demand
Passenger car parc growth in the United States and Western Europe has flattened, with vehicle ages reaching 12 years or more. As OEMs accelerate EV launches, production lines for combustion models face consolidation, reducing yearly demand for low-voltage blade and cartridge fuses. Association of Equipment Manufacturers notes that component vendors now pivot toward aftermarket channels where replacement cycles extend further than original equipment demand. While electrified platforms inject high-value fuse opportunities, the net unit volume from ICE decline removes a structural layer of baseline growth from the automotive fuse market.
*Our forecasts treat driver/restraint impacts as directional, not additive. The impact forecasts reflect baseline growth, mix effects, and variable interactions.
Automotive Fuse Market Segment Analysis
By Fuse Type:
High-Voltage Variants Gain MomentumThe fuse-type hierarchy continues to evolve. Blade designs remained dominant with a 28.95% automotive fuse market share in 2025 due to low cost and entrenched distribution, reinforcing their importance within the broader electrical fuses market. Nevertheless, high-voltage cylinders, EV-specific bolt-ins, and pyrotechnic links together post an 8.59% CAGR, outpacing every other category. The automotive fuse market size for high-voltage devices benefits from the rising 400 V and 800 V battery pack adoption. OEM engineers favor silver-plated terminals and sand-filled bodies for stable arc extinction across wide ambient ranges. In response, Littelfuse released the 823A SMD fuse rated at 1,000 V DC, combining miniaturization with 63 A continuous current capability.
Innovation also manifests in smart micro-blade fuses equipped with integrated current sensors. These units enable predictive maintenance analytics within zonal gateways and are gaining pilot adoption in European premium brands. Glass tube fuses retain small niches in aftermarket accessories, while slow-blow formats protect HVAC blowers and seat-adjust motors where startup inrush peaks. Chip fuses ride the adoption wave of compact control modules, especially in radar and camera ECUs that demand low inductance and high surge capability.

By Ampere Rating:
> 60 A Class Sees Fastest GrowthLow-current 0–20 A fuses formed 34.72% of overall shipments in 2025, covering interior lighting, infotainment, and mid-tier ADAS domains. As EV architectures mature, powertrain inverters and onboard chargers create fresh demand at 400–600 A levels. This trend propels the > 60 A bracket to an 8.76% CAGR and lifts the automotive fuse market size for high-current devices. Sand-filled ceramic barrels with silver alloy elements dominate here because they keep the temperature rise below 90 °C at full load. ISO 8820 committee revisions now recommend extra insulation creepage for devices above 500 A at 1,000 V.
Mid-range 21–60 A segments still carry steering pumps, door modules, and 48 V e-turbo feeds. As mild hybrids proliferate, 48 V belt-starter generators draw 180 A peak, prompting modules that stack two 125 A links in parallel. Fuse vendors exploit this mix by offering modular holders that accept various ratings without retooling wiring harnesses. Continuous densification of electronics keeps every ampere band relevant, ensuring balanced revenue streams across the automotive fuse market.
By Vehicle Type:
Electrified Platforms Shape Protection ProfilesPassenger cars captured 60.65% of worldwide revenue in 2025, backed by strong volumes in China and North America. Battery electric cars, vans, and SUVs register a 8.95% CAGR through 2031, lifting the automotive fuse market size for high-voltage components. Pack protection uses bolt-on fusible links at the module and string levels. Commercial trucks evolve in parallel, adding 48 V and 800 V subsystems for e-axle drives that require multiple fuse families.
Hybrid and plug-in hybrid models act as a bridge, hosting both 12 V blade and 400 V cylindrical fuses in a single vehicle. Fuel-cell prototypes introduce yet another layer that demands hydrogen sensor guarding and high-voltage, low-temperature endurance. Each drivetrain pathway enlarges the total attachment points per vehicle, balancing any unit loss from shrinking pure ICE cohorts. The result sustains aggregate growth across the entire automotive fuse market.
Geography Analysis
APAC Automotive Fuse Market
Asia-Pacific maintained a 62.70% share in 2025 and is forecast to have a 9.05% CAGR through 2031. Continuous EV policy support in China and the local presence of tier-one electronics suppliers shorten development cycles, so new fuse formats reach mass production rapidly. Japan advances semiconductor materials that underpin compact surface-mount fuses, while South Korea leverages lithium-ion battery dominance to co-develop pack protection devices with global OEMs.
North America Automotive Fuse Market
North America shows stable but opportunity-rich dynamics. U.S. automakers invest in large battery pickup and delivery van lines, each equipped with dual-stage pyro fuses. The newly approved Inflation Reduction Act credits on domestically produced EVs accelerate adoption, bolstering regional demand for high-value protection modules. Canadian tier-twos escalate aluminum wire harness production, creating incremental requirements for compatible terminal plating on fuse leads.
Europe Automotive Fuse Market
Europe maintains a leadership stance on safety regulation and premium vehicle export. Euro NCAP integrates ADAS availability into its star rating, driving electronic redundancy and multiple fuse layers. German suppliers push smart power distribution units that blend solid-state switches and removable links, reflecting the region’s early migration toward zonal architectures.
MEA Automotive Fuse Market
Emerging Middle East and African assembly clusters remain small today but attract investment for knock-down EV kits that will need localized fuse sourcing. Collectively, the geographic spread preserves growth potential across the global automotive fuse market.
Regulatory Landscape
Automotive fuses are primarily governed by international road-vehicle fuse-link standards such as the ISO 8820 series, which defines terminology, test methods, and performance requirements across common fuse constructions used in vehicle electrical systems. As EV architectures move to higher system voltages (commonly 800 V and up to 1,000 V platforms within the report scope), standards workstreams referenced in the report context, such as high-voltage fuse-link standardization efforts (for systems up to 1,000 V AC/1,500 V DC in development), increase the emphasis on traceable qualification and third-party validation for OEM sourcing.
For market access in UNECE contracting-party countries, UNECE Regulation No. 10 (ECE R10) type-approval requirements on electromagnetic compatibility apply to vehicles and electronic sub-assemblies. This becomes more relevant as suppliers integrate sensing and communication into smart fuse modules. In parallel, battery-protection-oriented fuse-link requirements in IEC 60269-7:2025 (published as a European adoption in some countries) reinforce coordination between fuse interruption capability and battery-system operating conditions, tightening documentation and test expectations for suppliers serving electrified vehicle platforms.
Competitive Landscape
The automotive fuse market features moderate fragmentation. Littelfuse, Eaton, and Mersen retain broad portfolios spanning low-voltage blades to 1,000 V EV cylinders, giving them scale economies in tooling and testing. Littelfuse’s 823A Series SMD launch underscores a pivot toward compact, high-voltage formats that support battery management systems. Eaton, by contrast, leans on pyro-fuse technology that interrupts 20 kA short-circuit currents within 2 milliseconds, addressing crash isolation needs.
Semiconductor houses, such as onsemi, inject competition through fully electronic e-fuses that integrate current sensing and reset logic. These solutions appeal to OEMs pursuing wire-count reduction via zonal designs. TE Connectivity and Aptiv fast-track adaptable fuse holders and smart junction boxes that simplify upgrading from mechanical to solid-state units. Meanwhile, Gentex widens its portfolio through acquisitions that add audio and biometric modules, signaling convergence between protection, sensing, and infotainment.
Strategic partnerships center on material innovation. Ceramic substrate specialists such as Shandong Sinocera collaborate with fuse makers to deliver low-thermal-resistance bodies needed for 350 kW charging sessions. ISO and IEC committees sustain technical barriers that shield incumbents by mandating rigorous test programs. Overall, players that marry diagnostics, high-voltage tolerance, and global certification retain a competitive advantage in the growing automotive fuse market.
Automotive Fuse Industry Leaders
-
Littelfuse, Inc.
-
Eaton Corporation plc (Bussmann)
-
Mersen S.A.
-
AEM Components, Inc.
-
Pacific Engineering Corporation
- *Disclaimer: Major Players sorted in no particular order

Automotive Fuse Market Companies Covered in this Report
- Littelfuse, Inc.
- Eaton Corporation plc (Bussmann Division)
- Mersen S.A.
- AEM Components, Inc.
- Pacific Engineering Corporation
- ON Semiconductor Corporation
- Bel Fuse Inc.
- SCHURTER Holding AG
- OptiFuse
- TE Connectivity Ltd.
- Hirose Electric Co., Ltd.
- Furukawa Electric Co., Ltd.
- Yazaki Corporation
- Sumitomo Electric Industries, Ltd.
- Dongguan Tianrui Electronics Co., Ltd.
- Zhejiang Zhongan Fuse Co., Ltd.
- Blue Sea Systems, Inc.
- Conquer Electronics Co., Ltd.
- Daesung Electric Co., Ltd.
- Reomax Electronics Co., Ltd.
- Tianchen Electric Co., Ltd.
- GLOSO Tech Ltd.
- Leecraft Inc.
- Sensata Technologies, Inc.
- Würth Elektronik GmbH & Co. KG
Market Opportunities and Future Outlook
The main opportunity is shifting from purely passive protection to coordinated protection that pairs fast isolation (pyrotechnic disconnects) with diagnostics (smart and electronic fusing) in EV power distribution and battery management systems. Eaton commercialized dual-trigger EV pyro fuses that disconnect high-voltage packs within milliseconds during crash events, which supports OEM demand for deterministic disconnection layers alongside conventional fuse-links in the high-energy battery domain.
There is also scope for engineering tools and design methodologies that help OEMs and Tier-1s raise charging currents without oversizing protection hardware. For example, peer-reviewed work published in 2025 on physics-based thermal RC modeling for high-voltage melting fuses under fast-charging profiles points to increased use of model-driven fuse selection and thermal coordination with cables, contactors, and relays. Vendors that combine high-voltage (up to 1,000 V class) fuse portfolios with application guides and digital design support can address programs tied to 48 V domains, 800 V battery systems, and zonal architectures, where protection, sensing, and power distribution are specified together rather than as stand-alone fuse box line items.
Recent Industry Developments in Automotive Fuse Market
- July 2026: Littelfuse released TP5.0SMD-FL and TP1KSMB-FL FlatSuppressX TVS diodes aimed at protecting 48 V automotive electronic circuits. The launch supports higher transient robustness in modern 48 V domains that sit alongside fused power distribution, reinforcing supplier positioning as OEMs harden electrified subsystems against electrical overstress.
- February 2025: Eaton launched dual-trigger EV Pyro Fuses designed to disconnect high-voltage battery packs within 2 milliseconds during crash events. Adding a dual-trigger architecture strengthens pack-level isolation strategies and raises the bar for suppliers competing for high-voltage safety content on EV platforms.
- May 2024: Eaton announced higher-power fuses for electrified commercial vehicles, with devices handling up to 1,400 amps and 900 volts. The portfolio expansion addresses high-current protection needs in e-trucks and buses, where elevated operating currents increase the value of validated high-interrupting-capacity fuse solutions.
Automotive Fuse Market Report Scope and Research Methodology
Market Definition and Coverage
For this study, the automotive fuse market covers revenue from fuses used inside vehicles to protect circuits from over-current, across passenger and commercial platforms, and across ICE, hybrid, and electric architectures sold globally.
Scope exclusions: We exclude non-automotive fuses used in industrial power distribution, building wiring, and consumer electronics.
Segments Covered in This Report
- By Fuse Type
- Blade
- Glass
- Slow-Blow
- High-Voltage
- Chip
- Other Fuse Types
- By Ampere Rating
- 0 – 20 A
- 21 – 40 A
- 41 – 60 A
- > 60 A
- By Vehicle Type
- Passenger Cars
- Commercial Vehicles
- Battery-Electric Vehicles
- Hybrid and Plug-in Hybrid Vehicles
- Fuel-Cell and Other New-Energy Vehicles
- By Geography
- North America
- United States
- Canada
- Mexico
- South America
- Brazil
- Argentina
- Rest of South America
- Europe
- Germany
- United Kingdom
- France
- Italy
- Spain
- Russia
- Rest of Europe
- Asia-Pacific
- China
- Japan
- India
- South Korea
- South-East Asia
- Rest of Asia-Pacific
- Middle East and Africa
- Middle East
- Saudi Arabia
- United Arab Emirates
- Rest of Middle East
- Africa
- South Africa
- Egypt
- Rest of Africa
- Middle East
- North America
Data Sources, Market Sizing, and Validation
Desk Research
Desk work started with mapping demand drivers to vehicle electrical content, then checking them against public production and trade signals. We referred to sources such as OICA vehicle production statistics, UN Comtrade trade flows for electrical protection components, and International Energy Agency updates on EV adoption, since fuse requirements change with voltage level and electrical architecture.
To keep the model realistic, we also reviewed standards and technical references (including SAE and ISO documentation) and open patent databases to understand where fuse designs shift from low-voltage to higher-voltage use cases. Company annual reports, product catalogs, and investor presentations were used to confirm product mix, regional footprints, and typical application areas inside vehicles. Where needed, our analysts used paid databases for company financials and shipment-level import and export checks to validate unit flows. The sources listed here are illustrative, and many other public materials were also reviewed for data collection, validation, and clarification.
Primary Interviews and Surveys
Primary conversations were completed with a mix of fuse manufacturers, component distributors, and vehicle electrical engineering stakeholders, then followed by targeted surveys to confirm pricing logic and adoption by vehicle type. Because this is a global market, we balanced inputs across APAC, EMEA, and the Americas so electrification speed and local sourcing practices could be reflected in the assumptions.
Distribution of primary research fieldwork respondents
| Company type | Respondent position | Region |
|---|---|---|
| Top tier: 37% | CXOs: 15% | APAC: 52% |
| Mid tier: 46% | Functional/Unit leaders: 33% | EMEA: 30% |
| Smaller Players: 17% | Managers: 52% | Americas: 18% |
Market-Sizing & Forecasting
Our sizing starts with a top-down build that reconstructs fuse demand from vehicle output, electrification mix, and electrical architecture intensity, then converts that demand pool into value using observed pricing bands by fuse family. The totals are checked using selective bottom-up approximations, such as sampled ASP times estimated unit fitment per vehicle, plus channel checks on regional availability and replacement demand.
Inputs that mattered most included global vehicle production by region, EV and hybrid penetration, average fuse count per vehicle by platform complexity, the split between low-voltage and higher-voltage protection needs (for example, 48V subsystems and traction-battery related protection), and the pace of electronics additions in safety and comfort systems. We also tracked signals that usually shift pricing, such as material changes in fuse elements, packaging trends, and localized sourcing that affects landed prices. When bottom-up data points were missing for smaller countries, we used proxy ratios tied to vehicle output and parc mix, then corrected them after expert feedback.
For forecasting, scenario analysis was used so electrification speed, regional production shifts, and price progression could be varied in a controlled way. Assumptions were aligned to what interviewees said they are planning for in the next model cycles, and the final curve was reviewed to avoid unrealistic step-changes year to year.
Data Validation & Update Cycle
Validation was handled through repeated cross-checks between the model output and independent indicators, including vehicle production trends, EV sales direction, and trade movement patterns for related electrical protection parts. Outliers were flagged, re-tested for unit, currency, or timing issues, and then reviewed again before internal sign-off.
If a variance remained high for a region or a fuse category, we re-contacted industry participants to confirm whether the gap came from pricing, mix shifts, or reporting conventions. Reports are refreshed annually, and interim updates are made when material events change demand patterns, including sharp production slowdowns or faster-than-expected electrification. Before delivery, one last analyst pass is completed so clients receive the latest updated view rather than an older snapshot.
Mordor Intelligence's Global Automotive Fuse Market Size Compared Against Other Published Estimates
Published market numbers for automotive fuses often look different because the underlying build is not the same, even when the headline title is identical. The biggest differences usually come from what gets counted as an automotive fuse, which year is treated as the anchor, and how pricing is converted across regions.
Some published figures fold in adjacent electrical protection devices or bundle broader circuit protection revenues across vehicle and non-vehicle applications, which inflates the total. Mordor Intelligence counts only automotive-use fuses and keeps value tied to vehicle demand signals (production, electrification mix, and typical fuse fitment), and then it is rechecked through interviews so pricing and mix do not drift away from reality.
Benchmark comparison
| Source | Market Size | Gaps in Research Methodology |
|---|---|---|
| Mordor Intelligence | USD 2.27 B (2026) | |
| Industry Research Firm A | USD 3.40 B (2025) | Uses a different anchor year and a faster growth curve, and it appears to apply higher assumed fuse value per vehicle that may not separate low-voltage fuses from higher-voltage protection in a consistent way. |
| Online Report Portal B | USD 0.61 B (2025) | Likely reflects a narrower counted scope, which can happen when only a subset of fuse types or only OEM-installed volumes are included, and when pricing is kept conservative without cross-checking against regional mix. |
The spread in the table is mainly explained by scope and anchoring choices, followed by how ASP and vehicle mix are handled across regions. By keeping the demand pool traceable to vehicle output and electrification signals, and then validating the pricing bands in follow-up calls, the final estimate stays reproducible and easier to audit year over year.
Key Questions Answered in the Report
How large is the automotive fuse market in 2026?
The automotive fuse market size is USD 2.27 billion in 2026 and is projected to reach USD 3.19 billion by 2031.
What is the expected growth rate for automotive fuses?
The market is on track for a 7.04% CAGR during 2026-2031, fueled by vehicle electrification and higher electronic content.
Which fuse type is growing fastest?
High-voltage fuses, used in 400 V and 800 V EV battery packs, are advancing at an 8.59% CAGR.
Which region dominates demand for automotive fuses?
Asia-Pacific holds a 62.70% share in 2025 and is forecast to have the fastest regional CAGR of 9.05%.