
Market Overview
| Study Period | 2021 - 2031 |
|---|---|
| Market Size (2026) | USD 14.9 Billion |
| Market Size (2031) | USD 20.03 Billion |
| Growth Rate (2026 - 2031) | 6.11 % |
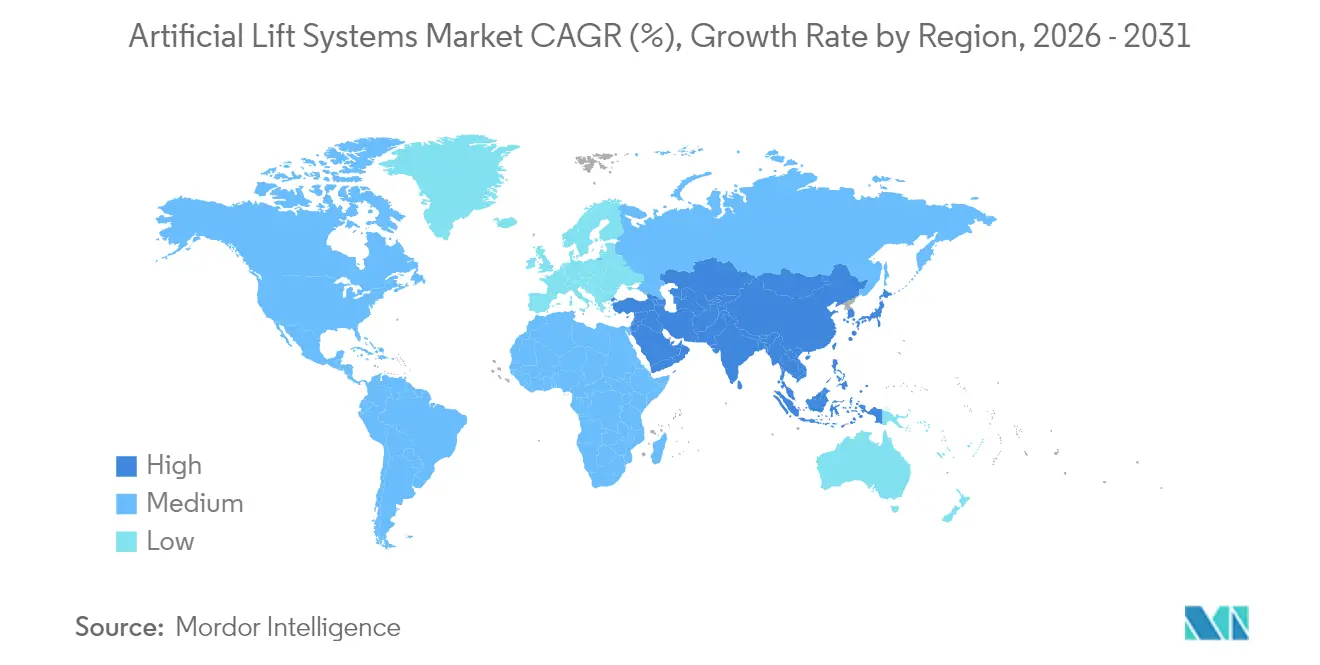
| Fastest Growing Market | Middle East and Africa |
| Largest Market | North America |
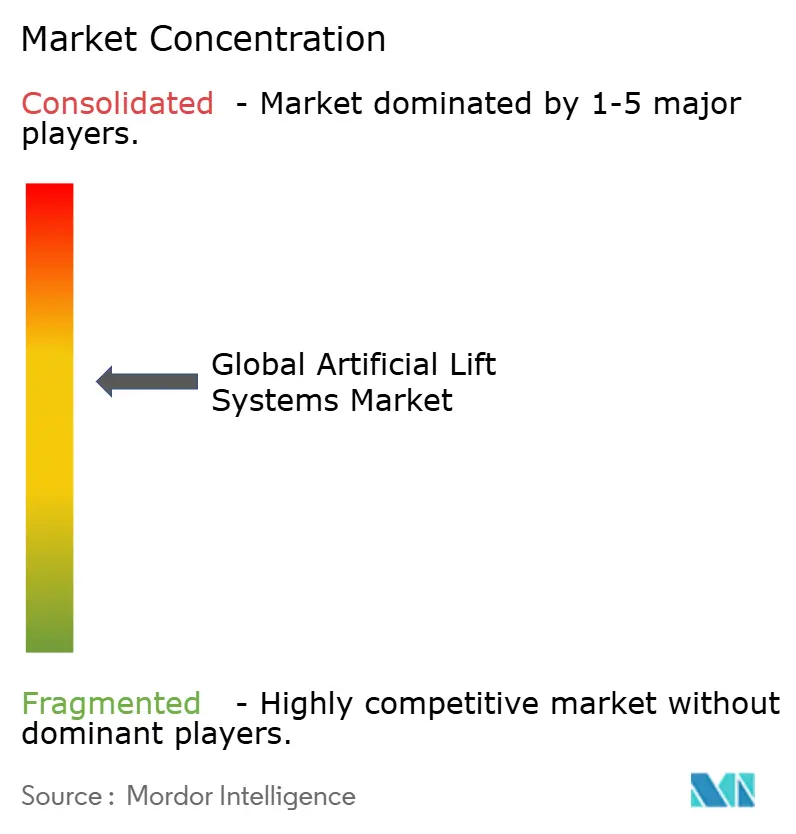
| Market Concentration | Medium |
Major Players *Disclaimer: Major Players sorted in no particular order Image © Mordor Intelligence. Reuse requires attribution under CC BY 4.0. | |
Artificial Lift Systems Market Analysis by Mordor Intelligence
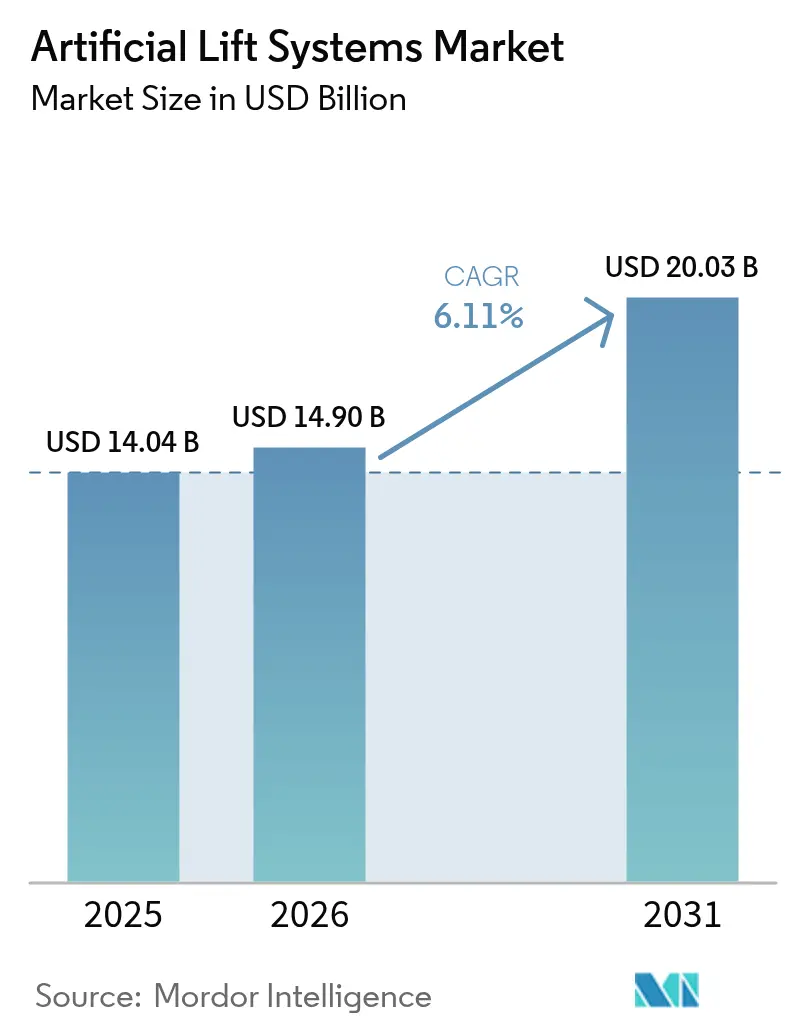
The Artificial Lift Systems Market size was valued at USD 14.04 billion in 2025 and estimated to grow from USD 14.9 billion in 2026 to reach USD 20.03 billion by 2031, at a CAGR of 6.11% during the forecast period (2026-2031).
Growth is shifting from rapid capacity additions to steady performance gains as operators use technology to recover more from existing wells rather than drill new ones. Horizontal drilling in shale, rising mature-field workovers, and digital optimization platforms remain the main demand engines. Permanent-magnet motors, AI-enabled variable-speed drives, and longer-life elastomers are raising run times and trimming power costs. Mergers like SLB’s ChampionX deal illustrate how scale and data integration are now the primary competitive advantages.
Key Report Takeaways
- By lift type, electric submersible pumps (ESP) led with 38.70% of the artificial lift systems market share in 2025; progressive cavity pumps (PCP) are set to grow at a 7.76% CAGR through 2031.
- By well orientation, horizontal wells accounted for 49.60% of the artificial lift system market size in 2025 and are projected to expand at a 6.33% CAGR to 2031.
- By reservoir type, unconventional formations commanded the highest growth at a 8.55% CAGR, while conventional reservoirs retained 59.30% revenue share in 2025.
- By application, onshore installations represented 65.40% of the artificial lift market size in 2025, while offshore installations are advancing at a 9.1% CAGR through 2031.
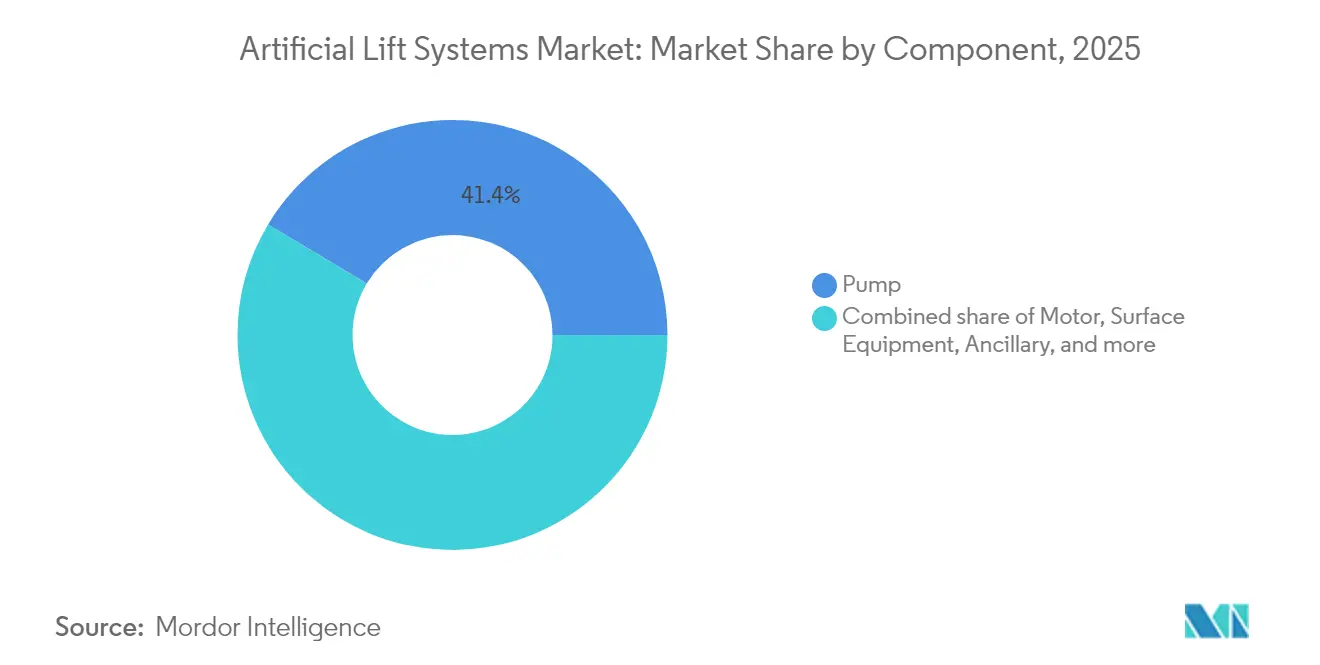
- By component, pump assemblies generated 41.40% of 2025 revenue and are projected to rise at a 6.78% CAGR.
- By service, installation and commissioning held 46.50% of 2025 revenue; optimization and monitoring services are growing at a 6.69% CAGR.
- By geography, North America captured 35.60% revenue share in 2025; the Middle East and Africa region is the fastest-growing at a 6.95% CAGR to 2031.
Note: Market size and forecast figures in this report are generated using Mordor Intelligence’s proprietary estimation framework, updated with the latest available data and insights as of 2026.
Global Artificial Lift Systems Market Trends and Insights
Drivers Impact Analysis*
| Driver | (~) % Impact on CAGR Forecast | Geographic Relevance | Impact Timeline |
|---|---|---|---|
| Up-cycle in mature well rejuvenation spending | +1.20% | Global, concentrated in North America & Middle East | Medium term (2-4 years) |
| Rapid horizontal drilling in unconventional reservoirs | +0.90% | North America, Argentina Vaca Muerta, China | Short term (≤ 2 years) |
| Digitalization of lift optimization (AI-enabled VSDs) | +0.80% | Global, early adoption in North America & Middle East | Long term (≥ 4 years) |
| Shift to deeper offshore pre-salt plays | +0.70% | Brazil, Guyana, West Africa | Medium term (2-4 years) |
| ESG-driven demand for energy-efficient lift systems | +0.50% | Global, regulatory pressure in Europe & North America | Long term (≥ 4 years) |
| Niche geothermal repurposing of ESP strings | +0.20% | Global, concentrated in geothermal-active regions | Long term (≥ 4 years) |
| Source: Mordor Intelligence | |||
Mature Well Rejuvenation Up-cycle
Operators are redirecting capital toward squeezing more barrels from aging wells because workovers cost 60-70% less than new drilling and deliver internal rates of return above 30%. Saudi Aramco alone earmarked USD 3.5 billion for AI-driven production optimization in 2024, underscoring the long-range commitment to asset life extension. (1)Source: OilPrice Staff, “Saudi Aramco Bets on AI for Production Optimization,” oilprice.com Production engineers report that adding the right artificial lift string can lengthen a well’s producing life by 15-20 years and defer abandonment liabilities. Service firms see stable demand because mature-field activity is less sensitive to oil-price swings than frontier exploration. Continued crude prices above USD 60 per barrel support this driver, though lower pricing would slow capital release.
Horizontal Drilling in Unconventional Reservoirs
Tier-2 shale acreage now moves to the development phase, and its steep decline curves force lift deployment within 12-18 months of first oil. Argentina’s Vaca Muerta hit 757,122 barrels per day in December 2024, requiring sophisticated lift systems across a growing inventory of laterals. Machine-learning tools improve bottom-hole pressure forecasting and reduce equipment oversizing by 25-30%. Early lift adoption in China’s Ordos Basin supports tight-gas production goals and keeps the economics viable at USD 40 per barrel. These factors combine to widen the addressable artificial lift system market within the unconventional sector well past North America.
Digitalization of Lift Optimization (AI-Enabled VSDs)
AI-enabled variable-speed drives and cloud analytics move lift management from reactive to predictive. ExxonMobil’s automated gas-lift controls boosted output 2.2% across 1,300 wells with no extra crew. Edge-based algorithms now harmonize surface power, downhole sensors, and reservoir data in real time, saving 20-30% energy. Halliburton and Baker Hughes are packaging these algorithms with hardware warranties, shifting commercial models to outcome-based service. Barriers include legacy data silos and a shortage of data scientists versed in field operations, yet rapid replication once the groundwork is laid limits the window for first-mover advantage.
Shift to Deeper Offshore Pre-Salt Developments
Brazil’s pre-salt production boom and Guyana’s fast-tracked projects require systems that survive under high pressure and temperature for five-plus years. SLB’s USD 800 million integrated services contract with Petrobras highlights demand for subsea boosting and electric interval control valves that cut intervention needs. Offshore operators accept 300-400% higher lift equipment prices when they lower unplanned workovers exceeding USD 10 million per job. Electric architecture also aligns with corporate carbon-reduction goals by removing hydraulic fluids and allowing topside power optimization.
Restraints Impact Analysis*
| Restraint | (~) % Impact on CAGR Forecast | Geographic Relevance | Impact Timeline |
|---|---|---|---|
| Volatile crude-price CAPEX compression cycles | -1.10% | Global, acute in price-sensitive regions | Short term (≤ 2 years) |
| High work-over costs in ultra-deepwater | -0.60% | Offshore regions, Brazil, Gulf of Mexico, West Africa | Medium term (2-4 years) |
| Supply-chain bottlenecks in specialty elastomers | -0.40% | Global, manufacturing concentrated in Asia | Short term (≤ 2 years) |
| Skilled-labor shortages for automation retrofits | -0.30% | Global, acute in North America & Europe | Medium term (2-4 years) |
| Source: Mordor Intelligence | |||
Crude-Price CAPEX Compression Cycles
When Brent drops below USD 60 per barrel, operators defer artificial lift budgets by up to 30% as seen in 2020. Despite new modular strings that can be installed incrementally, payback horizons of 18-24 months still look risky in choppy markets. Analysts expect modest 1% further well-cost reductions in 2025, which will not fully counteract price uncertainty.(2)Source: American Oil & Gas Reporter, “Well-Cost Outlook 2025,” aogr.com Suppliers respond by offering rental and performance-based contracts, but bank lending terms remain tied to commodity forecasts, limiting capital availability during downturns.
High Work-Over Costs in Ultra-Deepwater
A deepwater artificial lift intervention can cost USD 5-15 million versus USD 200,000 onshore, so operators stretch run-life targets to 7-10 years. Required special vessels bill USD 500,000-800,000 daily, making reliability the overriding purchase criterion. Retrievable systems such as Baker Hughes’ AccessESP reduce work-over frequency but carry 40-60% price premiums. Economics worsen beyond 2,000 meters of water depth, delaying artificial lift installation up to three years after first production.
*Our forecasts treat driver/restraint impacts as directional, not additive. The impact forecasts reflect baseline growth, mix effects, and variable interactions.
Segment Analysis
By Lift Type: ESP Leadership Faces PCP Momentum
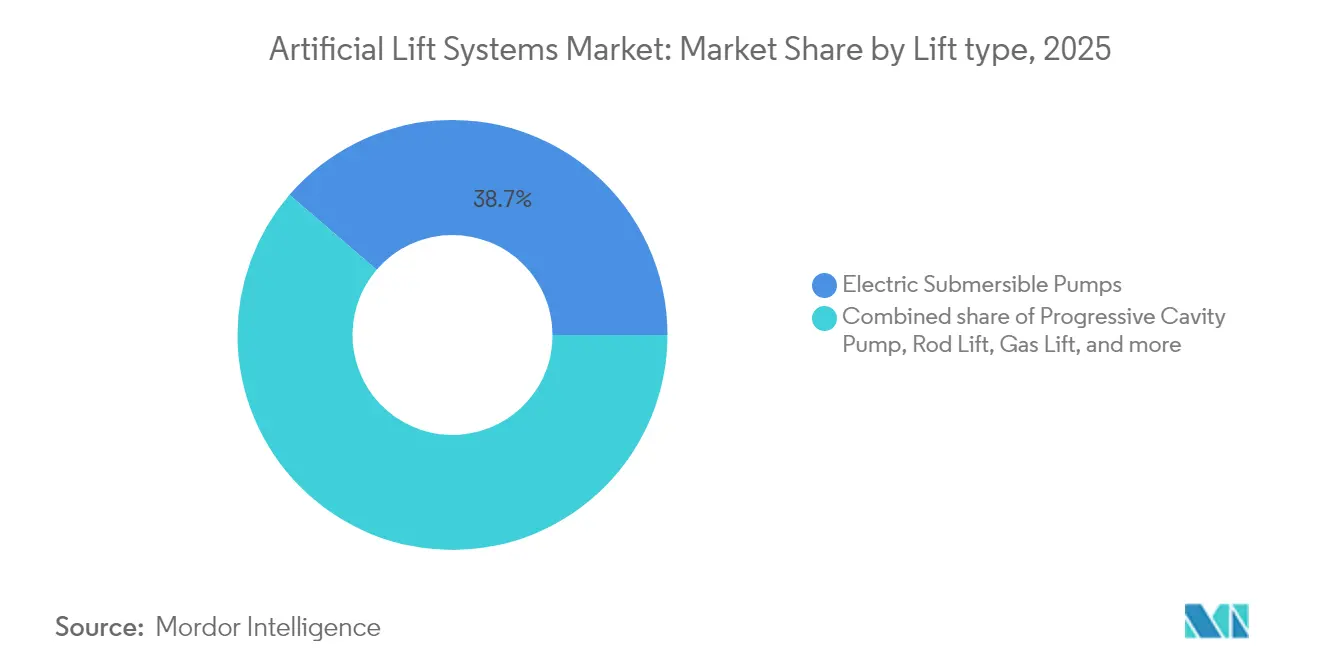
Electric submersible pumps retained 38.70% revenue in 2025, confirming their versatility for flow rates from 100 to 30,000 barrels per day. Progressive cavity pumps, however, are advancing at an 7.76% CAGR because their single-rotor design handles heavy crude and sand without rapid wear. SLB’s PowerEdge ESPCP hybrid now blends ESP reliability with PCP tolerance for abrasives while lowering CO₂ output by 55%.
Rod-lift still anchors legacy onshore wells because of low running costs, while gas-lift excels offshore, where minimal downhole hardware is valued. Hydraulic piston and jet pumps stay in niche, sandy, or remote environments. Plunger-lift clears liquids in low-pressure gas wells. The direction is toward hybrid packages that combine two or more methods, giving operators tailored solutions as reservoirs mature. As permanent-magnet motors push ESP efficiency up 20%, suppliers expect stiffer competition between ESP and PCP platforms over the forecast horizon.


By Well Orientation: Horizontal Wells Raise Technical Bar
Horizontal wells supplied 49.60% of the 2025 artificial lift market revenue and will expand at a 6.33% CAGR to 2031. Their complex flow regimes drive innovation in gas-handling separators and slim-line ESP stages that fit tighter completions. Permanent-magnet motors reached 11% horizontal-well adoption in 2024 because they deliver higher power in shorter housings, an asset where lateral space is scarce.
Vertical wells remain vital in conventional provinces that value proven equipment and low intervention cost. Standardization in horizontal completion tools has narrowed the installation cost gap, yet horizontal wells still carry 150-200% higher artificial lift outlays. Autonomous inflow control devices now cut water cut by more than 80% in horizontals, extending pump life and shrinking lifting cost curves. This technological feedback loop reinforces the shift toward laterals, even in regions once dominated by vertical producers.
By Reservoir Type: Unconventional Rise Continues
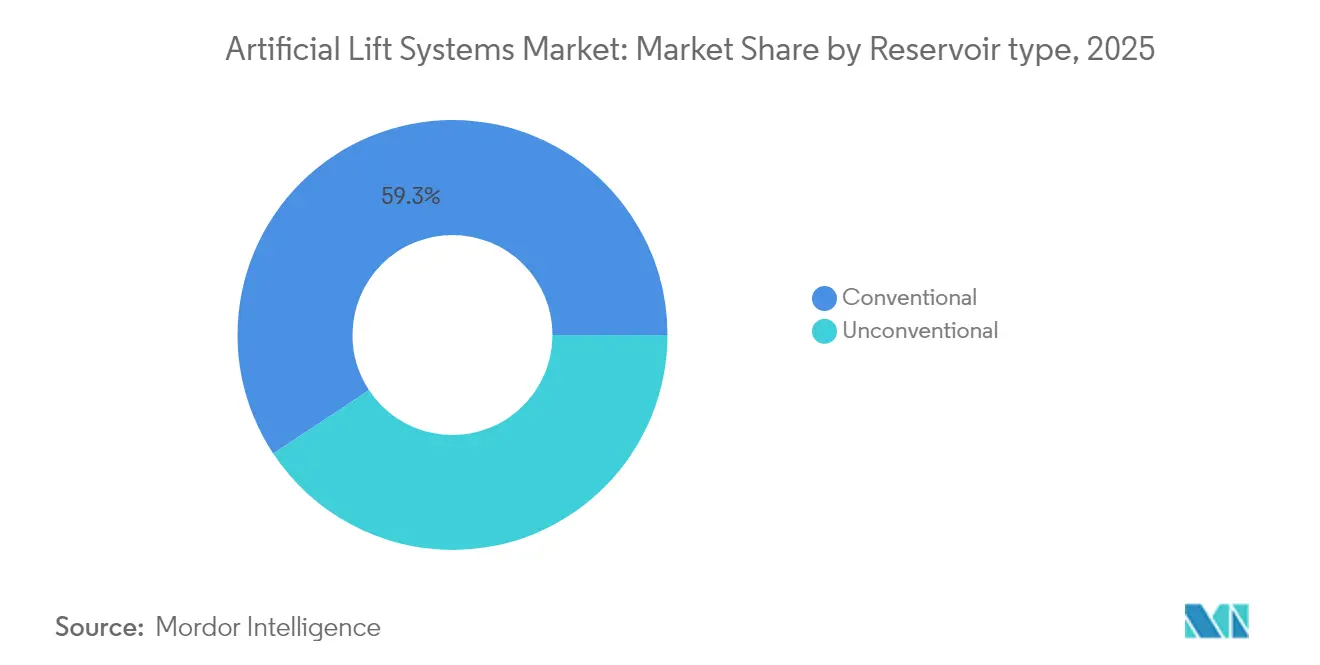
Conventional fields held 59.30% of 2025 sales, but unconventional reservoirs are growing fastest at 8.55% CAGR as shale, tight oil, and tight gas proliferate. Rapid early declines force artificial lift installation within 12-18 months, compared with up to five years for conventional wells. Machine-learning software now fine-tunes lift sizing, lowering premature failures by 25-30% in shale settings.
Shale gas requires dual-mode gas-lift/pressurization compressors to curb liquid loading. As break-even prices fall to USD 40 per barrel, more marginal acreage screens in, expanding the artificial lift system market. Conventional projects still command the highest capital, but unconventional barrels add volume and data service companies use to perfect predictive models, benefiting both reservoir classes.
By Application: Offshore Premiumization Accelerates
Onshore fields generated 65.40% of 2025 revenue due to the lower logistics costs and the ability to fine-tune lift settings frequently. The offshore segment, though smaller, is surging at a 9.1% CAGR as Brazil, Guyana, and West Africa sanction deeper projects needing long-life subsea boosting the artificial lift systems industry. Offshore strings fetch 300-400% price premiums because failure triggers expensive rig or vessel mobilization.
Subsea boosting is the standout offshore growth pocket. SLB’s recent Petrobras award for raw seawater injection illustrates how these systems cut topside complexity and emissions. Electrification trends favor all-electric subsea architecture, eliminating hydraulic lines and allowing remote updates that shrink personnel exposure. This premiumization offsets lower unit volumes and drives steady revenue growth.
By Component: Pump Efficiency Takes Center Stage
Pump assemblies accounted for 41.40% of artificial lift systems market revenue in 2025 and will rise at a 6.78% CAGR as permanent-magnet motors, abrasion-resistant coatings, and multi-phase stage designs lengthen mean-time-between-failure. Halliburton’s TrueSync hybrid motor delivers 20% efficiency gains while keeping synchronous rotation under heat and load extremes.
Variable-speed drives and digital controllers see a fast uptake because production optimization depends on real-time analytics. Surface equipment integrates cloud connectivity, and ancillary parts such as seal sections embed sensors that stream health data to remote centers. Fiber-optic monitoring, typified by Baker Hughes’ SureCONNECT FE, provides continuous downhole feedback without pulling the string. These advances lower field crews and support outcome-based service contracts.
By Service: Digital MRO Shifts Risk
Installation and commissioning held 46.50% of 2025 service revenue, but optimization and monitoring platforms are gaining 6.69% yearly. ChampionX’s Artificial Lift Performance Limited acquisition shows how analytics bolsters a traditional service portfolio.
Predictive maintenance solutions now warn of failures 30-60 days ahead, cutting downtime up to 50%. Vendors increasingly guarantee barrels rather than uptime, aligning incentives with operators. Remote operations centers watch thousands of wells, dispatching crews only when analytics trigger an alert. This shift trims labor costs and offsets North America and Europe technician shortages.
Geography Analysis
North America secured a 35.60% share of the artificial lift systems market in 2025, anchored by prolific shale plays and a culture of rapid technology adoption. SLB reported 400% ESP run-life improvements in the Permian Basin after combining gas-handling designs with engineered completions. Automation helps counter regional labor tightness, yet shortages of skilled crews and specialty elastomers remain bottlenecks for the artificial lift system market. The market is moving toward optimization services rather than new hardware as infrastructure matures.
The Middle East and Africa is the fastest-growing region at a 6.95% CAGR, propelled by USD 730 billion in upstream spending through 2030 and a pipeline of enhanced-oil-recovery projects. ADNOC’s RoboWell program cut gas-lift use by 30%, revealing the region’s appetite for high-end digital solutions. National oil companies are bundling R&D commitments with large procurement lots, locking in long-term service relationships that favor integrated suppliers.
South America’s growth revolves around Argentina’s Vaca Muerta and Brazil’s pre-salt. SLB’s USD 1 billion subsea contracts with Petrobras demonstrate confidence in long-life boosting systems that withstand corrosive CO₂ and H₂S. Guyana will exceed 800,000 barrels daily by 2025, further enlarging demand for subsea lift packages. Technology transfer agreements aim to build local supply hubs, shortening lead times and fostering skilled labor pools.

Regulatory Landscape
Artificial lift deployment is increasingly shaped by emissions-monitoring requirements and offshore safety rules that influence equipment design, measurement practices, and documentation. In the European Union, Regulation (EU) 2024/1787 (effective August 2024) mandates methane emissions reporting and leak detection and repair (LDAR) obligations across the energy sector, reinforcing demand for integrated monitoring around producing wells and the associated facilities where artificial lift is installed.
For offshore operations, US requirements continue to codify testing and integrity expectations for subsea lift-related components, including specific technical requirements under 30 CFR 250.873. In June 2026, the US Bureau of Safety and Environmental Enforcement (BSEE) issued an updated final rule that incorporates dozens of referenced standards into offshore operations, which is pushing suppliers toward tighter conformance with recognized technical standards. Parallel standardization work, including GSO ISO 15551:2025 for ESP systems in GCC markets and ISO work on PCP-related standards, supports more harmonized specifications for manufacturers serving multiple regions.
Competitive Landscape
The artificial lift systems market shows moderate consolidation as major service firms merge analytics, chemicals, and hardware to secure holistic production contracts. SLB’s USD 7.8 billion ChampionX acquisition creates the industry’s broadest production optimization portfolio and targets USD 400 million in annual synergies. Baker Hughes and Halliburton counter with electrification roadmaps and autonomous control suites that promise lower carbon intensity and higher uptime.
Competitive edge now rests on data rather than steel; firms that harvest real-time telemetry and refine predictive algorithms control recurring service revenues. Upwing Energy’s magnetic-thrust-bearing ESP could disrupt established designs by removing friction and heat, illustrating how emerging specialists carve niches. (3)Source: Upwing Energy, “Active Magnetic Bearing ESP Technology,” upwingenergy.com Patent filings in permanent-magnet motors, fiber-optic sensing, and closed-loop AI workflows continue to rise, confirming sustained R&D intensity.
Supply-chain stress for specialty elastomers and electronics persists, limiting short-term output and favoring vertically integrated suppliers in the artificial lift system market. Regional challengers in China and Russia invest in domestic motor plants to hedge geopolitical risks. Overall, competition is shifting toward outcome-based contracts in which providers shoulder performance risk while operators focus on capital allocation.
Artificial Lift Systems Industry Leaders
Halliburton Company
Schlumberger Limited.
Weatherford International Ltd
Baker Hughes Co
Dover Corp
- *Disclaimer: Major Players sorted in no particular order

Market Opportunities and Future Outlook
Near-term opportunity is centered on scaling digitally optimized, lower-touch lift operations that combine hardware with edge analytics, automation, and integrated surveillance. The market context already points to measurable gains from automation and monitoring at scale, including automated gas-lift controls across 1,300 wells, and to field case studies of edge computing and IIoT enabling autonomous artificial lift optimization across multi-basin deployments (published in 2026). This supports whitespace for suppliers that can bundle variable-speed drives, downhole sensing, and remote operations workflows into performance-based service packages, particularly where skilled-labor constraints are binding.
Technology-driven redevelopments in mature assets and unconventional horizontals also create scope for fit-for-purpose lift strings and retrofits. Documented examples such as slim-hole PCP deployment in small tubing across a 1,000-well program (reported in 2026 technical literature) show how reliability improvements and failure-rate reductions translate into operator savings, supporting broader adoption of abrasion-tolerant PCP designs and hybrid options like ESPCP in sand-prone, high-water-cut, or constrained-completion settings. Offshore premium applications remain an upside pocket where intervention avoidance is central, aligned with the market shift toward long-life subsea boosting and all-electric architectures referenced in the context, including recent Petrobras-related subsea awards.
Recent Industry Developments
- March 2026: Flowco completed its acquisition of Valiant Artificial Lift Solutions for about USD 200 million. The deal broadened Flowco’s artificial lift and production optimization offerings and strengthened its ability to provide integrated packages across lift equipment and related field services.
- December 2025: Baker Hughes won a multi-year contract from Kuwait Oil Company to supply electric submersible pumps, integrated with its FusionPro intelligent production drive and Leucipa automated field production solution. The award reflects growing demand for bundled lift hardware plus automation to improve uptime and standardize optimization across large producing-well inventories.
- April 2024: SLB introduced the Reda Agile compact wide-range ESP system and the rodless Reda PowerEdge ESPCP system. These launches targeted broader operating envelopes and improved tolerance to challenging well conditions, supporting the industry shift toward hybrid lift configurations and higher-efficiency packages.


Research Methodology Framework and Report Scope
Market Definition and Coverage
This market covers revenue generated from artificial lift systems used to increase fluid production from oil and gas wells when natural reservoir pressure is not enough. It includes the main lift technologies, related surface and downhole equipment, and associated services sold for onshore and offshore installations.
Scope exclusions: Excludes upstream drilling and completion services that are not directly tied to installing, operating, or maintaining artificial lift equipment.
Segmentation Overview
- By Lift Type
- Electric Submersible Pumps (ESP)
- Progressive Cavity Pump (PCP)
- Rod Lift (Beam, Sucker-Rod)
- Gas Lift
- Hydraulic Piston and Jet Pumps
- Plunger Lift
- Other Niche Systems (Hydraulic Submersible, Capillary)
- By Well Orientation
- Horizontal Wells
- Vertical Wells
- By Reservoir Type
- Conventional
- Unconventional (Shale/Tight)
- By Application
- Onshore
- Offshore
- By Component
- Pump
- Motor
- Variable Speed Drive and Controls
- Surface Equipment
- Ancillary (Sensors, Seal-Sections, Packers)
- By Service
- Installation and Commissioning
- Optimization and Monitoring
- Maintenance, Repair and Overhaul (MRO)
- By Geography
- North America
- United States
- Canada
- Mexico
- Europe
- United Kingdom
- Germany
- France
- Spain
- Nordic Countries
- Russia
- Rest of Europe
- Asia-Pacific
- China
- India
- Japan
- South Korea
- ASEAN Countries
- Rest of Asia-Pacific
- South America
- Brazil
- Argentina
- Colombia
- Rest of South America
- Middle East and Africa
- United Arab Emirates
- Saudi Arabia
- South Africa
- Egypt
- Rest of Middle East and Africa
- North America
Data Sources, Market Sizing, and Validation
Desk Research
Desk research starts by building a clean demand context for artificial lift, where well count, production profile, and field maturity matter more than broad energy spending headlines. We relied on public sources such as the EIA, OPEC, IEA, and national petroleum ministries for production and outlook data, and then cross-checked with regulators and operators where filings are available.
To keep assumptions grounded, we also used investor presentations and annual reports, and we reviewed technical papers and journals on lift selection and failure modes. We added association or conference materials that summarize deployment trends to compare what is reported versus what is implied by well intervention patterns. Where public data was thin, we used paid subscriptions for company financials and news, patent lookups, and shipment-level trade statistics to validate directional equipment demand. These examples are illustrative only, and we reviewed additional sources for data collection, validation, and clarification.
Primary Interviews and Surveys
Primary research was used to pressure-test the desk assumptions on where lift is being added, replaced, or optimized, and what that means for unit economics. We spoke with operators, service teams, and equipment stakeholders across major producing regions to confirm adoption by lift type, typical change-out cycles, and practical offshore constraints versus onshore operations.
Distribution of primary research fieldwork respondents
| Company type | Respondent position | Region |
|---|---|---|
| Top tier: 37% | CXOs: 18% | APAC: 44% |
| Mid tier: 43% | Functional/Unit leaders: 32% | EMEA: 31% |
| Smaller Players: 20% | Managers: 50% | Americas: 25% |
Market-Sizing & Forecasting
Sizing begins with a top-down build that reconstructs the addressable spend from the active producing well base and the share of wells that typically require lift by basin maturity, fluid mix, and depletion stage, then converts that demand pool into revenue using indicative system and service pricing. The totals are corroborated using selective bottom-up approximations, such as sampled volume-by-type checks, channel feedback on run rates, and a sanity roll-up from publicly visible supplier revenue exposure, which helps correct over-counting in regions with heavy workover activity.
Key inputs used in the model include crude and liquids production outlook, producing well counts and decline rates, onshore versus offshore activity mix, lift selection trends by well depth and water cut, and replacement frequency tied to run life and intervention practices. For the forecast, we ran scenario analysis around upstream spending and production guidance, then applied an adjustment layer based on interview feedback on lead times and service intensity, so growth does not move mechanically with oil price alone. Where unit-level data was unavailable, we handled gaps by using proxy penetration rates from comparable basins and then re-validating the resulting revenue ranges through primary checks.
Data Validation & Update Cycle
Outputs were validated through cross-checks against independent signals such as regional production trends, activity indicators, and the expected share of mature wells, and then reviewed for unusual jumps that do not match known field development cycles. When variances showed up, we revisited assumptions, and we triggered follow-up calls to confirm whether the change came from pricing, mix, or a real demand shift.
Before sign-off, the model and narrative go through multiple analyst review steps so key inputs, math, and definitions stay consistent across chapters. Reports are refreshed annually, and interim updates are added when material events occur, followed by a final pre-delivery pass to reflect the latest public information.
Mordor Intelligence's Global Artificial Lift Systems Market Market Size Versus Other Published Estimates
Published market sizes for artificial lift often differ because authors do not always count the same revenue streams, and the starting year and currency timing can also change the result. Differences also show up when one model ties demand to well-level need and replacement cycles, while another leans more heavily on broader upstream spend or supplier statements.
Workover rigs and non-lift well intervention services are the main exclusions, and they sit outside Mordor Intelligence's artificial lift systems scope, which is why some broader upstream service totals read higher even when the same producing basins are discussed. Another common driver is ASP progression, where some estimates apply aggressive price uplift across all lift types, even though run life, service intensity, and offshore constraints shift the mix in a more uneven way.
Benchmark comparison
| Source | Market Size | Gaps in Research Methodology |
|---|---|---|
| Mordor Intelligence | USD 14.04 B (2025) | |
| Industry Publisher A | USD 12.80 B (2024) | Uses an earlier base year and a different activity context, and the estimate may reflect a narrower definition of what is counted as lift-related services versus general production operations. |
| Industry Publisher B | USD 13.90 B (2024) | Reported at a different year and may apply a broader component bundle and price escalation assumptions that do not fully separate replacements from incremental installations across regions. |
The spread in the table is mostly explained by year alignment and what gets counted as lift-only revenue versus adjacent production work. By keeping the scope tied to measurable lift deployment signals, and then checking totals against interview-backed replacement and pricing logic, the final number stays traceable and repeatable for planning use.


Key Questions Answered in the Report
What is the current size of the artificial lift systems market?
The market will reach USD 14.9 billion in 2026 and is forecast to hit USD 20.03 billion by 2031
Which lift type leads the market today?
Electric submersible pumps hold 38.70% revenue, keeping them in pole position.
Why are progressive cavity pumps gaining ground?
Their ability to manage heavy oil and abrasive sand drives an 7.76% CAGR through 2031.
Which region is growing fastest in the artificial list system market?
The Middle East and Africa is expanding at a 6.95% CAGR, backed by USD 730 billion in upstream investments.
How is digitalization changing artificial lift services?
AI and variable-speed drives boost production 2-4% and cut energy use up to 30%, shifting service contracts toward performance guarantees.
What is the main restraint for offshore artificial lift adoption?
Ultra-Deepwater work-over costs of USD 5-15 million per intervention make reliability non-negotiable.
Page last updated on:


 Your data is secure and never sold or shared.


